| Param | Original file | Final file |
|---|---|---|
| Filename | modeM0/AS1G06_136T02_9000000876_06525cztM0_level2.evt | modeM0/AS1G06_136T02_9000000876_06525cztM0_level2_quad_clean.evt |
| Size (bytes) | 428,299,200 | 99,535,680 |
| Size | 408.5 MB | 94.9 MB |
| Events in quadrant A | 2,950,939 | 642,340 |
| Events in quadrant B | 3,345,136 | 653,636 |
| Events in quadrant C | 2,927,989 | 646,117 |
| Events in quadrant D | 3,301,764 | 615,737 |
| Mode M0 | |||
|---|---|---|---|
| Quadrant | BADHDUFLAG | Total packets | Discarded packets |
| A | 0 | 13435 | 3 |
| B | 0 | 14502 | 2 |
| C | 0 | 13476 | 2 |
| D | 0 | 14563 | 2 |
| Mode M9 | |||
|---|---|---|---|
| Quadrant | BADHDUFLAG | Total packets | Discarded packets |
| A | 0 | 12 | 0 |
| B | 0 | 12 | 0 |
| C | 0 | 12 | 0 |
| D | 0 | 12 | 0 |
| Mode SS | |||
|---|---|---|---|
| Quadrant | BADHDUFLAG | Total packets | Discarded packets |
| A | 0 | 134 | 0 |
| B | 0 | 134 | 0 |
| C | 0 | 134 | 0 |
| D | 0 | 134 | 0 |
| Quadrant | Total seconds | Saturated seconds | Saturation percentage |
|---|---|---|---|
| A | 6543 | 10 | 0.152835% |
| B | 6543 | 97 | 1.482500% |
| C | 6543 | 11 | 0.168119% |
| D | 6544 | 27 | 0.412592% |
Noise dominated data is calculated using 1-second bins in cleaned event files. If a bin has >2000 counts, and if more than 50% of those come from <1% of pixels, then it is considered to be noise-dominated and hence unusable.
| Quadrant | # 1 sec bins | Bins with >0 counts | Bins with >2000 counts | High rate bins dominated by noise | Noise dominated (total time) | Noise dominated (detector-on time) | Marked lightcurve |
|---|---|---|---|---|---|---|---|
| A | 7748 | 6544 | 0 | 0 | 0.00% | 0.00% | 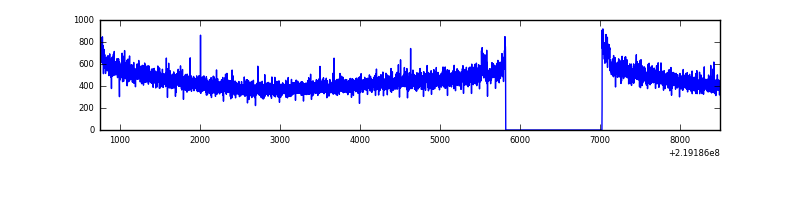 |
| B | 7748 | 6544 | 63 | 63 | 0.81% | 0.96% | 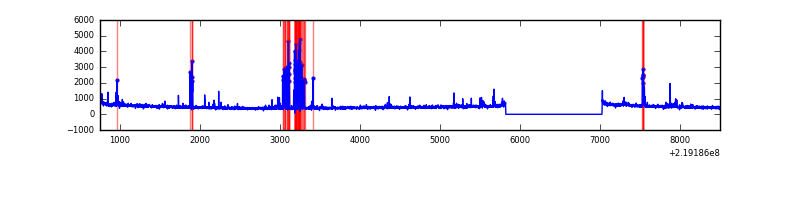 |
| C | 7748 | 6544 | 1 | 1 | 0.01% | 0.02% | 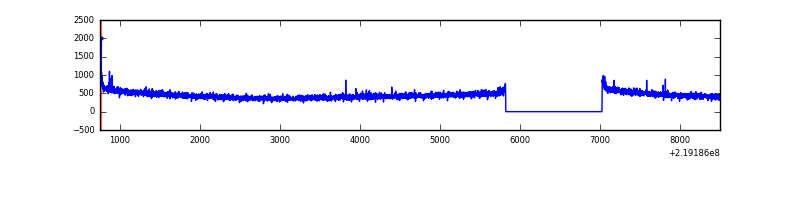 |
| D | 7749 | 6545 | 20 | 20 | 0.26% | 0.31% | 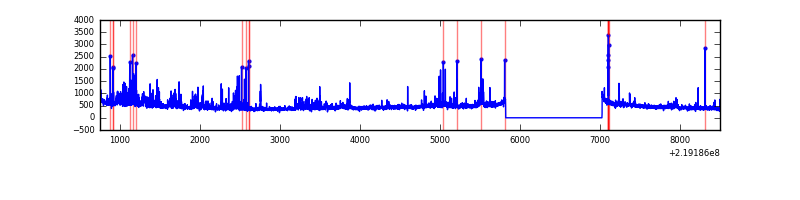 |
Top three noisy pixels from each quadrant. If the there are fewer than three noisy pixels in the level2.evt file, extra rows are filled as -1
| Pixel properties | Quadrant properties | ||||||
|---|---|---|---|---|---|---|---|
| Quadrant | DetID | PixID | Counts | Sigma | Mean | Median | Sigma |
| A | 15 | 236 | 17915 | 111.04 | 758 | 743 | 154.7 |
| A | 0 | 226 | 7189 | 41.68 | 758 | 743 | 154.7 |
| A | 12 | 194 | 6828 | 39.35 | 758 | 743 | 154.7 |
| B | 4 | 48 | 215920 | 1481.73 | 767 | 750 | 145.2 |
| B | 0 | 219 | 48594 | 329.47 | 767 | 750 | 145.2 |
| B | 4 | 170 | 28176 | 188.86 | 767 | 750 | 145.2 |
| C | 9 | 237 | 15790 | 87.78 | 744 | 749 | 171.4 |
| C | 13 | 61 | 5812 | 29.55 | 744 | 749 | 171.4 |
| C | 12 | 4 | 5787 | 29.4 | 744 | 749 | 171.4 |
| D | 2 | 136 | 168355 | 924.99 | 735 | 712 | 181.2 |
| D | 12 | 233 | 127411 | 699.08 | 735 | 712 | 181.2 |
| D | 2 | 63 | 65813 | 359.2 | 735 | 712 | 181.2 |
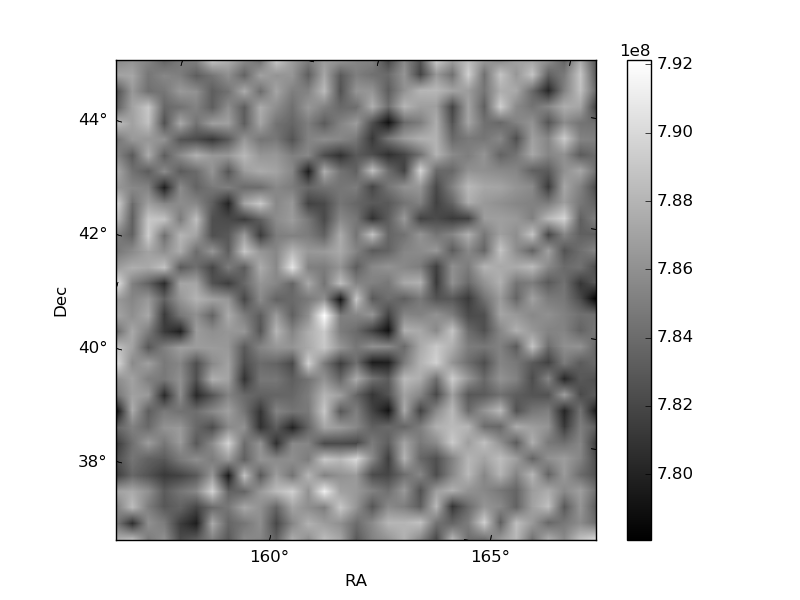
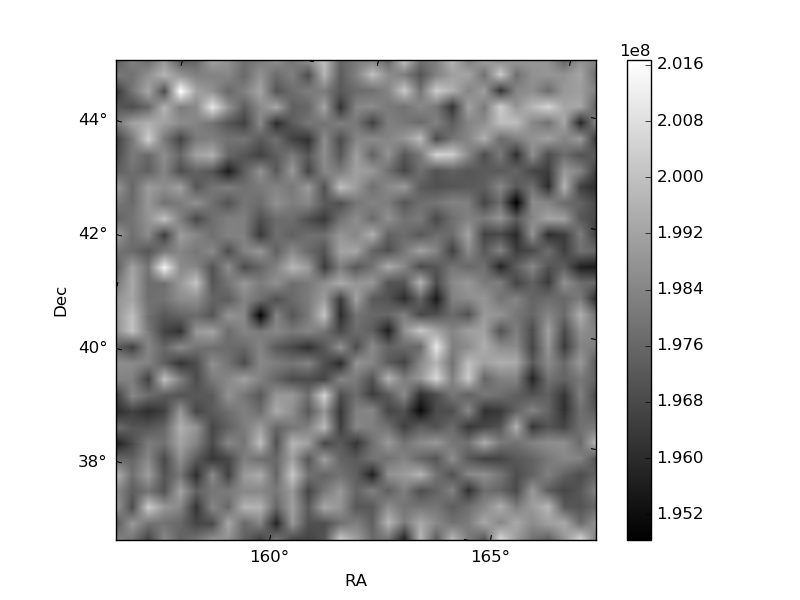
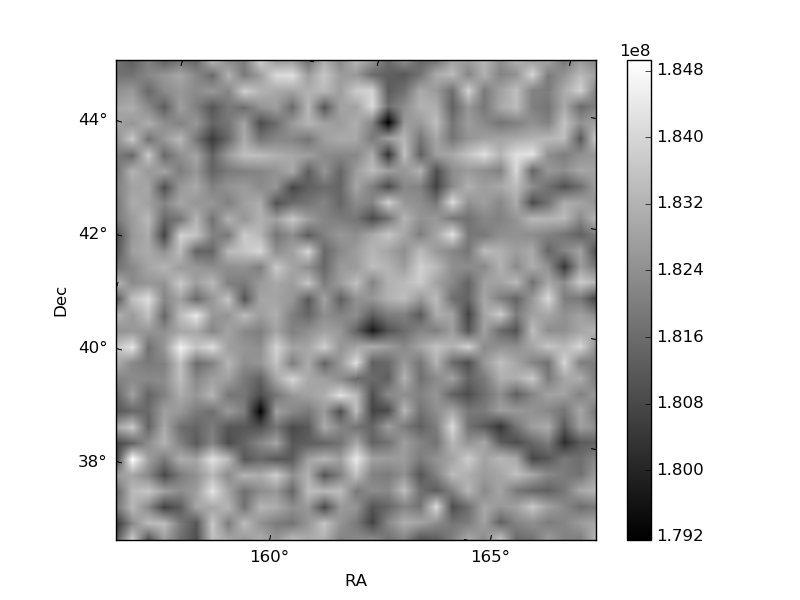
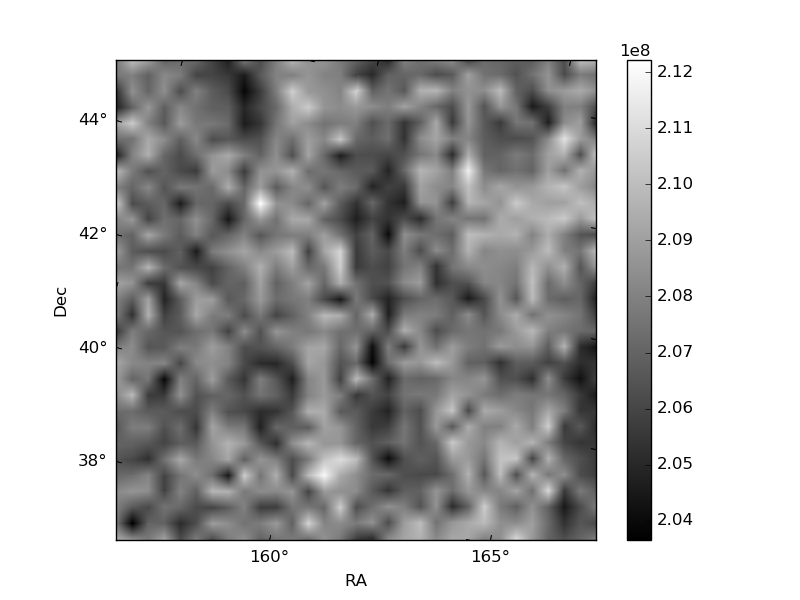
Histogram calculated using DETX and DETY for each event in the final _common_clean file
| Quadrant A | 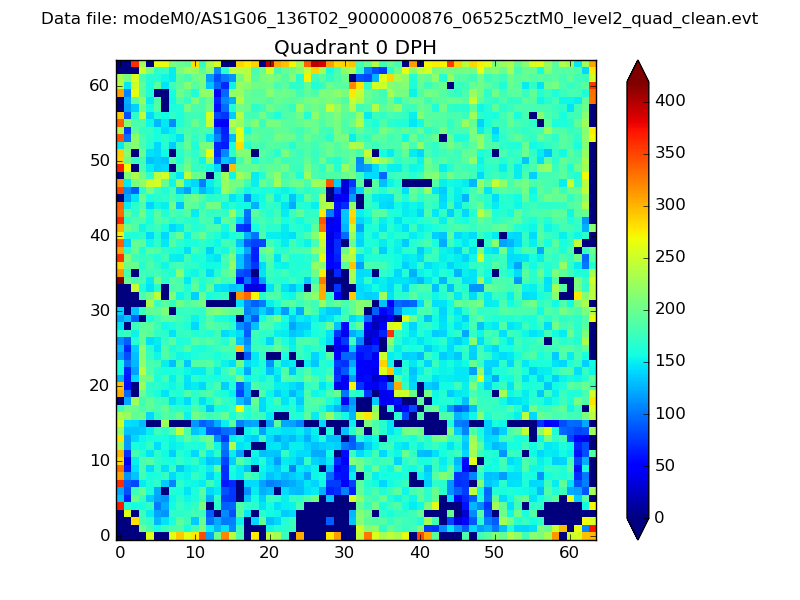 |
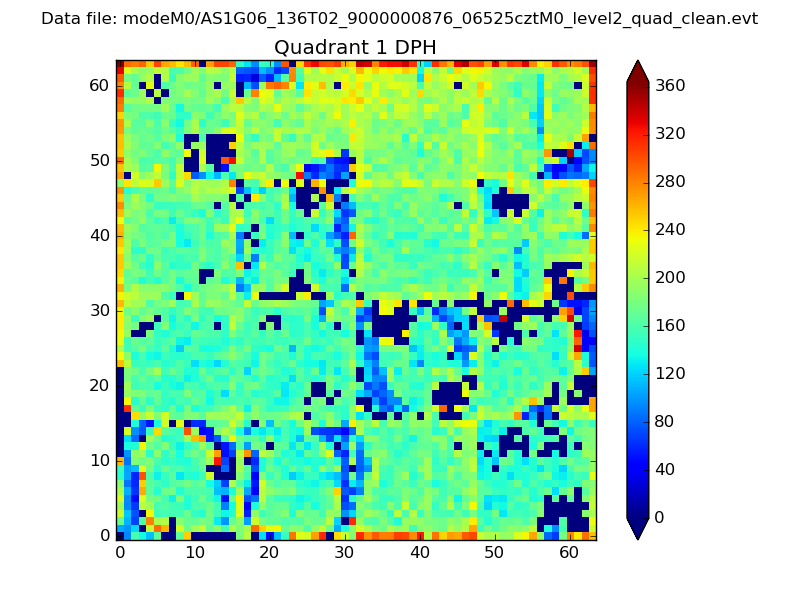 |
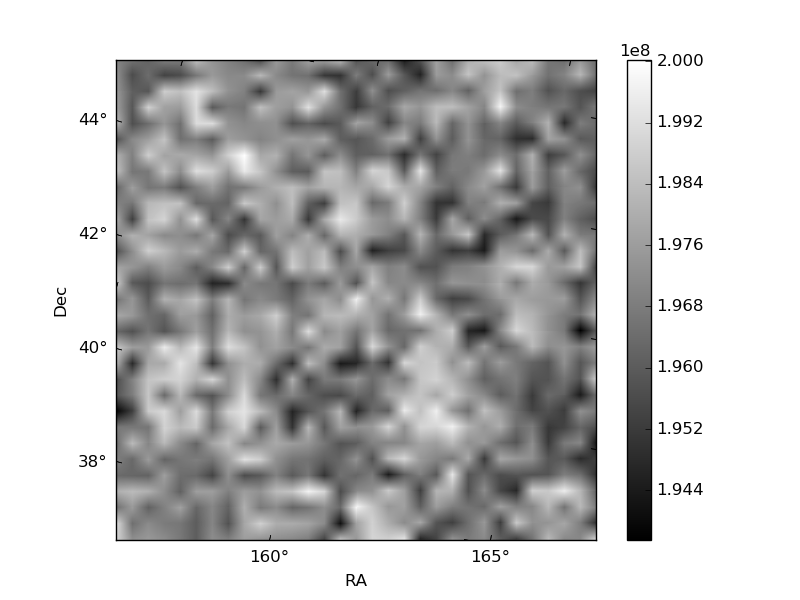
Quadrant B |
|---|---|---|---|
| Quadrant D | 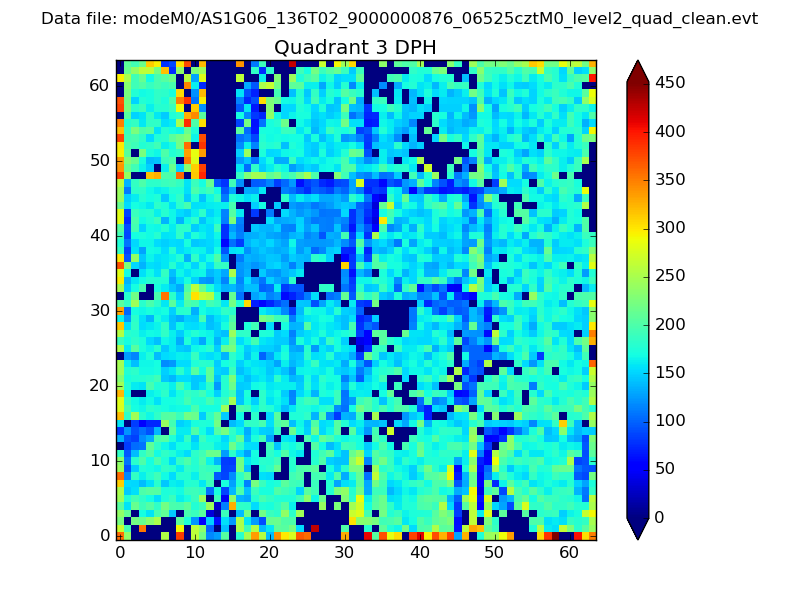 |
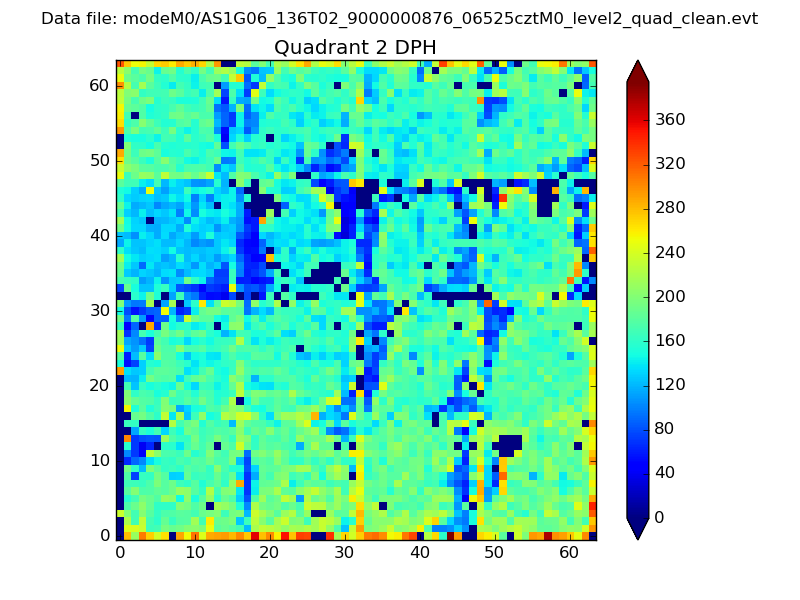 |
Quadrant C |
| Plot type | Count rate plots | Images |
|---|---|---|
| Comparison with Poisson distribution Blue bars denote a histogram of data divided into 1 sec bins. Red curve is a Poisson curve with rate = median count rate of data. |
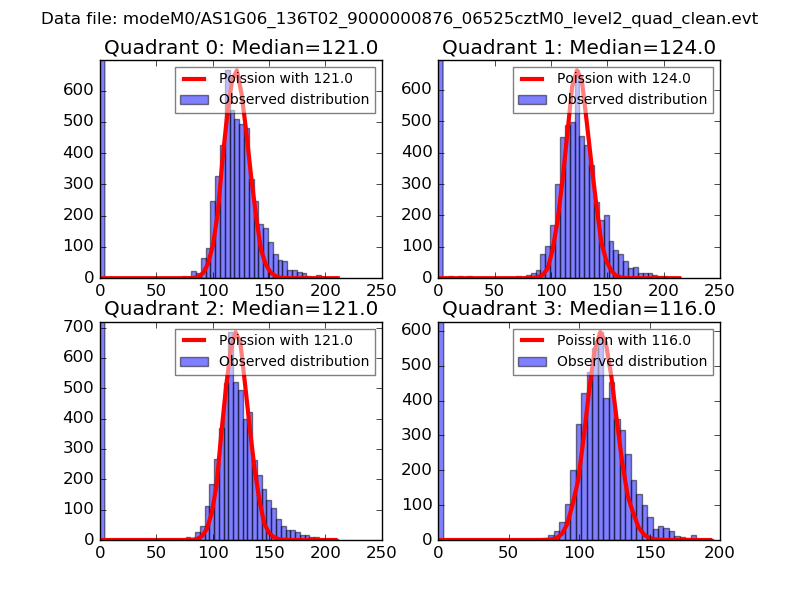 |
 |
| Quadrant-wise count rates Data is divided into 100 sec bins |
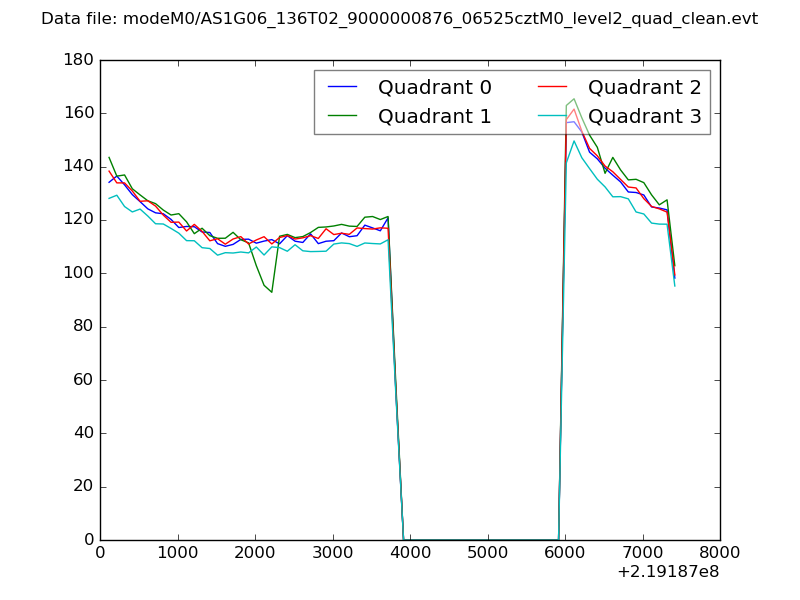 |
|
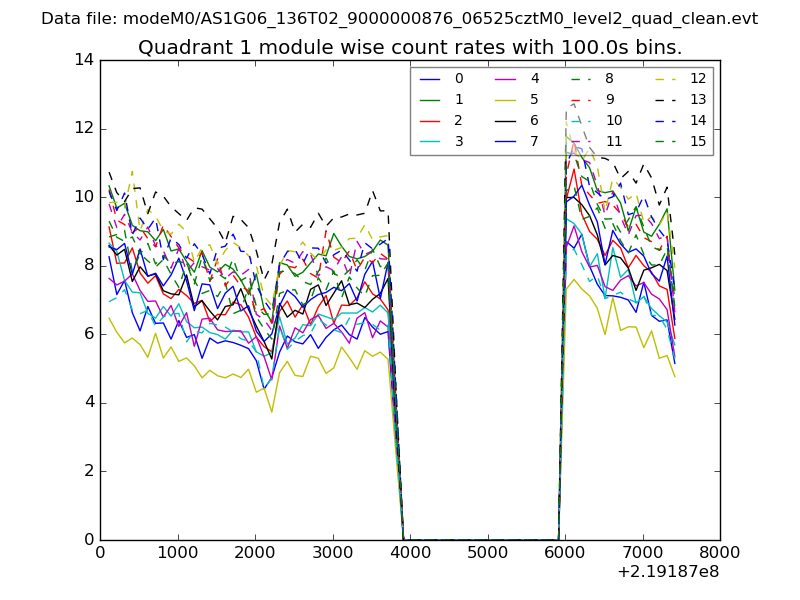
| Module-wise count rates for Quadrant A Data is divided into 100 sec bins |
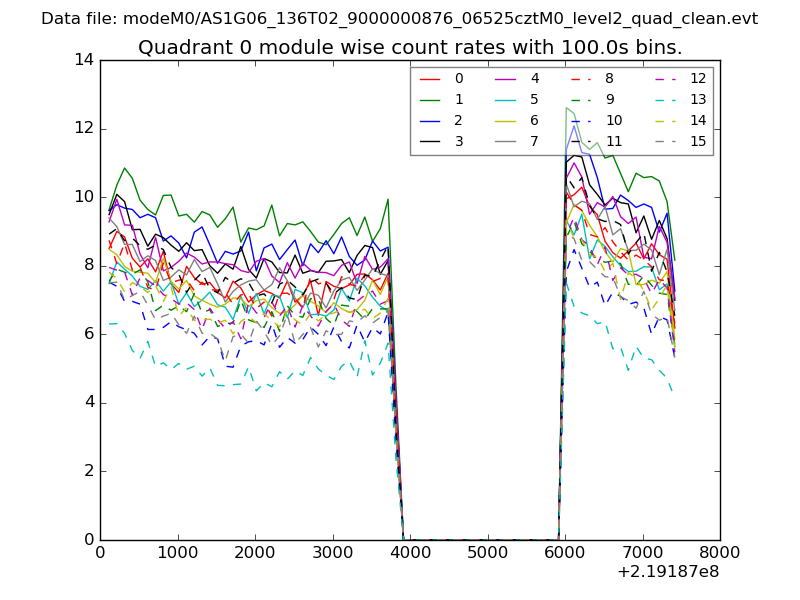 |
 |
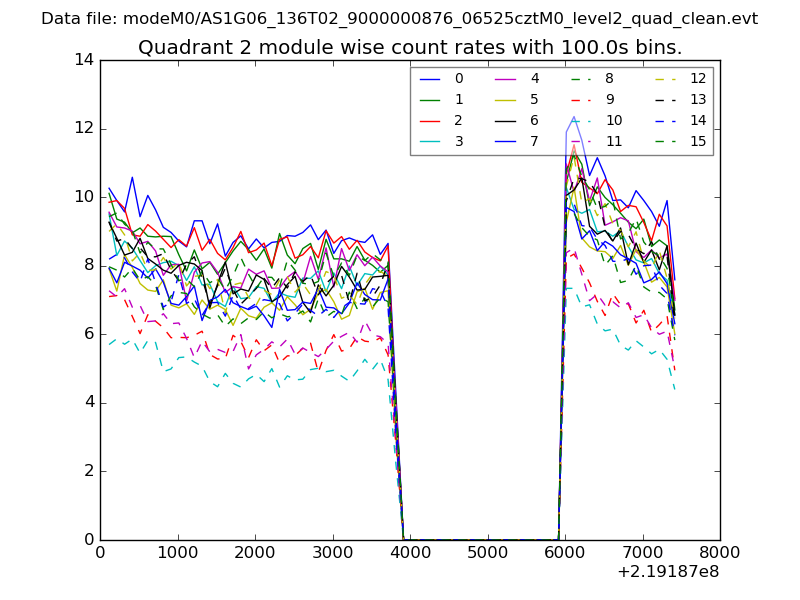
| Module-wise count rates for Quadrant B Data is divided into 100 sec bins |
 |
 |
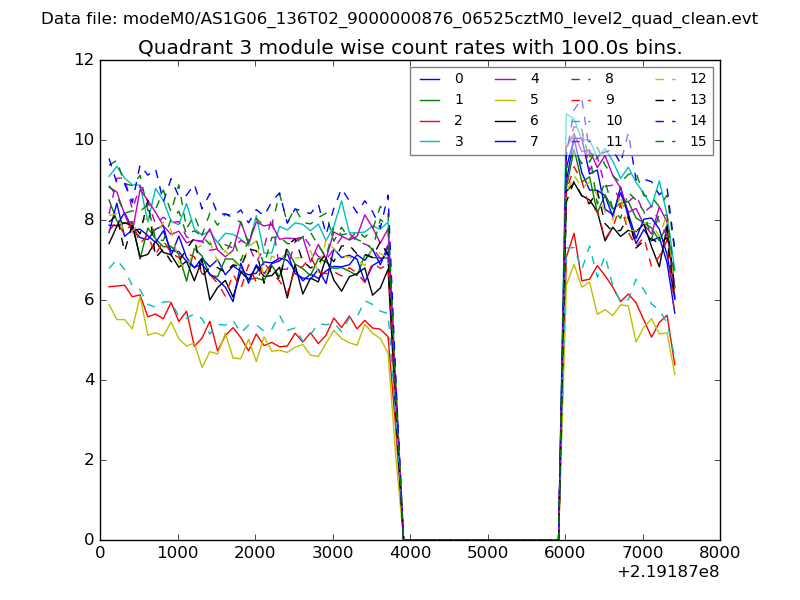
| Module-wise count rates for Quadrant C Data is divided into 100 sec bins |
 |
 |
| Module-wise count rates for Quadrant D Data is divided into 100 sec bins |
 |
 |
| Parameter | Plot |
|---|---|
| CZT HV Monitor | 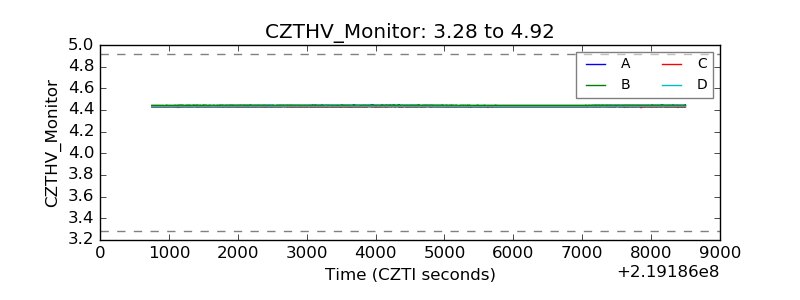 |
| D_VDD | 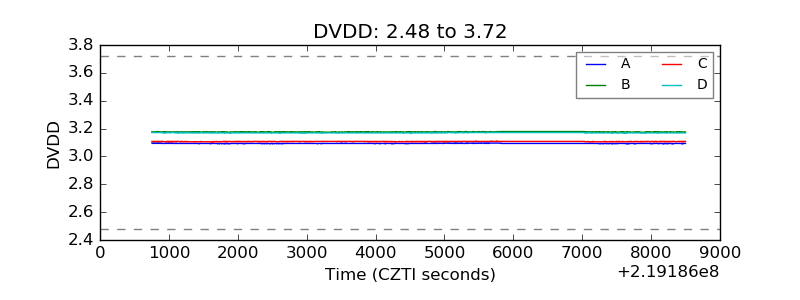 |
| Temperature 1 | 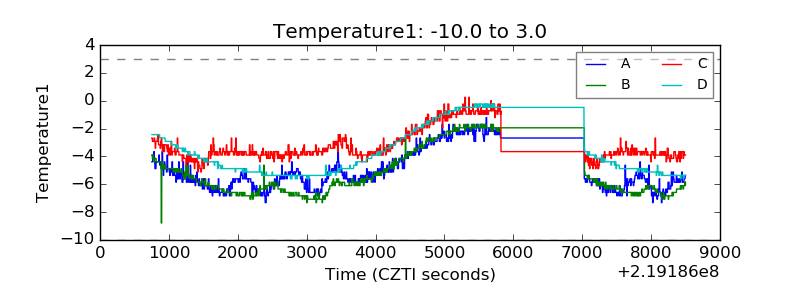 |
| Veto HV Monitor | 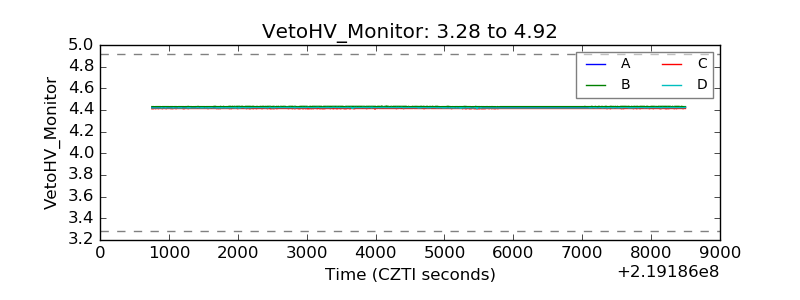 |
| Veto LLD | 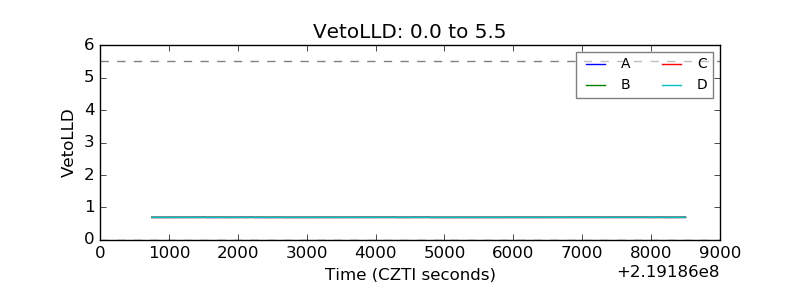 |
| Alpha Counter | 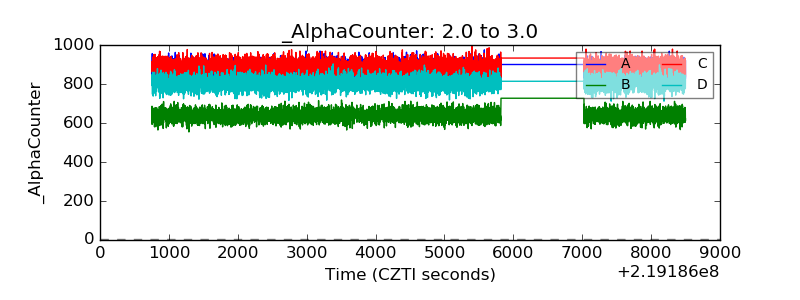 |
| _CPM_Rate | 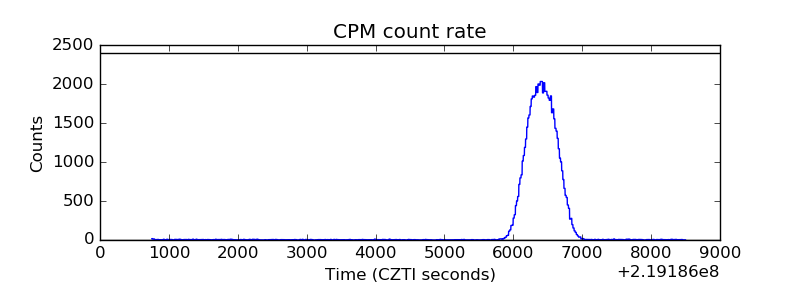 |
| CZT Counter | 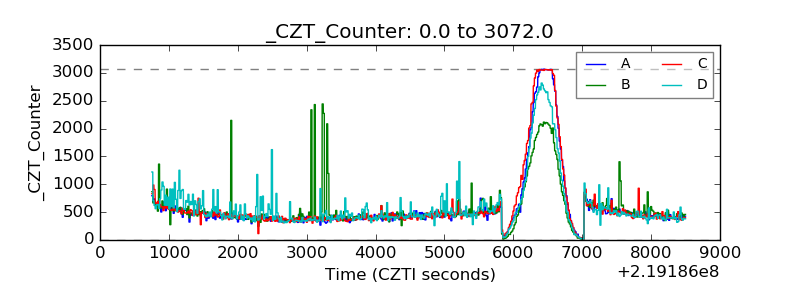 |
| +2.5 Volts monitor |  |
| +5 Volts monitor |  |
| _ROLL_ROT | 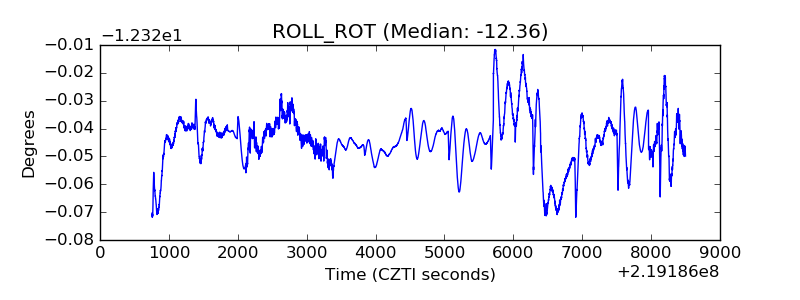 |
| _Roll_DEC | 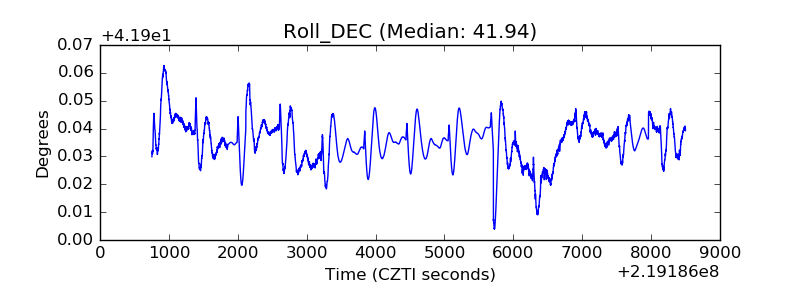 |
| _Roll_RA | 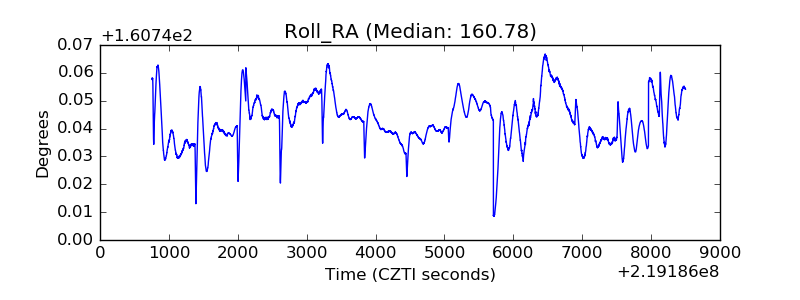 |
| Veto Counter | 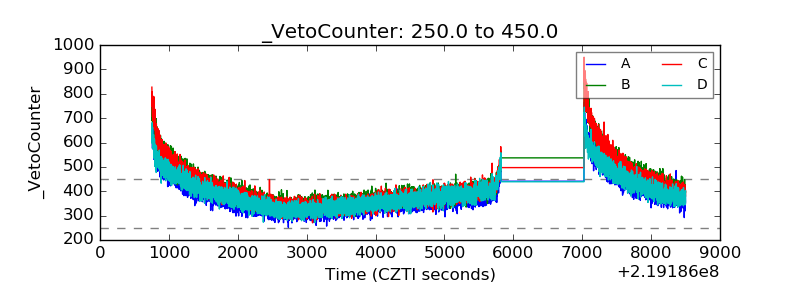 |