| Param | Original file | Final file |
|---|---|---|
| Filename | modeM0/AS1G06_136T02_9000000876_06527cztM0_level2.evt | modeM0/AS1G06_136T02_9000000876_06527cztM0_level2_quad_clean.evt |
| Size (bytes) | 426,634,560 | 100,719,360 |
| Size | 406.9 MB | 96.1 MB |
| Events in quadrant A | 3,200,691 | 652,010 |
| Events in quadrant B | 3,344,539 | 670,343 |
| Events in quadrant C | 2,966,763 | 655,693 |
| Events in quadrant D | 2,964,273 | 616,598 |
| Mode M0 | |||
|---|---|---|---|
| Quadrant | BADHDUFLAG | Total packets | Discarded packets |
| A | 0 | 13977 | 3 |
| B | 0 | 14342 | 2 |
| C | 0 | 13431 | 2 |
| D | 0 | 13573 | 2 |
| Mode M9 | |||
|---|---|---|---|
| Quadrant | BADHDUFLAG | Total packets | Discarded packets |
| A | 0 | 22 | 0 |
| B | 0 | 22 | 0 |
| C | 0 | 22 | 0 |
| D | 0 | 23 | 0 |
| Mode SS | |||
|---|---|---|---|
| Quadrant | BADHDUFLAG | Total packets | Discarded packets |
| A | 0 | 132 | 0 |
| B | 0 | 132 | 0 |
| C | 0 | 132 | 0 |
| D | 0 | 132 | 0 |
| Quadrant | Total seconds | Saturated seconds | Saturation percentage |
|---|---|---|---|
| A | 6535 | 19 | 0.290742% |
| B | 6535 | 83 | 1.270084% |
| C | 6535 | 11 | 0.168324% |
| D | 6535 | 21 | 0.321347% |
Noise dominated data is calculated using 1-second bins in cleaned event files. If a bin has >2000 counts, and if more than 50% of those come from <1% of pixels, then it is considered to be noise-dominated and hence unusable.
| Quadrant | # 1 sec bins | Bins with >0 counts | Bins with >2000 counts | High rate bins dominated by noise | Noise dominated (total time) | Noise dominated (detector-on time) | Marked lightcurve |
|---|---|---|---|---|---|---|---|
| A | 7870 | 6536 | 0 | 0 | 0.00% | 0.00% | 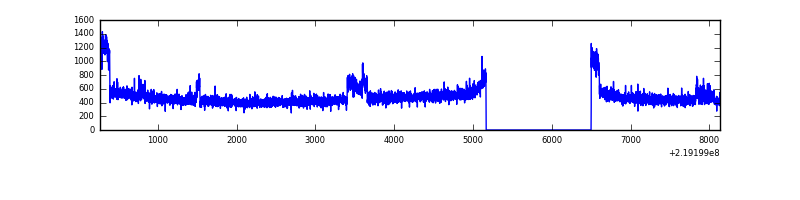 |
| B | 7870 | 6536 | 32 | 32 | 0.41% | 0.49% | 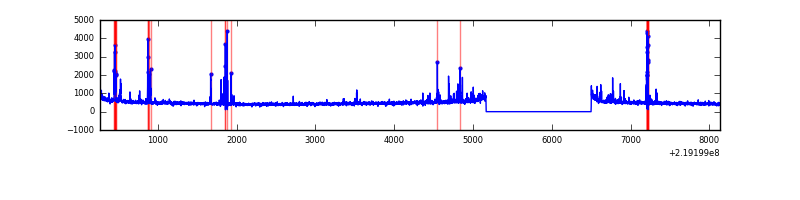 |
| C | 7870 | 6536 | 0 | 0 | 0.00% | 0.00% | 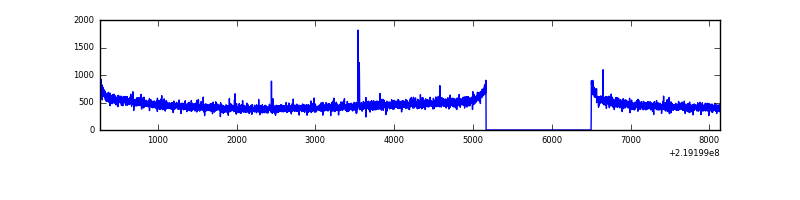 |
| D | 7870 | 6536 | 12 | 12 | 0.15% | 0.18% | 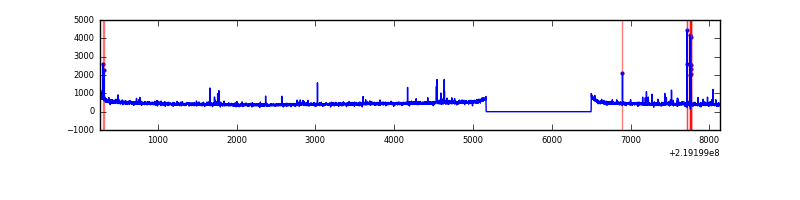 |
Top three noisy pixels from each quadrant. If the there are fewer than three noisy pixels in the level2.evt file, extra rows are filled as -1
| Pixel properties | Quadrant properties | ||||||
|---|---|---|---|---|---|---|---|
| Quadrant | DetID | PixID | Counts | Sigma | Mean | Median | Sigma |
| A | 15 | 236 | 192538 | 1218.74 | 778 | 764 | 157.4 |
| A | 8 | 15 | 11320 | 67.08 | 778 | 764 | 157.4 |
| A | 0 | 226 | 7402 | 42.18 | 778 | 764 | 157.4 |
| B | 4 | 48 | 140125 | 939.84 | 789 | 774 | 148.3 |
| B | 4 | 80 | 50597 | 336.03 | 789 | 774 | 148.3 |
| B | 4 | 81 | 47857 | 317.55 | 789 | 774 | 148.3 |
| C | 12 | 4 | 11194 | 59.92 | 757 | 761 | 174.1 |
| C | 13 | 61 | 5949 | 29.79 | 757 | 761 | 174.1 |
| C | 14 | 67 | 3948 | 18.3 | 757 | 761 | 174.1 |
| D | 6 | 112 | 36791 | 196.94 | 744 | 721 | 183.2 |
| D | 2 | 152 | 21565 | 113.81 | 744 | 721 | 183.2 |
| D | 2 | 234 | 18744 | 98.4 | 744 | 721 | 183.2 |
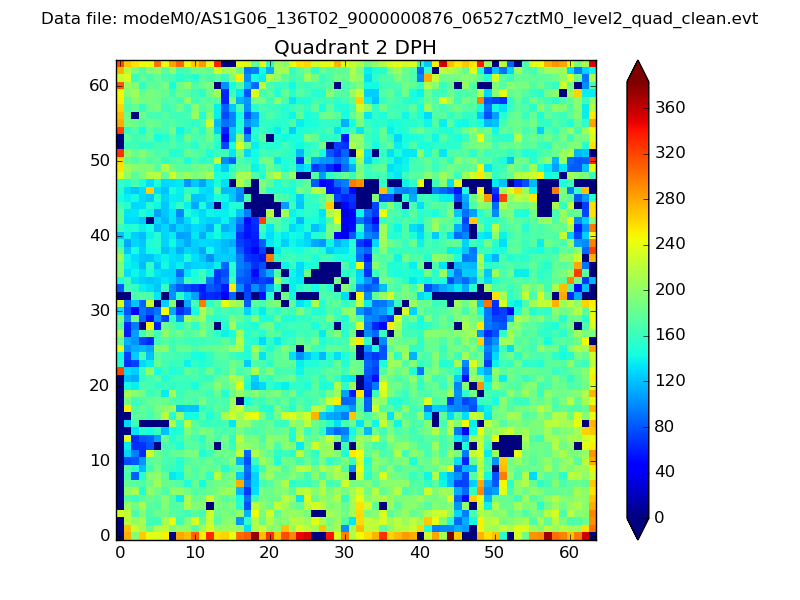
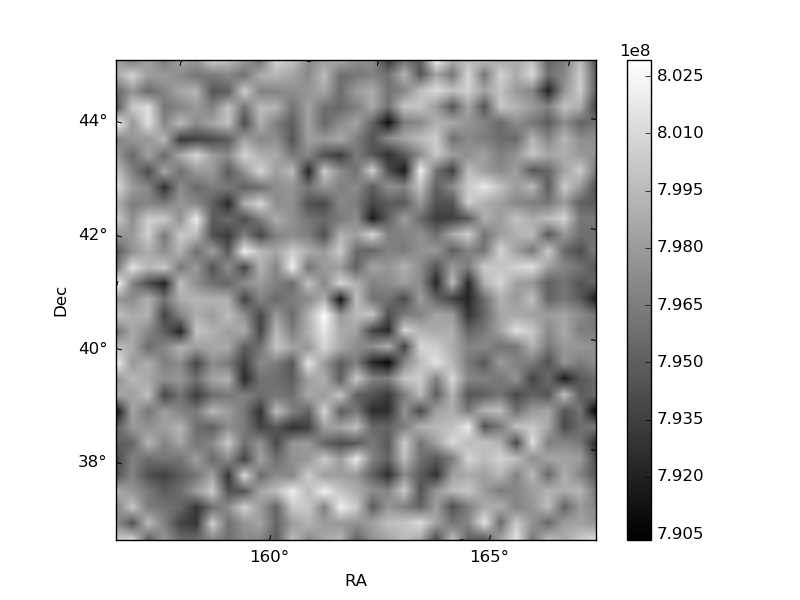
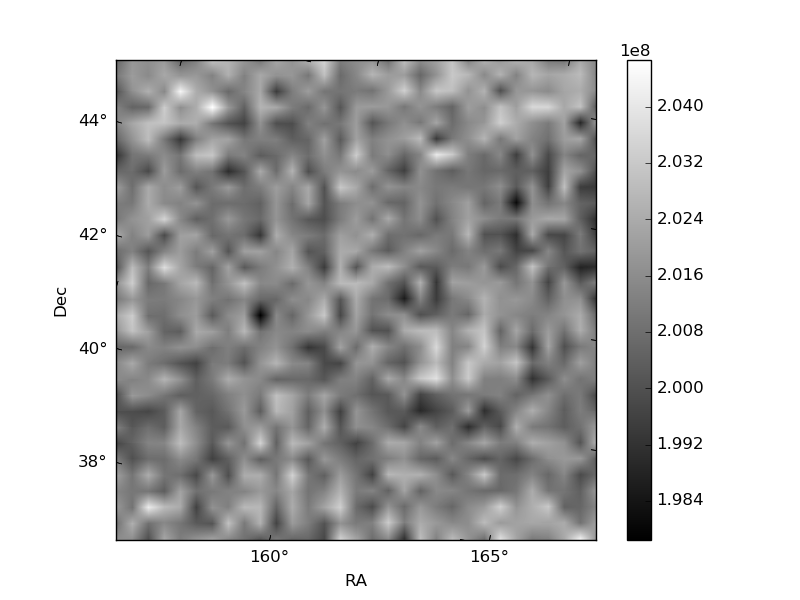
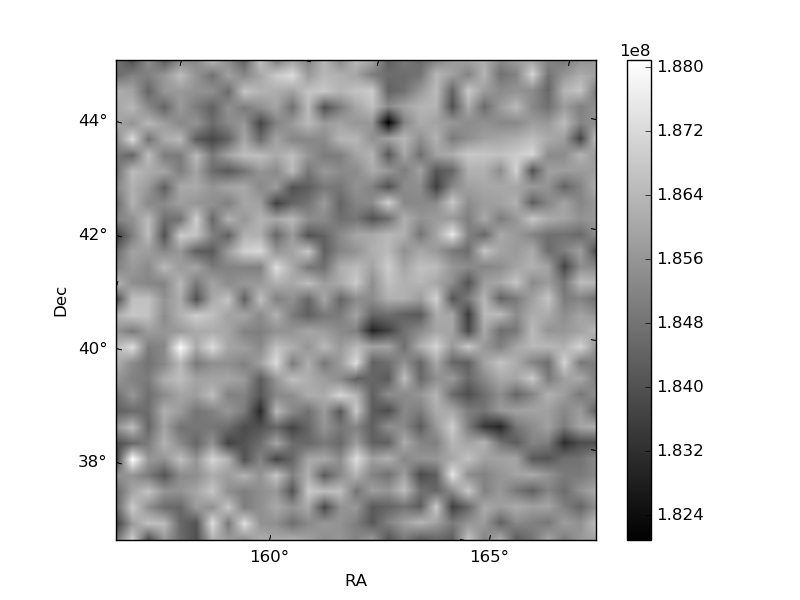
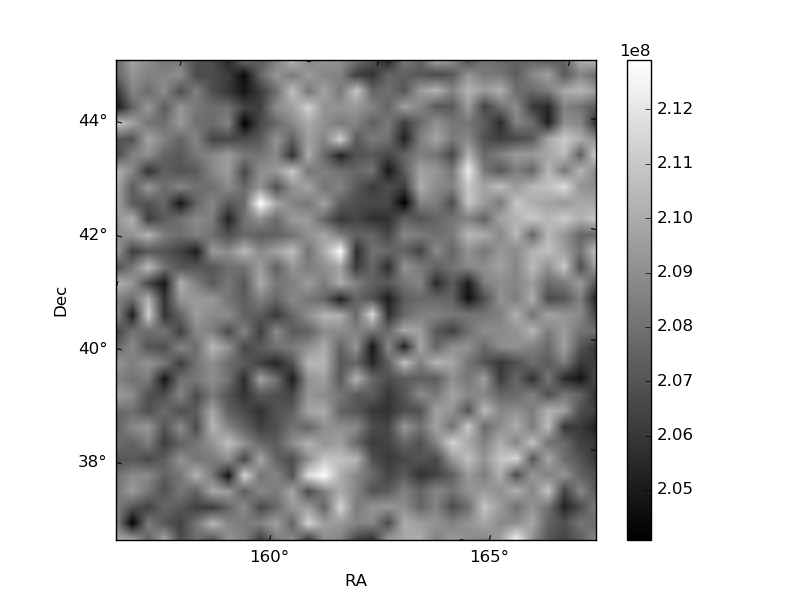
Histogram calculated using DETX and DETY for each event in the final _common_clean file
| Quadrant A | 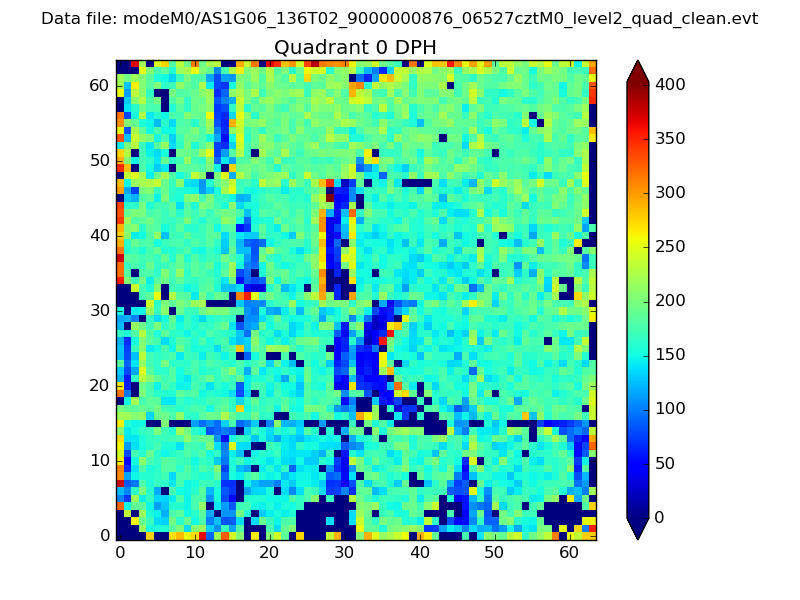 |
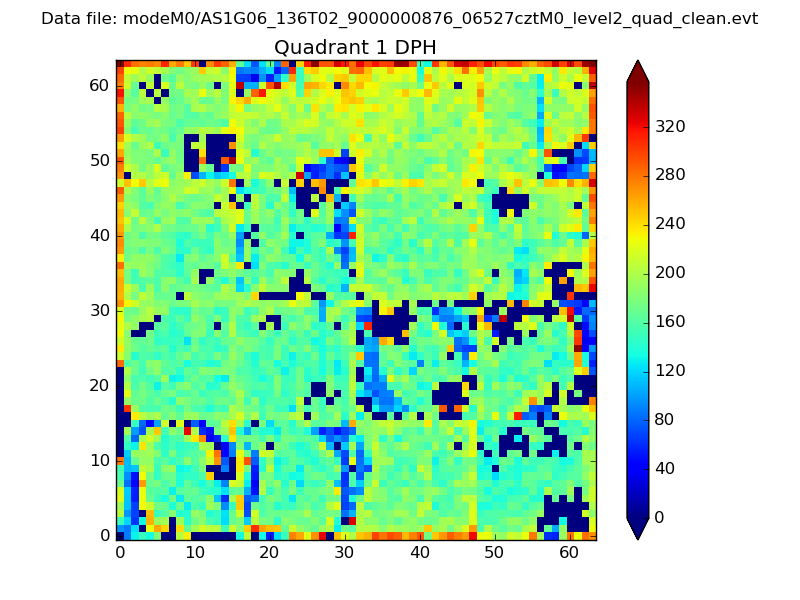 |
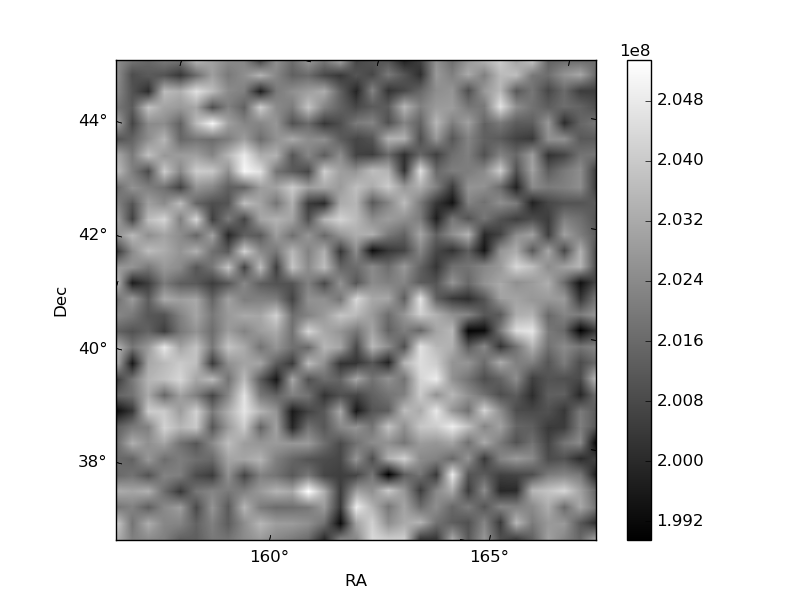
Quadrant B |
|---|---|---|---|
| Quadrant D | 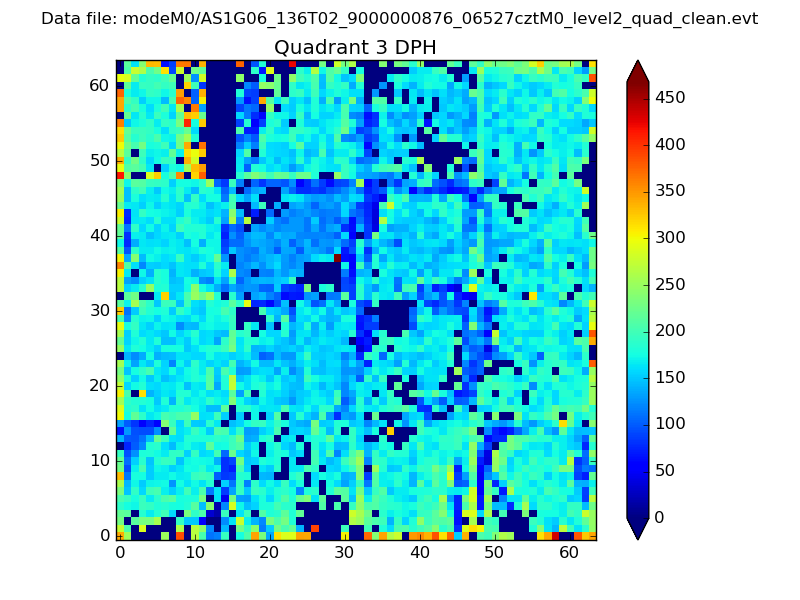 |
 |
Quadrant C |
| Plot type | Count rate plots | Images |
|---|---|---|
| Comparison with Poisson distribution Blue bars denote a histogram of data divided into 1 sec bins. Red curve is a Poisson curve with rate = median count rate of data. |
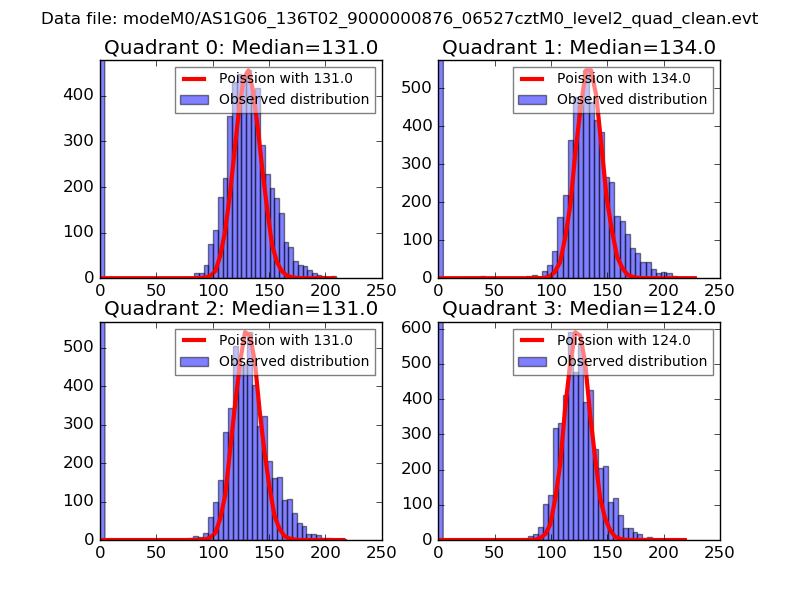 |
 |
| Quadrant-wise count rates Data is divided into 100 sec bins |
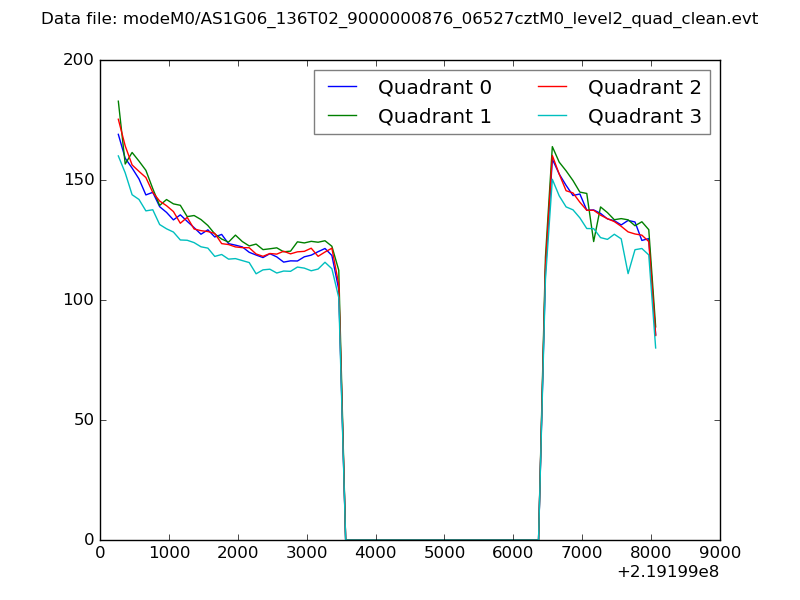 |
|
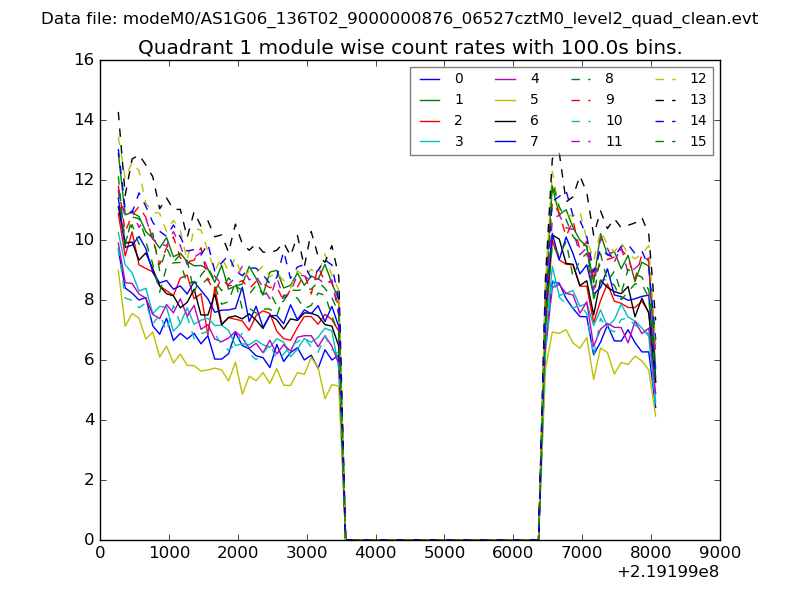
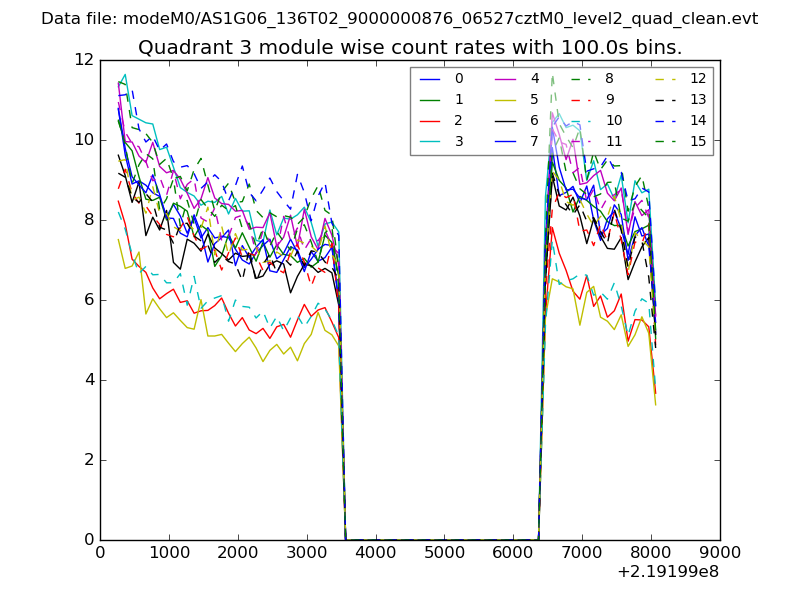
| Module-wise count rates for Quadrant A Data is divided into 100 sec bins |
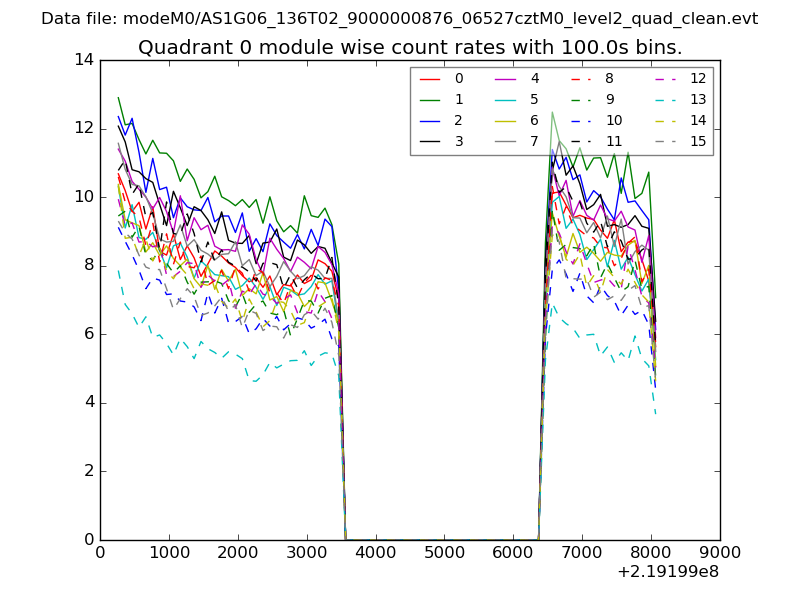 |
 |
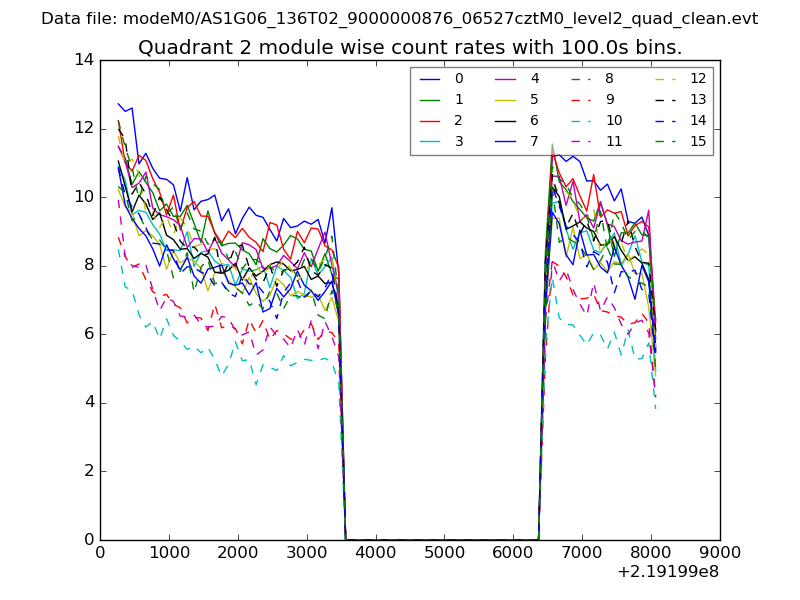
| Module-wise count rates for Quadrant B Data is divided into 100 sec bins |
 |
 |
| Module-wise count rates for Quadrant C Data is divided into 100 sec bins |
 |
 |
| Module-wise count rates for Quadrant D Data is divided into 100 sec bins |
 |
 |
| Parameter | Plot |
|---|---|
| CZT HV Monitor | 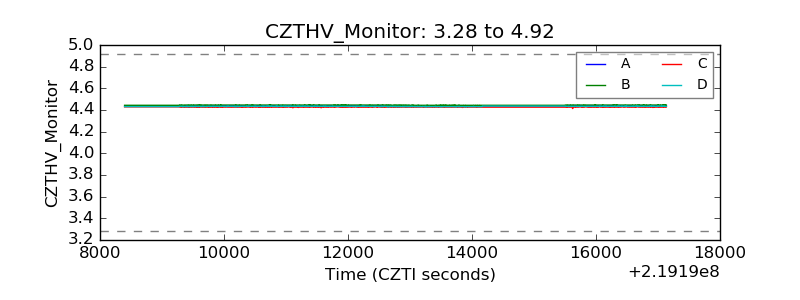 |
| D_VDD | 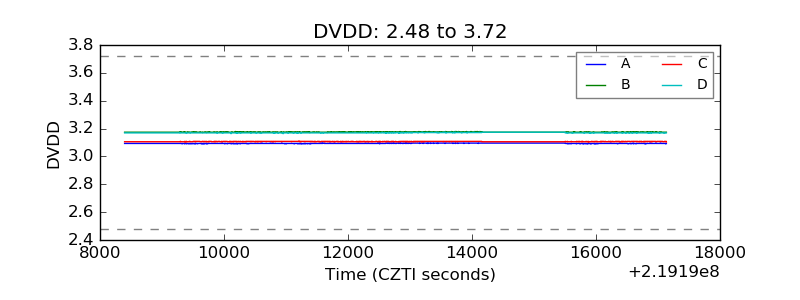 |
| Temperature 1 | 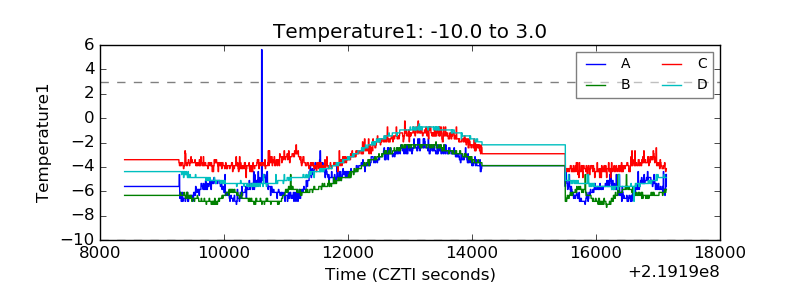 |
| Veto HV Monitor | 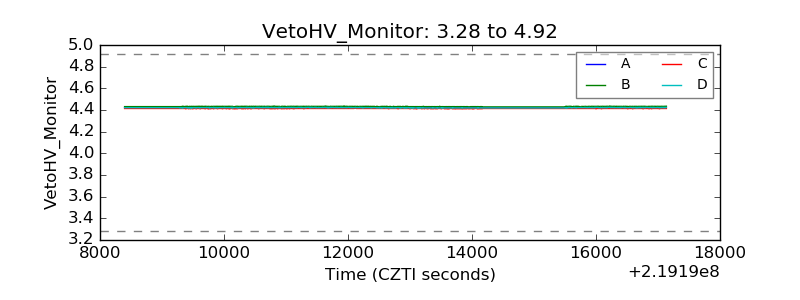 |
| Veto LLD | 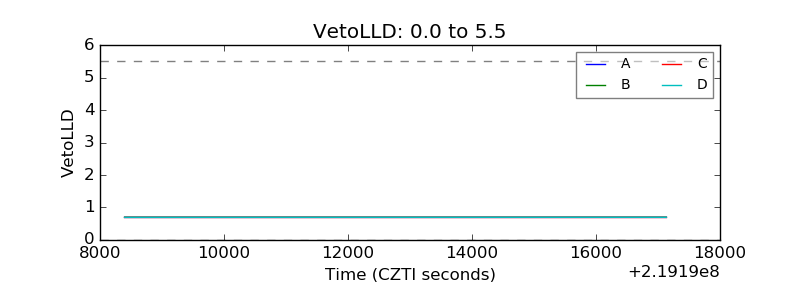 |
| Alpha Counter | 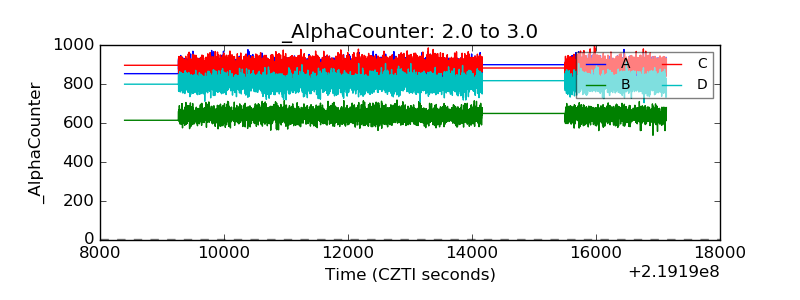 |
| _CPM_Rate | 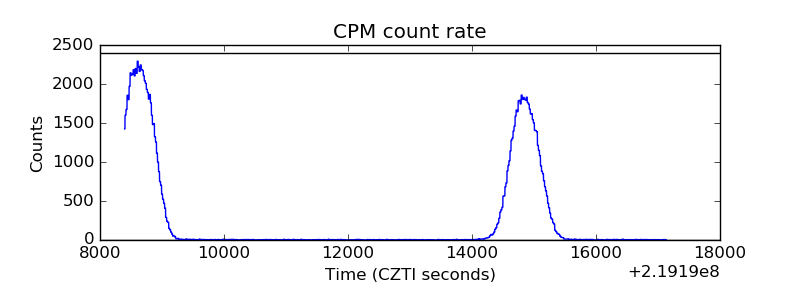 |
| CZT Counter | 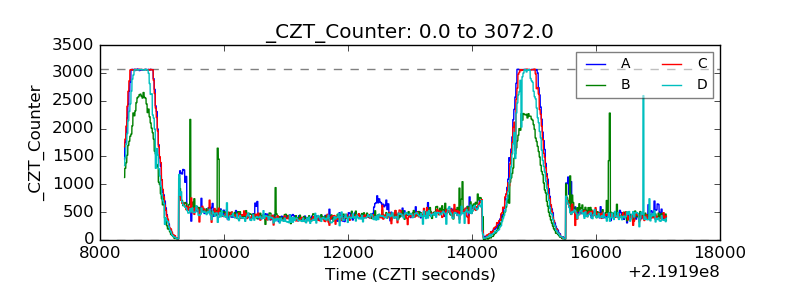 |
| +2.5 Volts monitor |  |
| +5 Volts monitor |  |
| _ROLL_ROT | 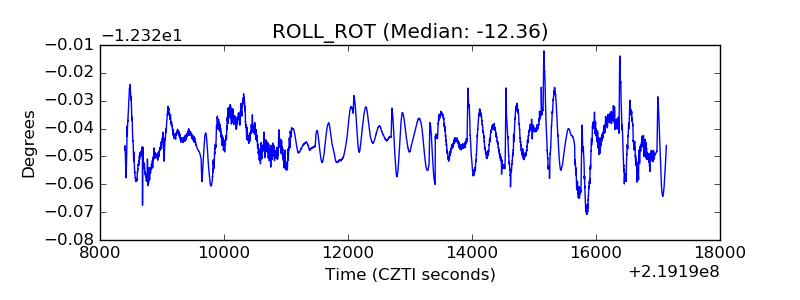 |
| _Roll_DEC | 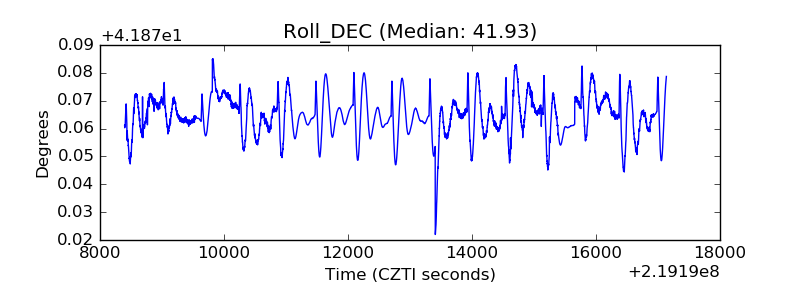 |
| _Roll_RA | 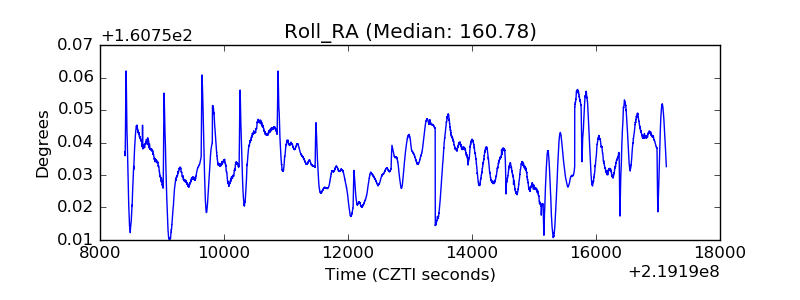 |
| Veto Counter | 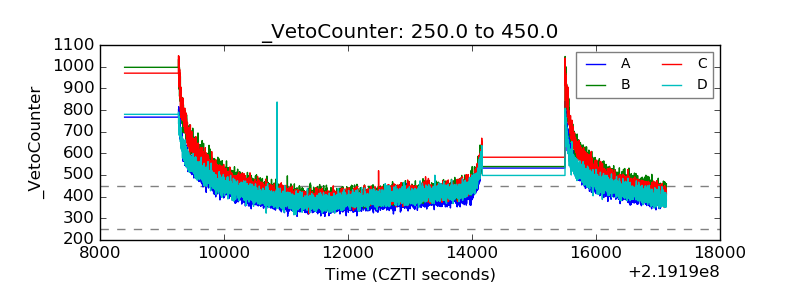 |