| Param | Original file | Final file |
|---|---|---|
| Filename | modeM0/AS1G06_136T02_9000000876_06528cztM0_level2.evt | modeM0/AS1G06_136T02_9000000876_06528cztM0_level2_quad_clean.evt |
| Size (bytes) | 1,304,127,360 | 284,690,880 |
| Size | 1.2 GB | 271.5 MB |
| Events in quadrant A | 9,394,216 | 1,815,223 |
| Events in quadrant B | 10,172,216 | 1,856,856 |
| Events in quadrant C | 8,995,729 | 1,823,344 |
| Events in quadrant D | 9,556,251 | 1,726,212 |
| Mode M0 | |||
|---|---|---|---|
| Quadrant | BADHDUFLAG | Total packets | Discarded packets |
| A | 0 | 42276 | 5 |
| B | 0 | 44320 | 4 |
| C | 0 | 41650 | 4 |
| D | 0 | 43386 | 4 |
| Mode M9 | |||
|---|---|---|---|
| Quadrant | BADHDUFLAG | Total packets | Discarded packets |
| A | 0 | 52 | 0 |
| B | 0 | 52 | 0 |
| C | 0 | 52 | 0 |
| D | 0 | 52 | 0 |
| Mode SS | |||
|---|---|---|---|
| Quadrant | BADHDUFLAG | Total packets | Discarded packets |
| A | 0 | 412 | 0 |
| B | 0 | 412 | 0 |
| C | 0 | 412 | 0 |
| D | 0 | 412 | 0 |
| Quadrant | Total seconds | Saturated seconds | Saturation percentage |
|---|---|---|---|
| A | 20364 | 64 | 0.314280% |
| B | 20364 | 278 | 1.365154% |
| C | 20364 | 50 | 0.245531% |
| D | 20364 | 160 | 0.785700% |
Noise dominated data is calculated using 1-second bins in cleaned event files. If a bin has >2000 counts, and if more than 50% of those come from <1% of pixels, then it is considered to be noise-dominated and hence unusable.
| Quadrant | # 1 sec bins | Bins with >0 counts | Bins with >2000 counts | High rate bins dominated by noise | Noise dominated (total time) | Noise dominated (detector-on time) | Marked lightcurve |
|---|---|---|---|---|---|---|---|
| A | 25464 | 20368 | 0 | 0 | 0.00% | 0.00% | 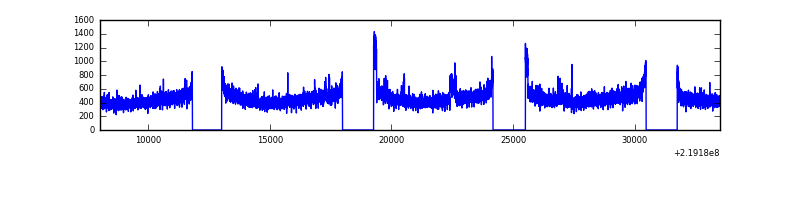 |
| B | 25464 | 20368 | 109 | 109 | 0.43% | 0.54% | 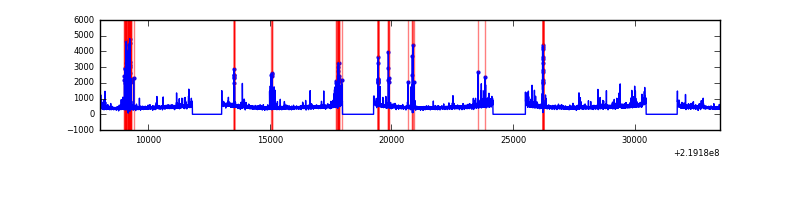 |
| C | 25464 | 20368 | 0 | 0 | 0.00% | 0.00% | 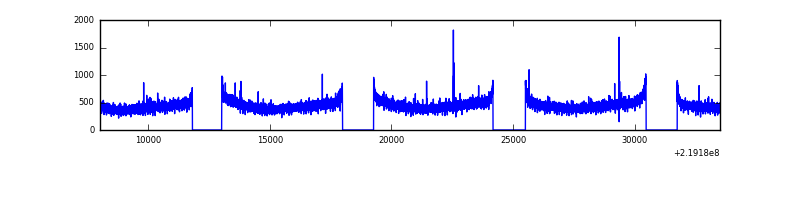 |
| D | 25464 | 20368 | 66 | 66 | 0.26% | 0.32% | 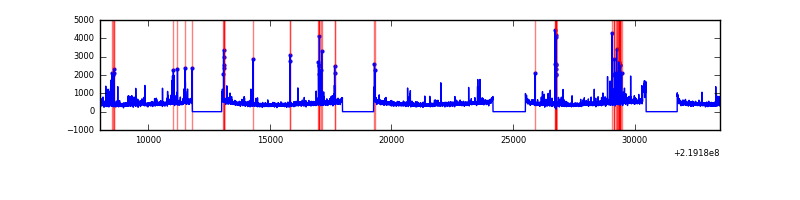 |
Top three noisy pixels from each quadrant. If the there are fewer than three noisy pixels in the level2.evt file, extra rows are filled as -1
| Pixel properties | Quadrant properties | ||||||
|---|---|---|---|---|---|---|---|
| Quadrant | DetID | PixID | Counts | Sigma | Mean | Median | Sigma |
| A | 15 | 236 | 226934 | 468.92 | 2372 | 2327 | 479.0 |
| A | 0 | 226 | 22764 | 42.67 | 2372 | 2327 | 479.0 |
| A | 12 | 194 | 21418 | 39.86 | 2372 | 2327 | 479.0 |
| B | 4 | 48 | 389306 | 867.17 | 2390 | 2338 | 446.2 |
| B | 4 | 81 | 123144 | 270.72 | 2390 | 2338 | 446.2 |
| B | 4 | 170 | 120589 | 264.99 | 2390 | 2338 | 446.2 |
| C | 12 | 4 | 18914 | 31.49 | 2299 | 2312 | 527.2 |
| C | 13 | 61 | 18214 | 30.17 | 2299 | 2312 | 527.2 |
| C | 9 | 237 | 8206 | 11.18 | 2299 | 2312 | 527.2 |
| D | 2 | 33 | 156731 | 279.06 | 2278 | 2213 | 553.7 |
| D | 2 | 152 | 151464 | 269.54 | 2278 | 2213 | 553.7 |
| D | 12 | 233 | 130986 | 232.56 | 2278 | 2213 | 553.7 |
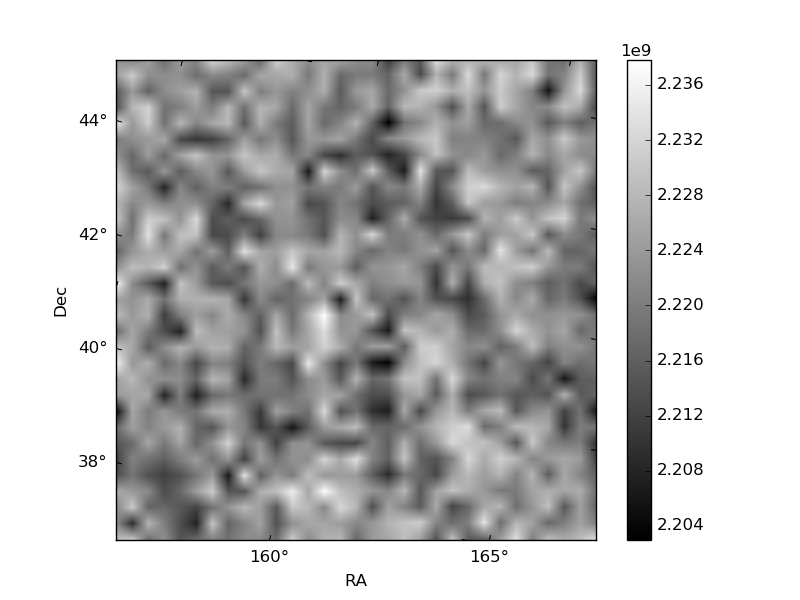
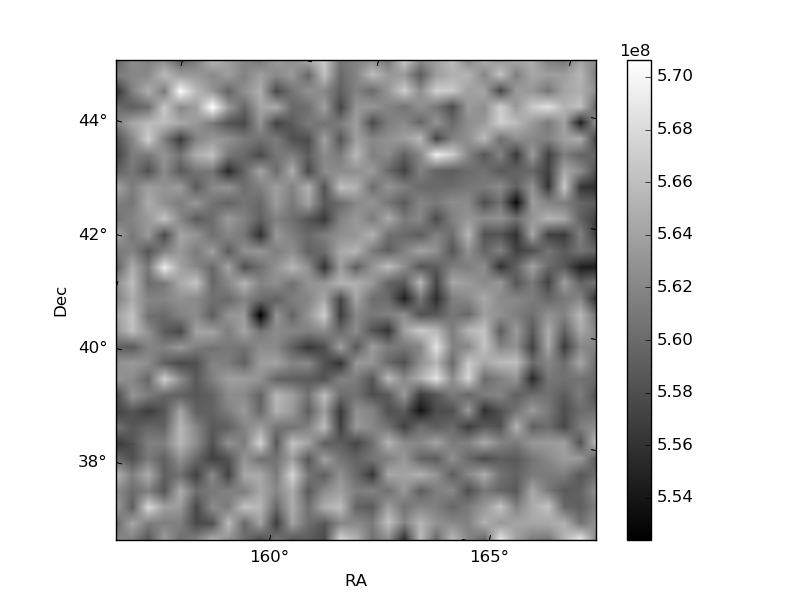
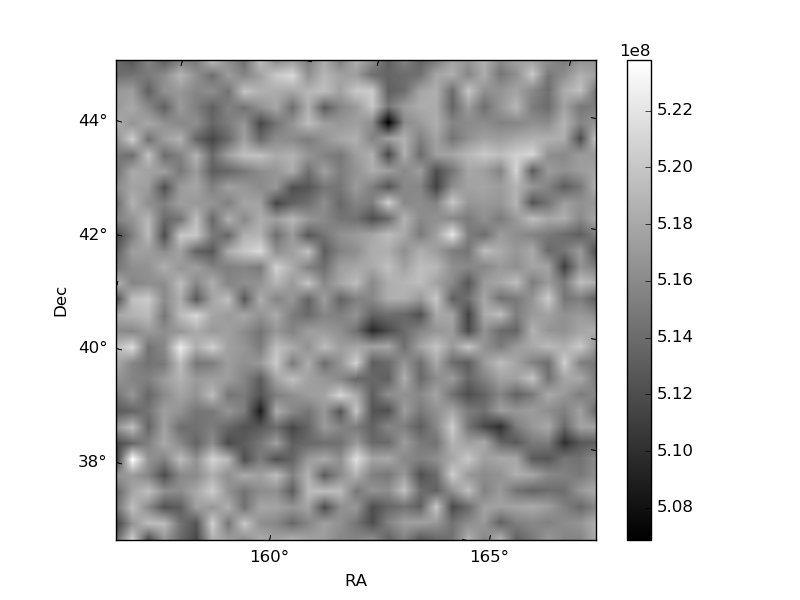
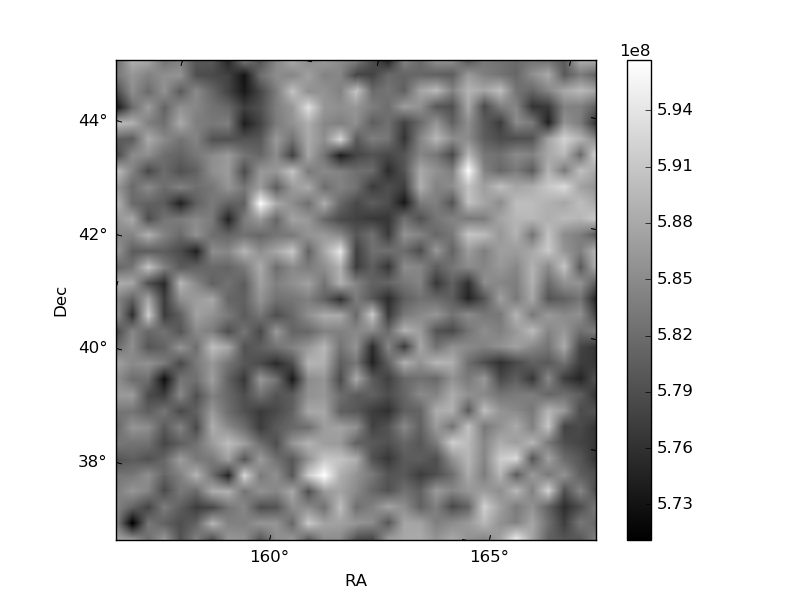
Histogram calculated using DETX and DETY for each event in the final _common_clean file
| Quadrant A | 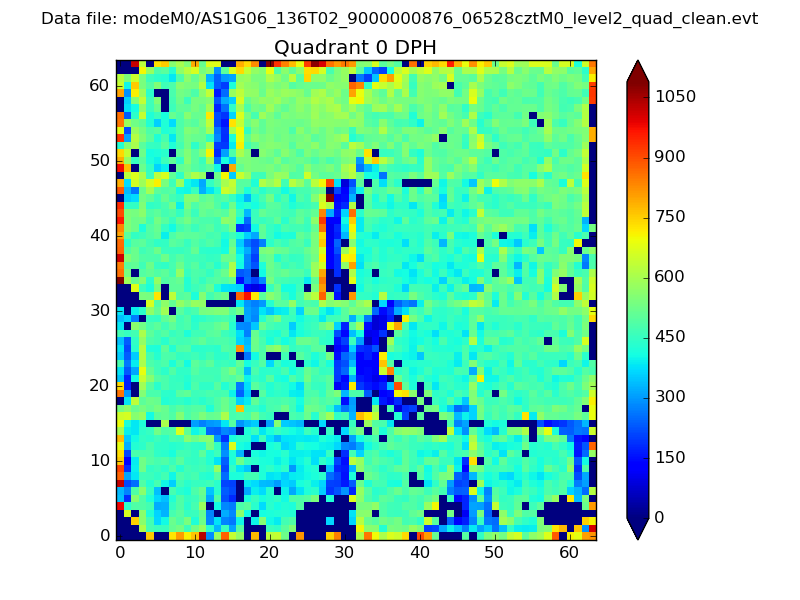 |
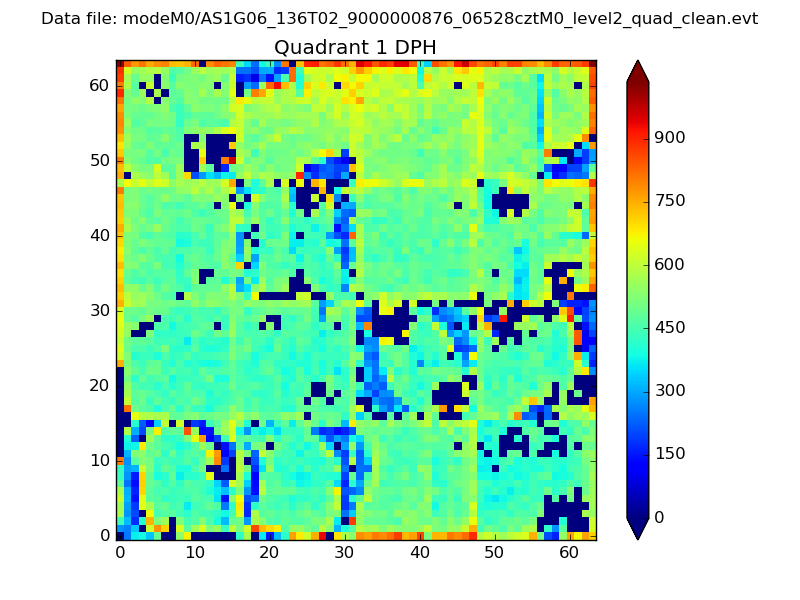 |
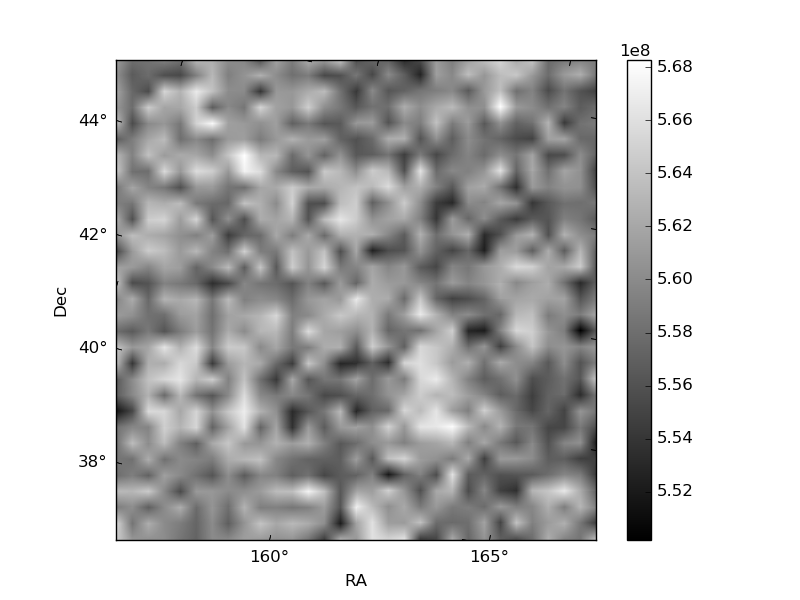
Quadrant B |
|---|---|---|---|
| Quadrant D | 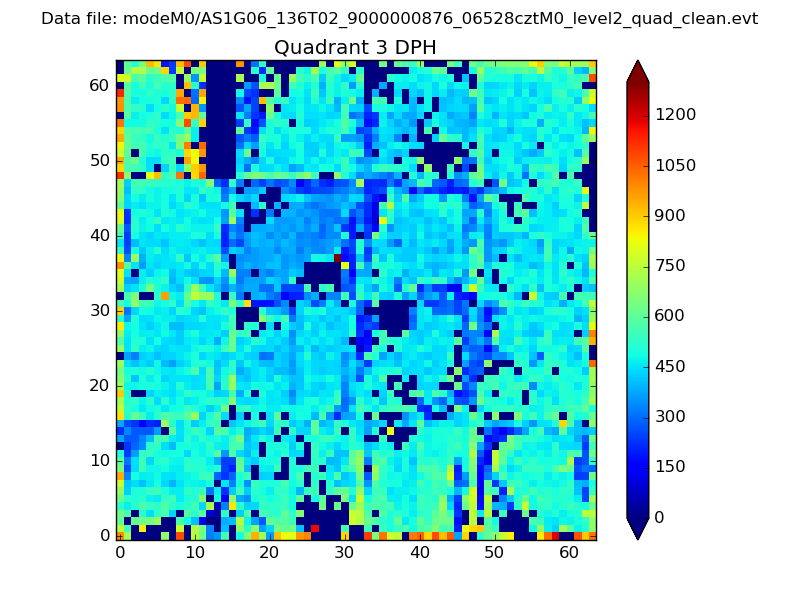 |
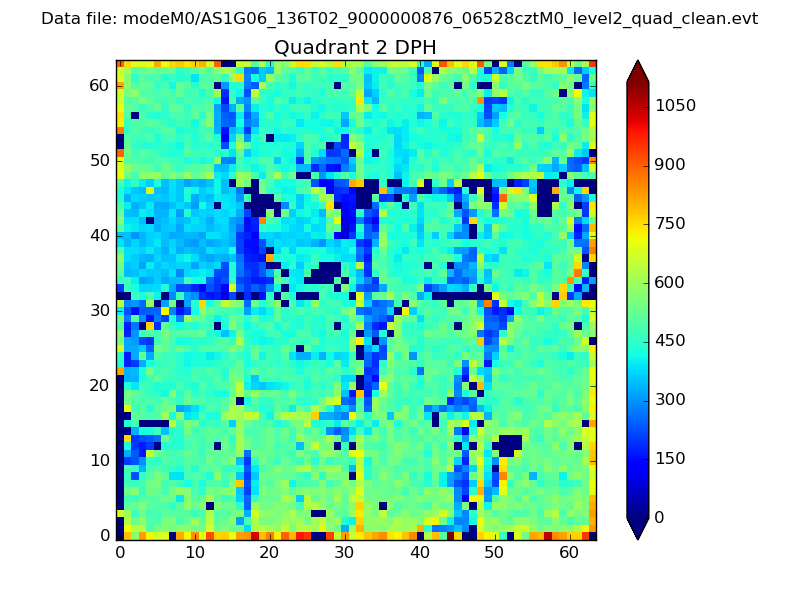 |
Quadrant C |
| Plot type | Count rate plots | Images |
|---|---|---|
| Comparison with Poisson distribution Blue bars denote a histogram of data divided into 1 sec bins. Red curve is a Poisson curve with rate = median count rate of data. |
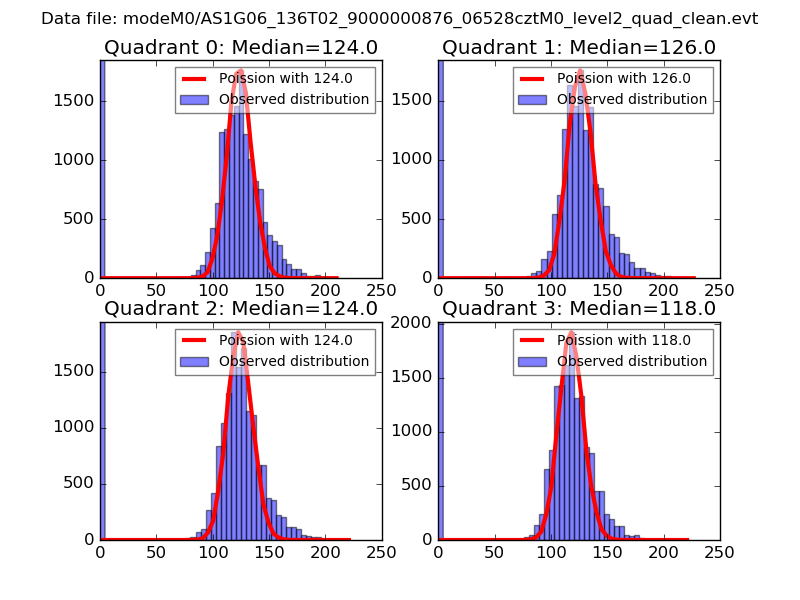 |
 |
| Quadrant-wise count rates Data is divided into 100 sec bins |
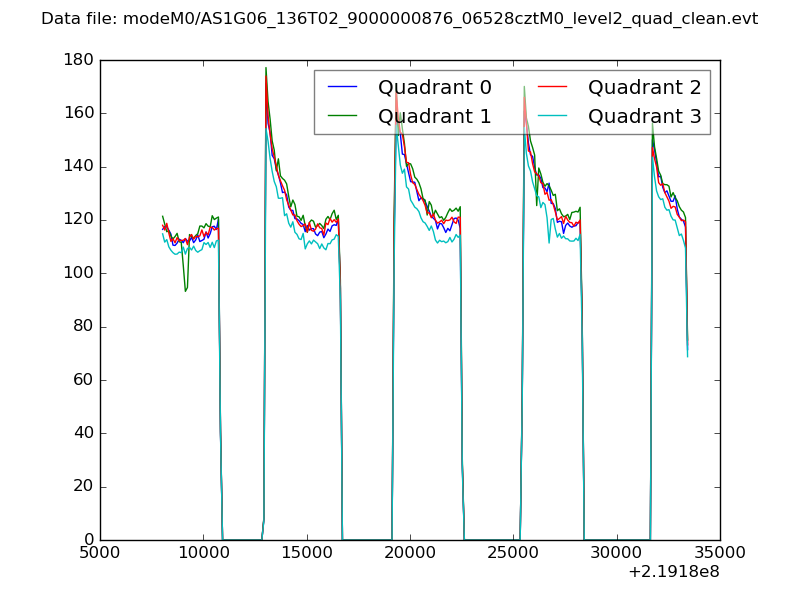 |
|
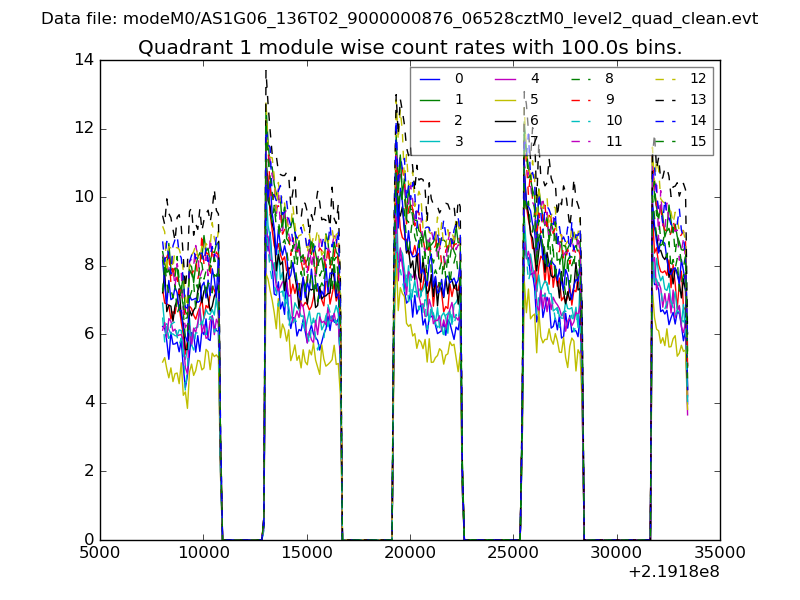
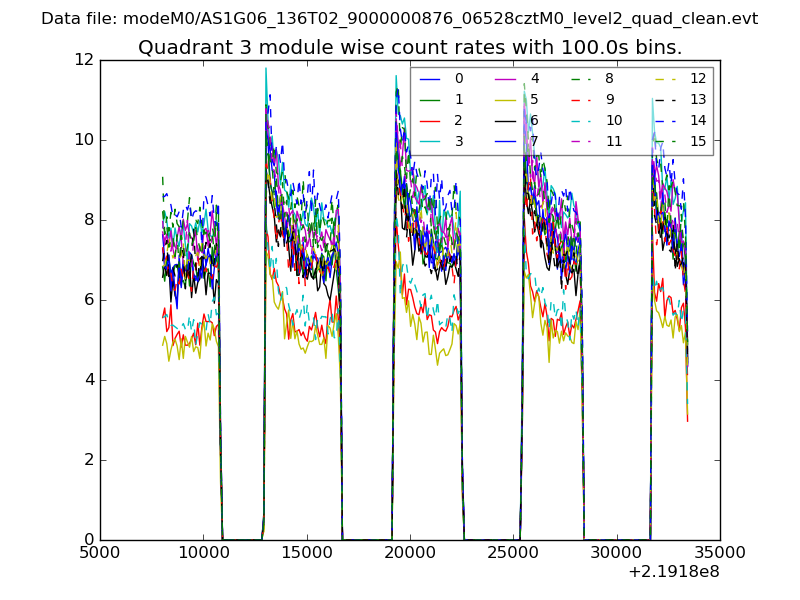
| Module-wise count rates for Quadrant A Data is divided into 100 sec bins |
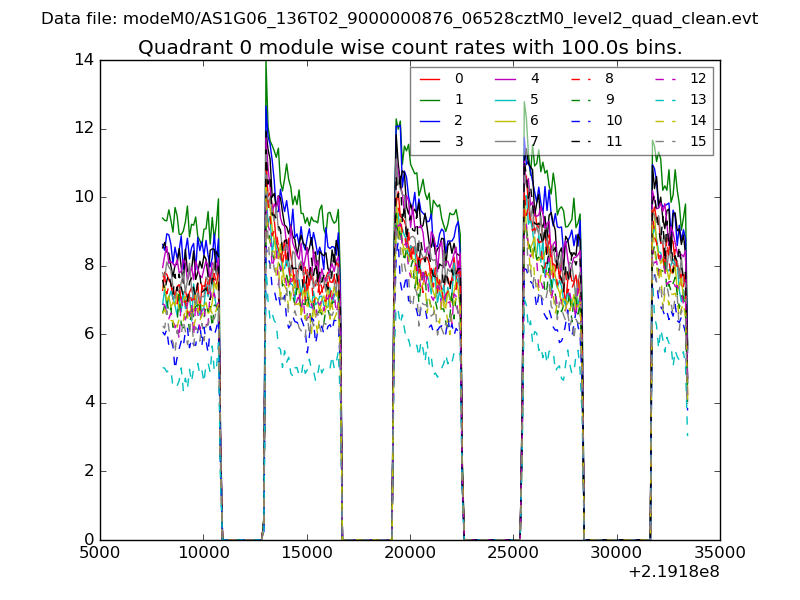 |
 |
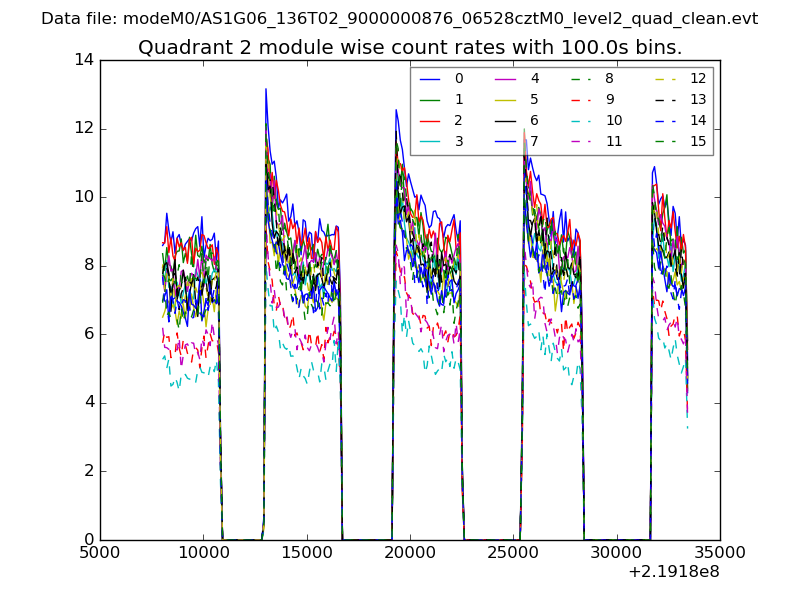
| Module-wise count rates for Quadrant B Data is divided into 100 sec bins |
 |
 |
| Module-wise count rates for Quadrant C Data is divided into 100 sec bins |
 |
 |
| Module-wise count rates for Quadrant D Data is divided into 100 sec bins |
 |
 |
| Parameter | Plot |
|---|---|
| CZT HV Monitor | 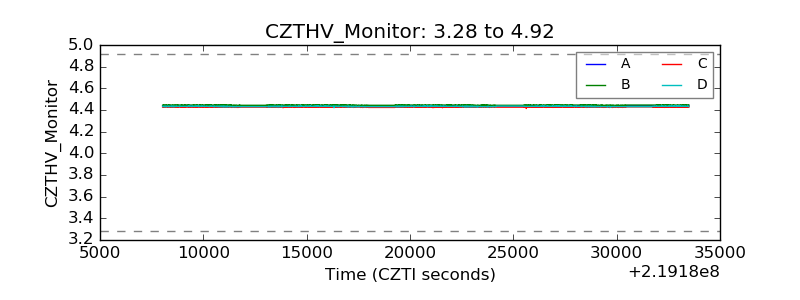 |
| D_VDD | 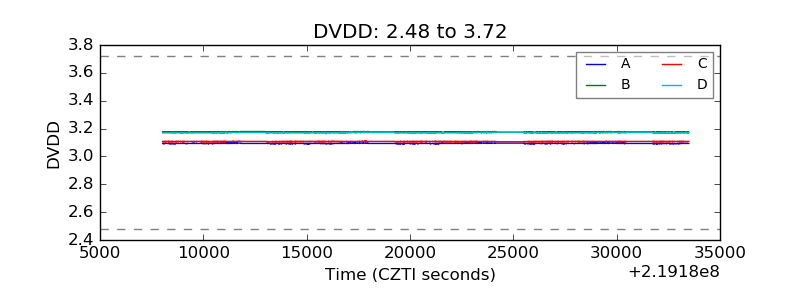 |
| Temperature 1 |  |
| Veto HV Monitor | 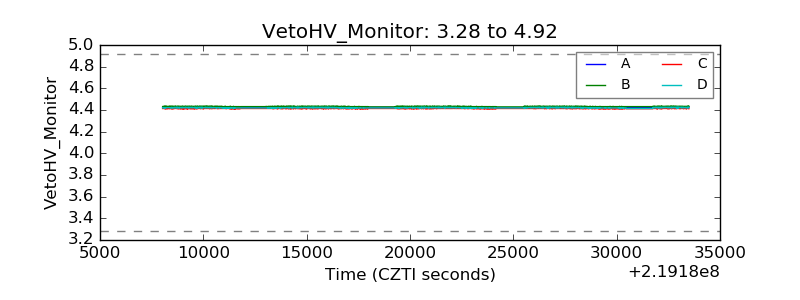 |
| Veto LLD | 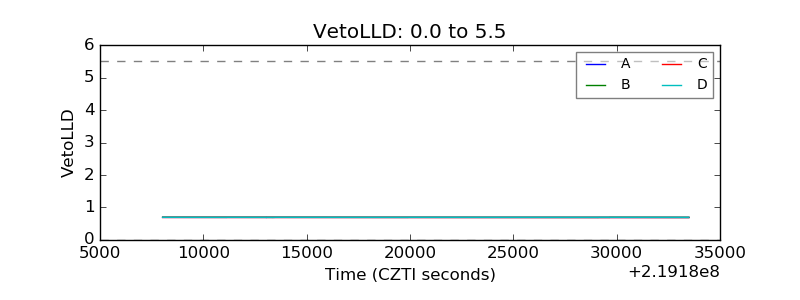 |
| Alpha Counter | 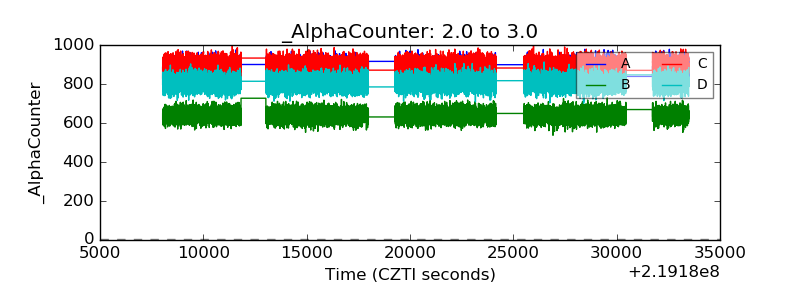 |
| _CPM_Rate | 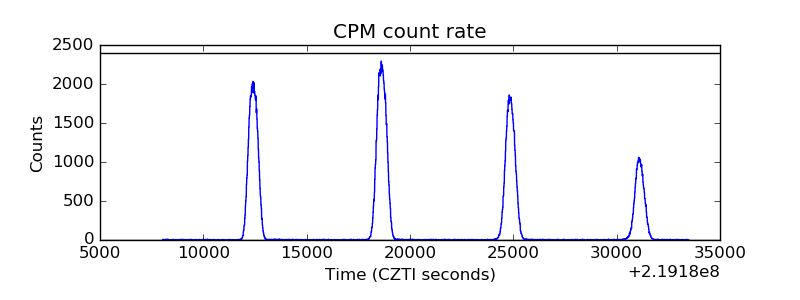 |
| CZT Counter | 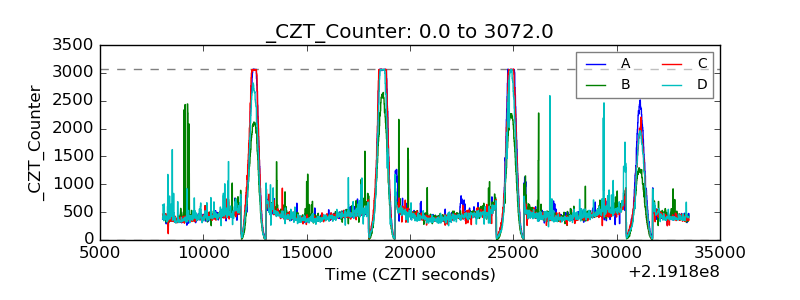 |
| +2.5 Volts monitor |  |
| +5 Volts monitor |  |
| _ROLL_ROT | 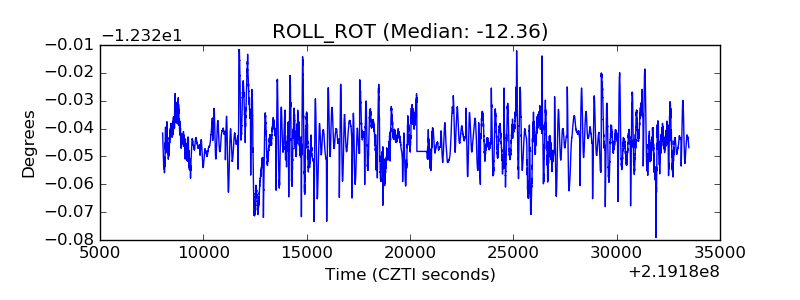 |
| _Roll_DEC | 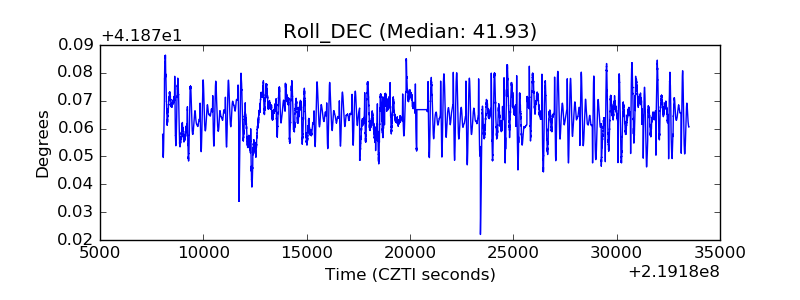 |
| _Roll_RA | 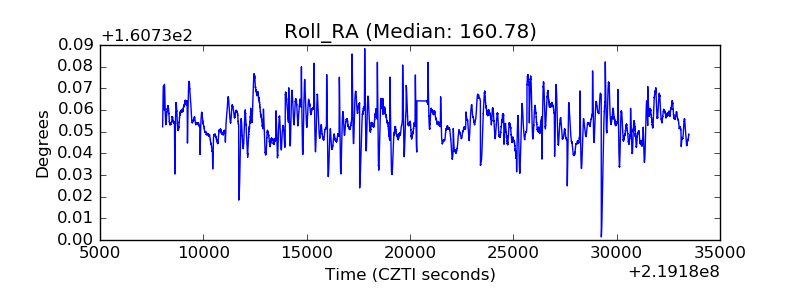 |
| Veto Counter | 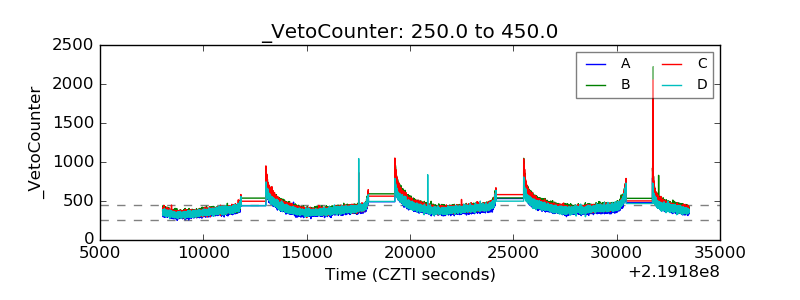 |