| Param | Original file | Final file |
|---|---|---|
| Filename | modeM0/AS1G06_136T02_9000000876_06529cztM0_level2.evt | modeM0/AS1G06_136T02_9000000876_06529cztM0_level2_quad_clean.evt |
| Size (bytes) | 396,898,560 | 80,524,800 |
| Size | 378.5 MB | 76.8 MB |
| Events in quadrant A | 2,965,316 | 505,766 |
| Events in quadrant B | 3,011,079 | 516,752 |
| Events in quadrant C | 2,704,602 | 504,880 |
| Events in quadrant D | 2,918,506 | 479,572 |
| Mode M0 | |||
|---|---|---|---|
| Quadrant | BADHDUFLAG | Total packets | Discarded packets |
| A | 0 | 13163 | 2 |
| B | 0 | 13158 | 1 |
| C | 0 | 12627 | 1 |
| D | 0 | 13250 | 1 |
| Mode M9 | |||
|---|---|---|---|
| Quadrant | BADHDUFLAG | Total packets | Discarded packets |
| A | 0 | 11 | 0 |
| B | 0 | 11 | 0 |
| C | 0 | 11 | 0 |
| D | 0 | 11 | 0 |
| Mode SS | |||
|---|---|---|---|
| Quadrant | BADHDUFLAG | Total packets | Discarded packets |
| A | 0 | 126 | 0 |
| B | 0 | 126 | 0 |
| C | 0 | 126 | 0 |
| D | 0 | 126 | 0 |
| Quadrant | Total seconds | Saturated seconds | Saturation percentage |
|---|---|---|---|
| A | 6177 | 95 | 1.537963% |
| B | 6177 | 50 | 0.809454% |
| C | 6177 | 12 | 0.194269% |
| D | 6177 | 56 | 0.906589% |
Noise dominated data is calculated using 1-second bins in cleaned event files. If a bin has >2000 counts, and if more than 50% of those come from <1% of pixels, then it is considered to be noise-dominated and hence unusable.
| Quadrant | # 1 sec bins | Bins with >0 counts | Bins with >2000 counts | High rate bins dominated by noise | Noise dominated (total time) | Noise dominated (detector-on time) | Marked lightcurve |
|---|---|---|---|---|---|---|---|
| A | 7343 | 6179 | 0 | 0 | 0.00% | 0.00% | 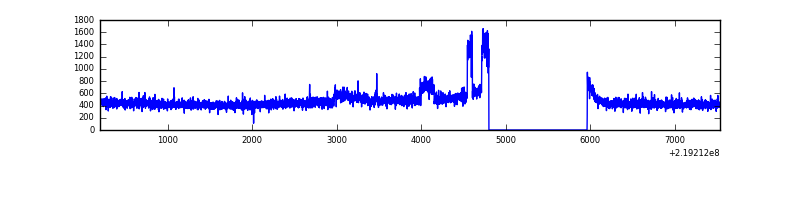 |
| B | 7343 | 6179 | 14 | 14 | 0.19% | 0.23% | 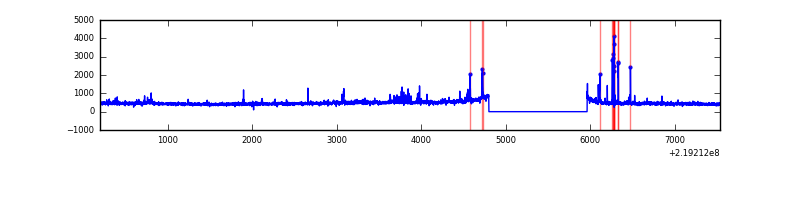 |
| C | 7343 | 6179 | 0 | 0 | 0.00% | 0.00% | 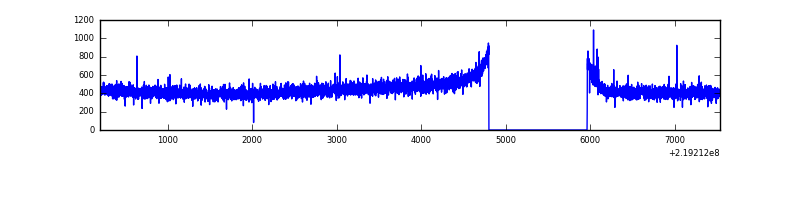 |
| D | 7343 | 6179 | 35 | 35 | 0.48% | 0.57% | 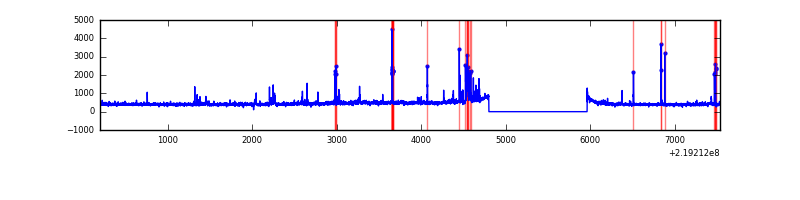 |
Top three noisy pixels from each quadrant. If the there are fewer than three noisy pixels in the level2.evt file, extra rows are filled as -1
| Pixel properties | Quadrant properties | ||||||
|---|---|---|---|---|---|---|---|
| Quadrant | DetID | PixID | Counts | Sigma | Mean | Median | Sigma |
| A | 15 | 236 | 180104 | 1225.47 | 719 | 703 | 146.4 |
| A | 8 | 15 | 8916 | 56.1 | 719 | 703 | 146.4 |
| A | 13 | 14 | 7141 | 43.98 | 719 | 703 | 146.4 |
| B | 0 | 219 | 58642 | 422.19 | 721 | 703 | 137.2 |
| B | 15 | 204 | 36427 | 260.32 | 721 | 703 | 137.2 |
| B | 4 | 81 | 33707 | 240.5 | 721 | 703 | 137.2 |
| C | 13 | 61 | 5539 | 30.2 | 692 | 694 | 160.4 |
| C | 12 | 4 | 5431 | 29.52 | 692 | 694 | 160.4 |
| C | 3 | 202 | 1709 | 6.33 | 692 | 694 | 160.4 |
| D | 12 | 233 | 104391 | 609.77 | 693 | 671 | 170.1 |
| D | 2 | 14 | 70215 | 408.85 | 693 | 671 | 170.1 |
| D | 2 | 152 | 51327 | 297.81 | 693 | 671 | 170.1 |
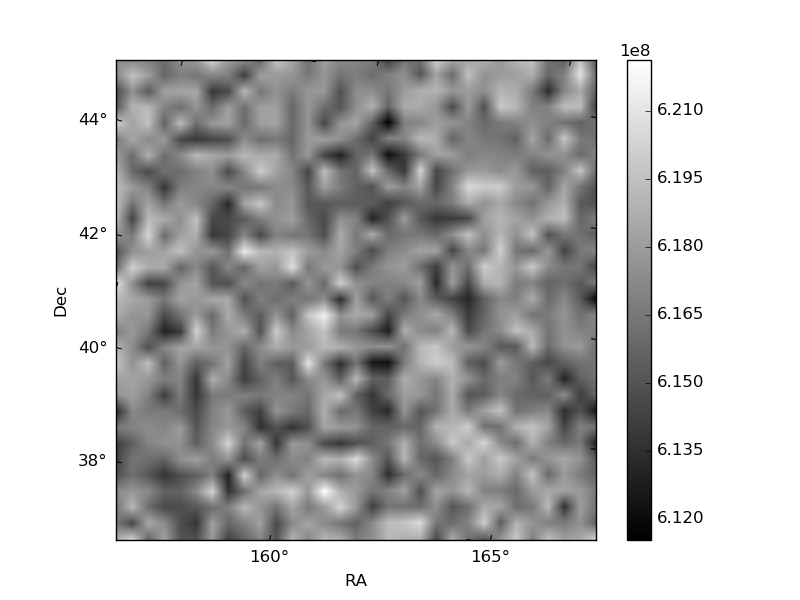
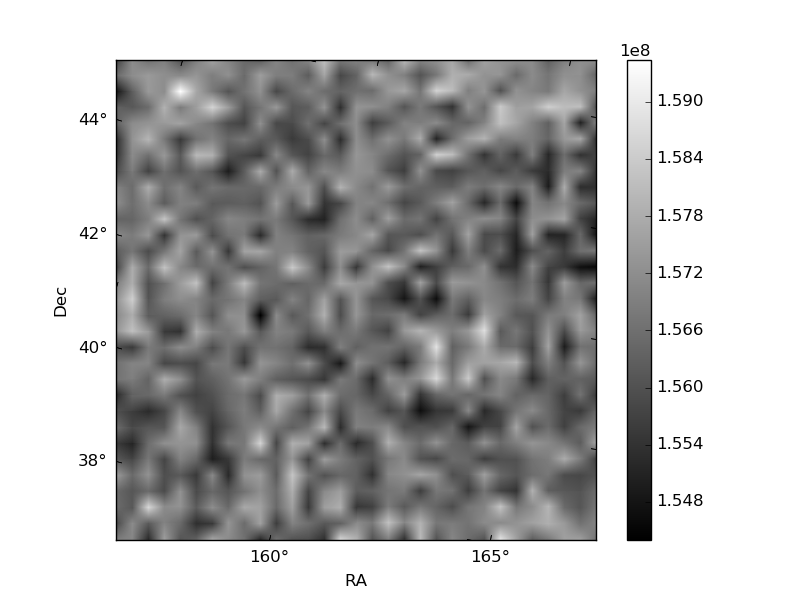
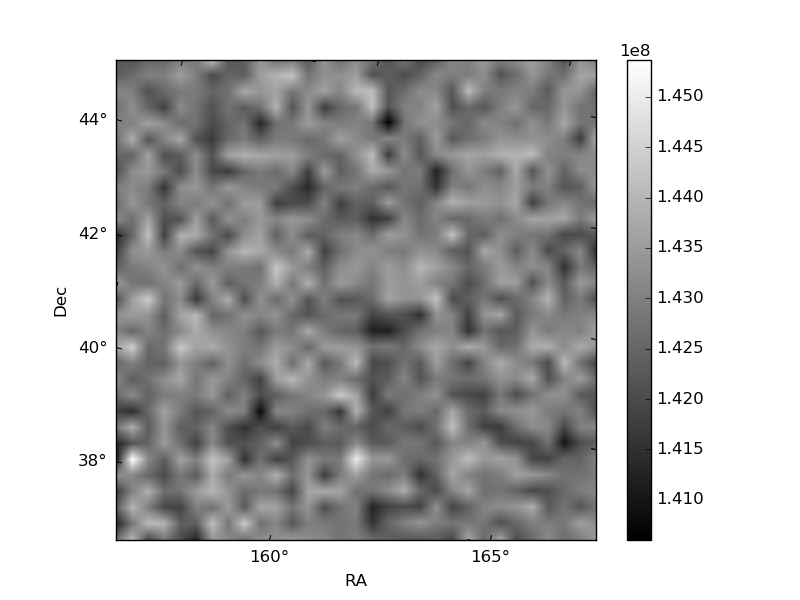
Histogram calculated using DETX and DETY for each event in the final _common_clean file
| Quadrant A | 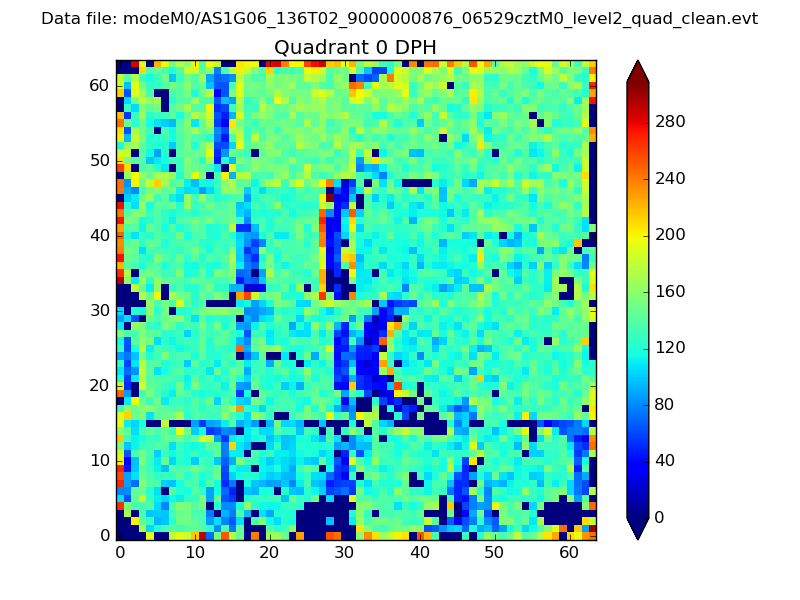 |
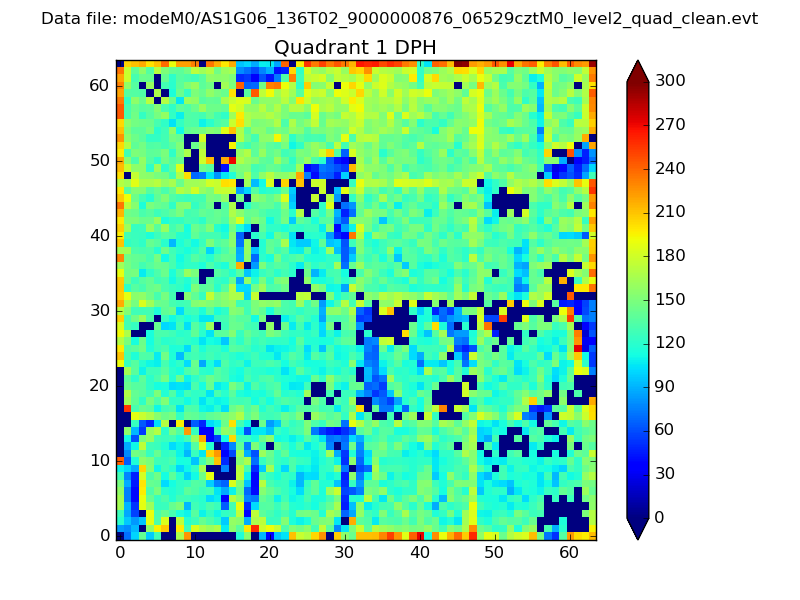 |
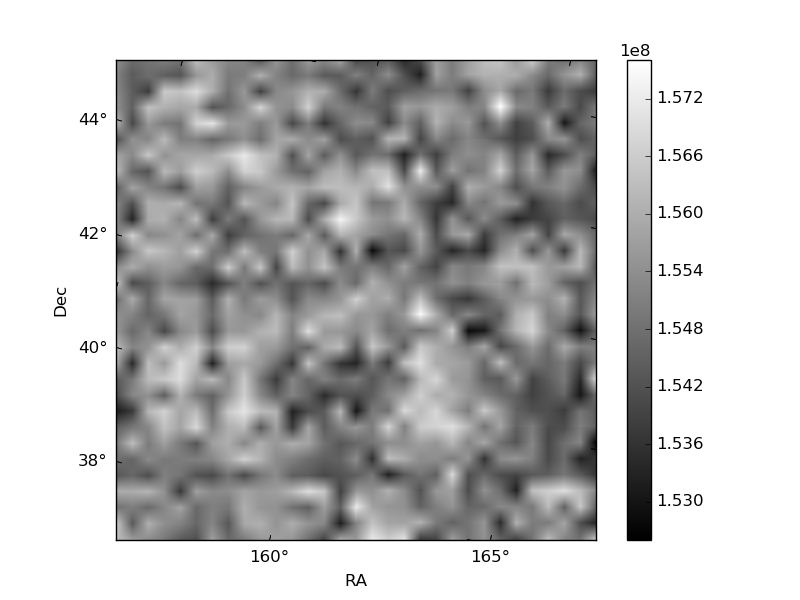
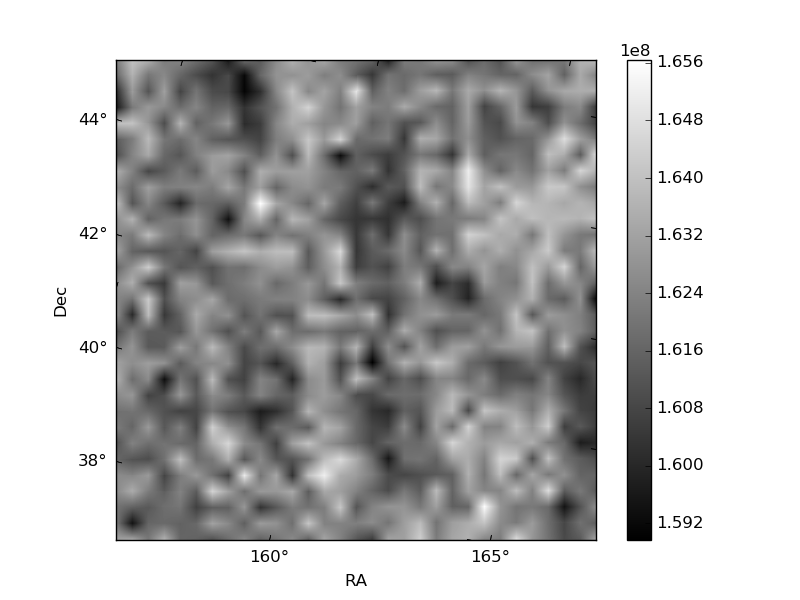
Quadrant B |
|---|---|---|---|
| Quadrant D | 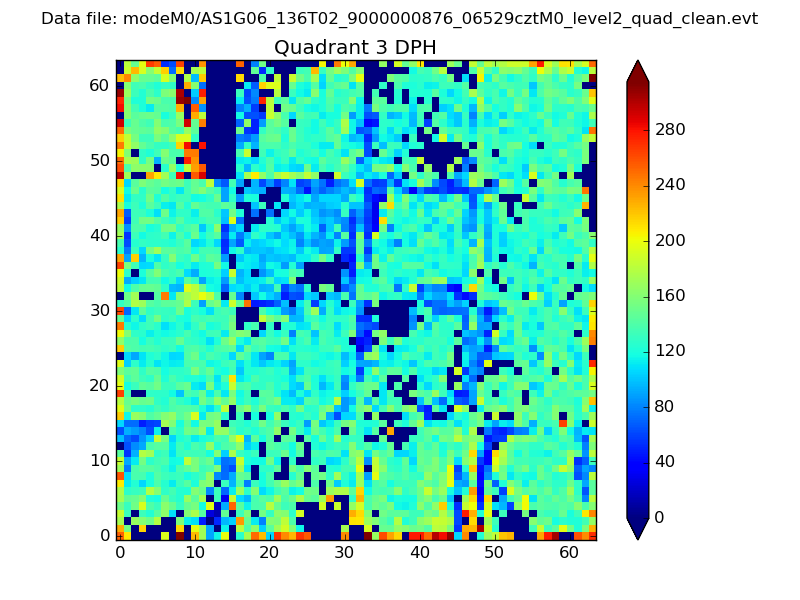 |
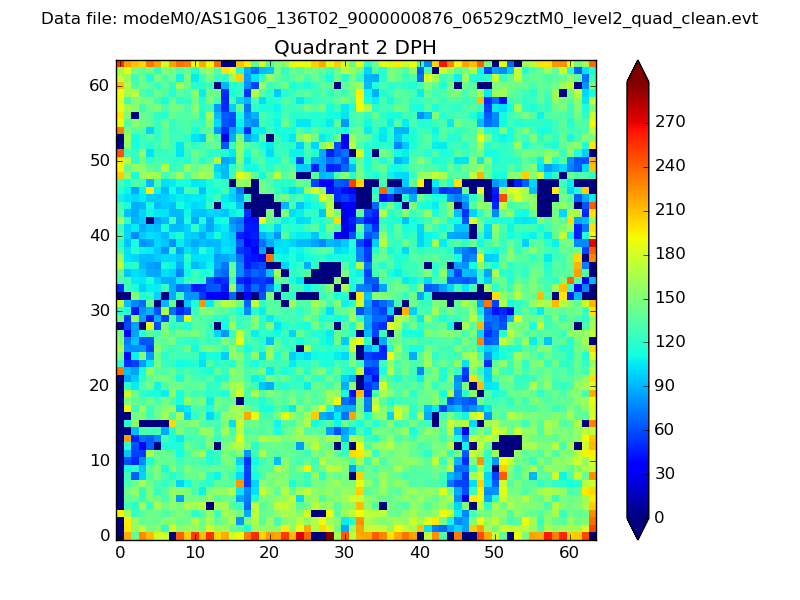 |
Quadrant C |
| Plot type | Count rate plots | Images |
|---|---|---|
| Comparison with Poisson distribution Blue bars denote a histogram of data divided into 1 sec bins. Red curve is a Poisson curve with rate = median count rate of data. |
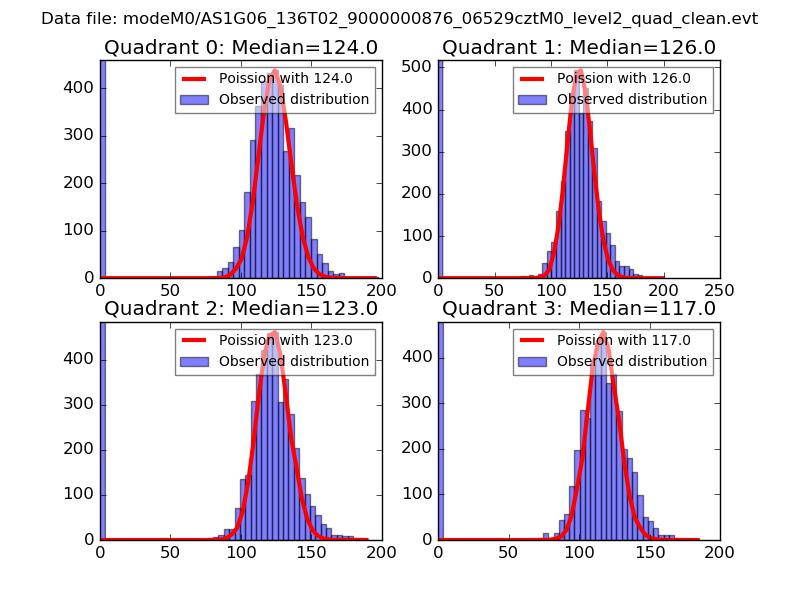 |
 |
| Quadrant-wise count rates Data is divided into 100 sec bins |
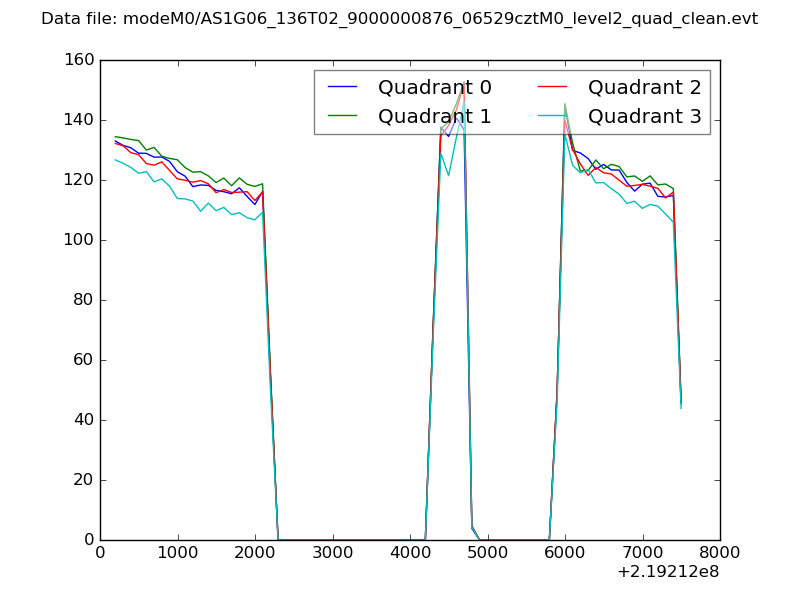 |
|
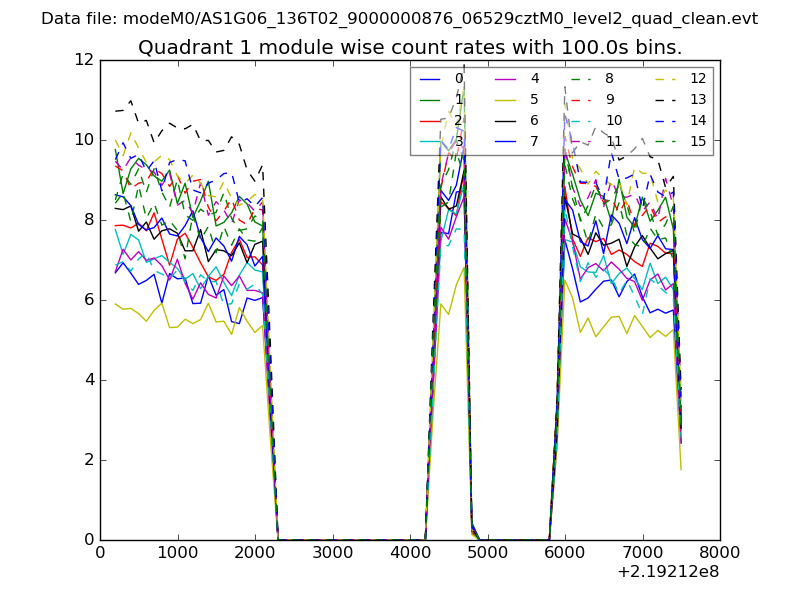
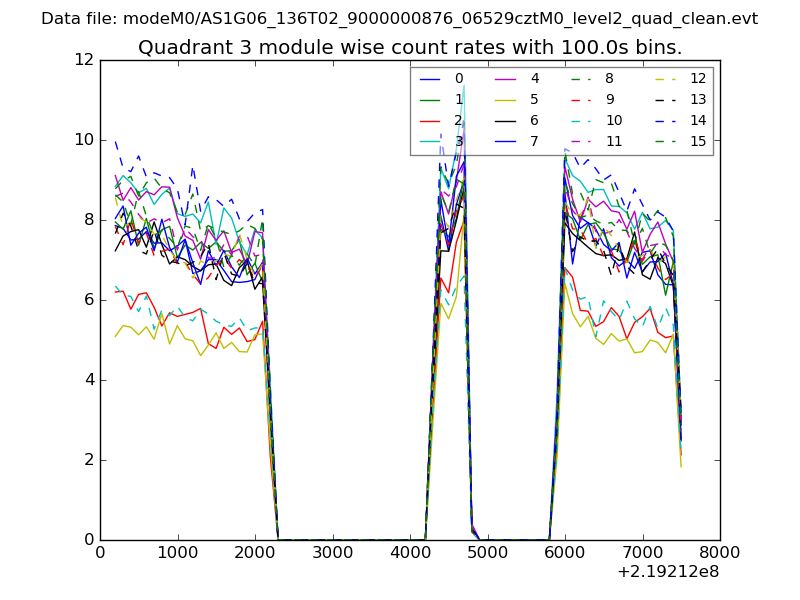
| Module-wise count rates for Quadrant A Data is divided into 100 sec bins |
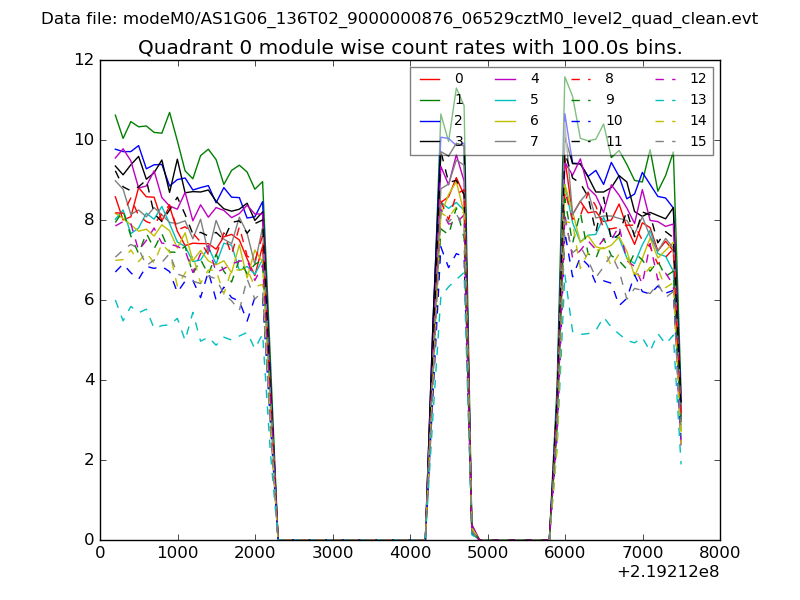 |
 |
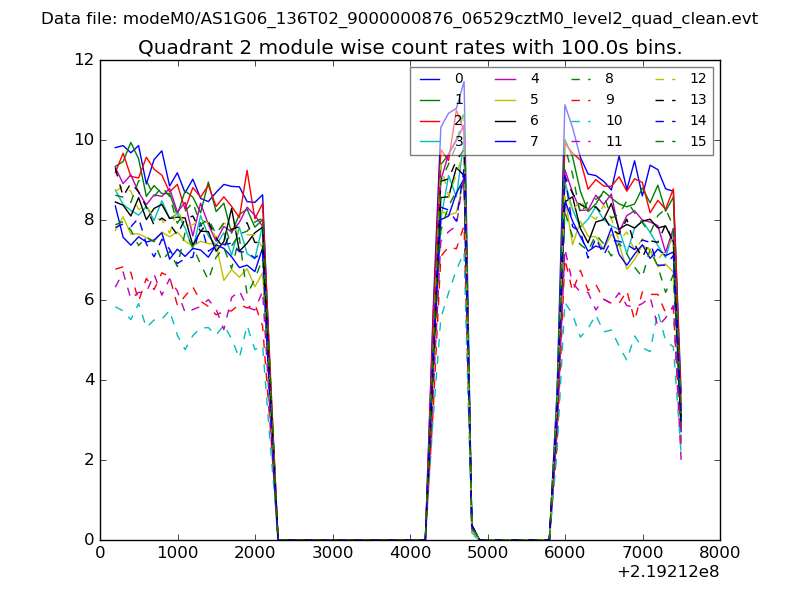
| Module-wise count rates for Quadrant B Data is divided into 100 sec bins |
 |
 |
| Module-wise count rates for Quadrant C Data is divided into 100 sec bins |
 |
 |
| Module-wise count rates for Quadrant D Data is divided into 100 sec bins |
 |
 |
| Parameter | Plot |
|---|---|
| CZT HV Monitor | 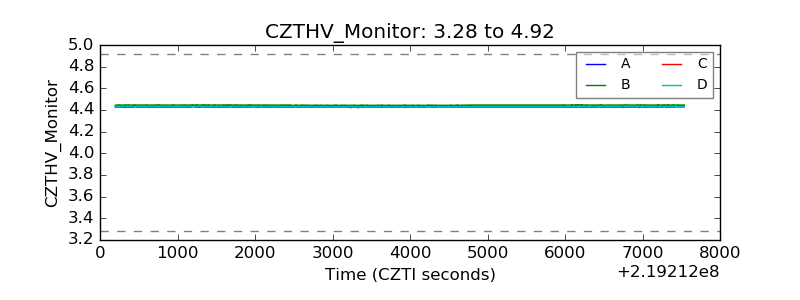 |
| D_VDD | 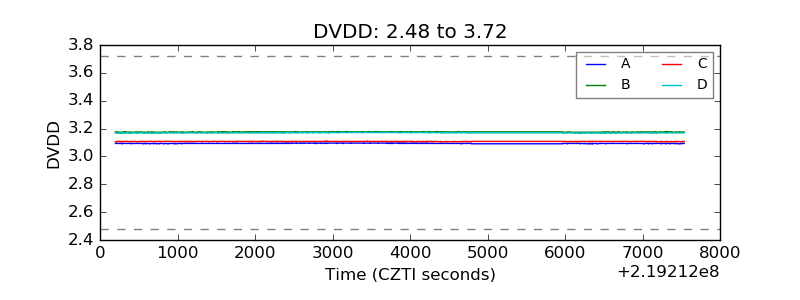 |
| Temperature 1 | 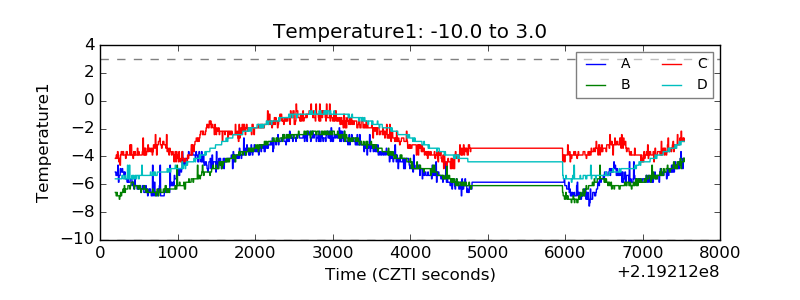 |
| Veto HV Monitor | 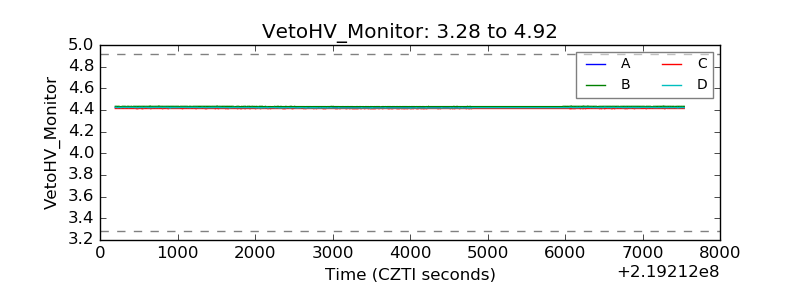 |
| Veto LLD | 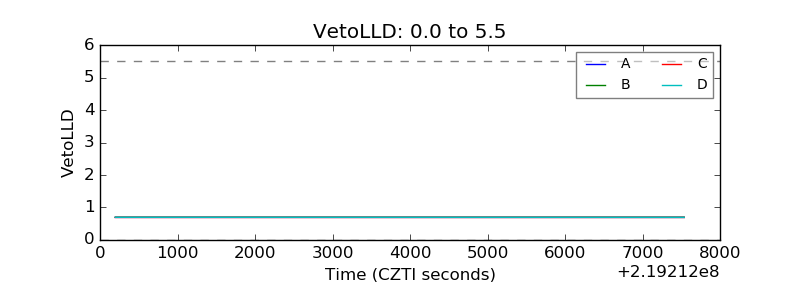 |
| Alpha Counter | 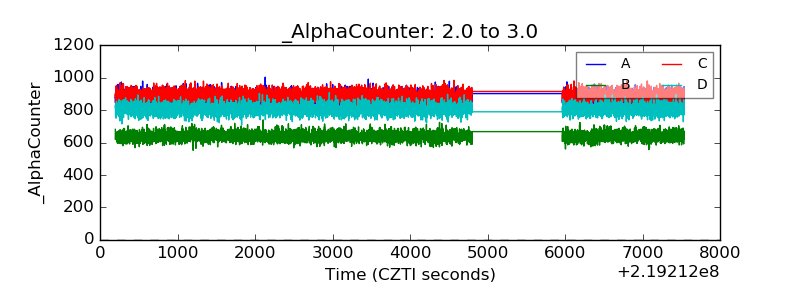 |
| _CPM_Rate | 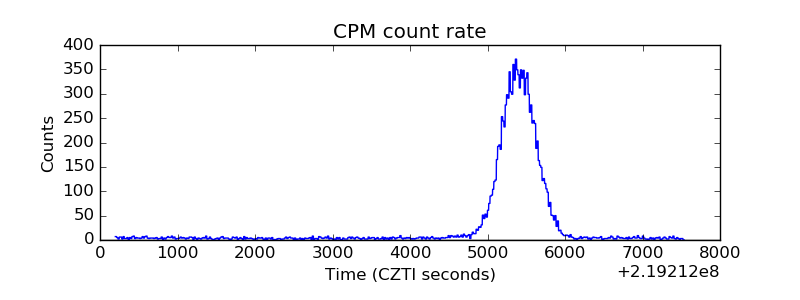 |
| CZT Counter | 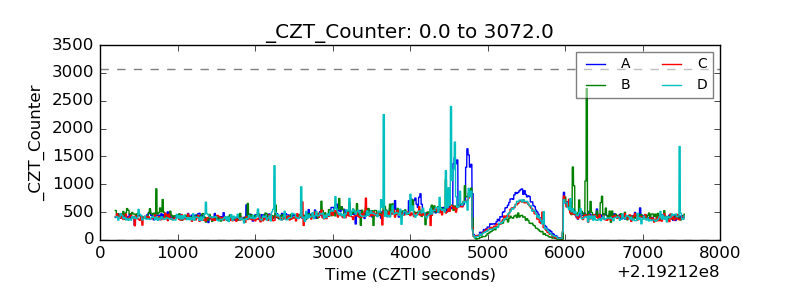 |
| +2.5 Volts monitor |  |
| +5 Volts monitor |  |
| _ROLL_ROT | 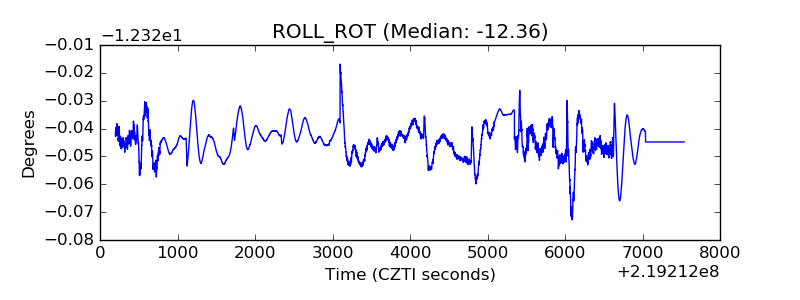 |
| _Roll_DEC | 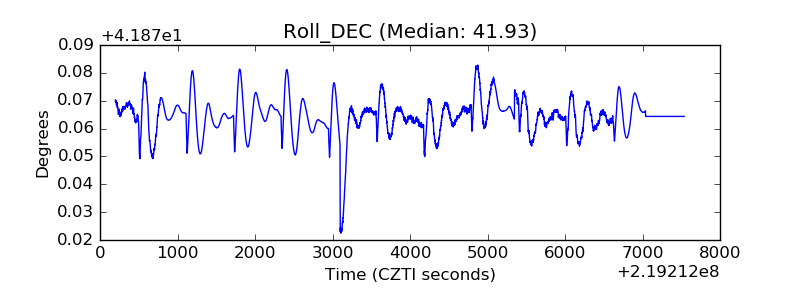 |
| _Roll_RA | 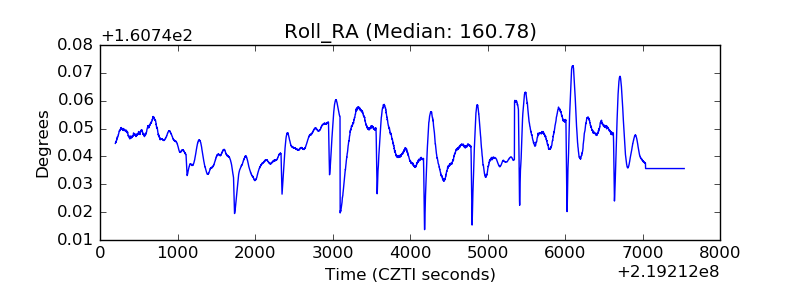 |
| Veto Counter | 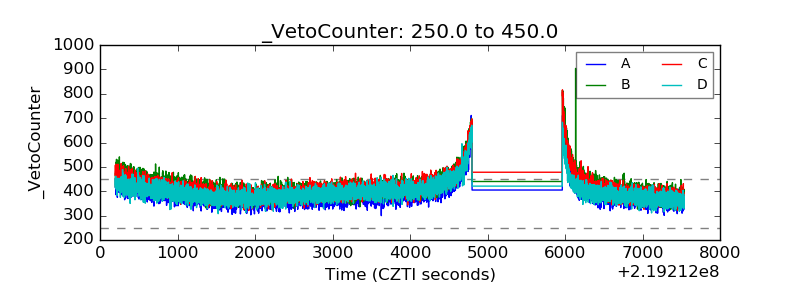 |