| Param | Original file | Final file |
|---|---|---|
| Filename | modeM0/AS1G06_136T02_9000000876_06530cztM0_level2.evt | modeM0/AS1G06_136T02_9000000876_06530cztM0_level2_quad_clean.evt |
| Size (bytes) | 433,702,080 | 89,280,000 |
| Size | 413.6 MB | 85.1 MB |
| Events in quadrant A | 3,095,402 | 561,908 |
| Events in quadrant B | 3,365,937 | 570,341 |
| Events in quadrant C | 2,917,578 | 561,172 |
| Events in quadrant D | 3,297,191 | 540,384 |
| Mode M0 | |||
|---|---|---|---|
| Quadrant | BADHDUFLAG | Total packets | Discarded packets |
| A | 0 | 13933 | 1 |
| B | 0 | 14571 | 0 |
| C | 0 | 13683 | 0 |
| D | 0 | 14658 | 0 |
| Mode M9 | |||
|---|---|---|---|
| Quadrant | BADHDUFLAG | Total packets | Discarded packets |
| A | 0 | 9 | 0 |
| B | 0 | 9 | 0 |
| C | 0 | 9 | 0 |
| D | 0 | 9 | 0 |
| Mode SS | |||
|---|---|---|---|
| Quadrant | BADHDUFLAG | Total packets | Discarded packets |
| A | 0 | 136 | 0 |
| B | 0 | 136 | 0 |
| C | 0 | 136 | 0 |
| D | 0 | 136 | 0 |
| Quadrant | Total seconds | Saturated seconds | Saturation percentage |
|---|---|---|---|
| A | 6744 | 74 | 1.097272% |
| B | 6744 | 104 | 1.542112% |
| C | 6744 | 20 | 0.296560% |
| D | 6744 | 79 | 1.171412% |
Noise dominated data is calculated using 1-second bins in cleaned event files. If a bin has >2000 counts, and if more than 50% of those come from <1% of pixels, then it is considered to be noise-dominated and hence unusable.
| Quadrant | # 1 sec bins | Bins with >0 counts | Bins with >2000 counts | High rate bins dominated by noise | Noise dominated (total time) | Noise dominated (detector-on time) | Marked lightcurve |
|---|---|---|---|---|---|---|---|
| A | 7584 | 6745 | 0 | 0 | 0.00% | 0.00% | 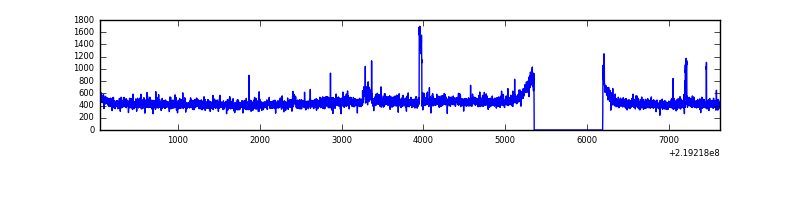 |
| B | 7584 | 6745 | 25 | 25 | 0.33% | 0.37% | 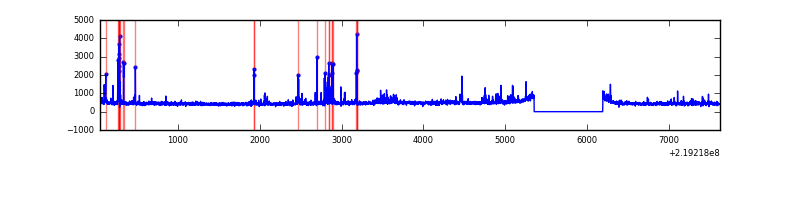 |
| C | 7584 | 6745 | 0 | 0 | 0.00% | 0.00% | 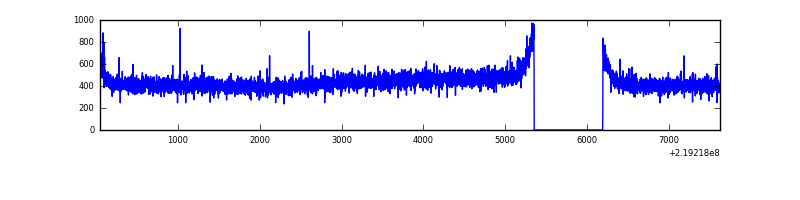 |
| D | 7584 | 6745 | 38 | 38 | 0.50% | 0.56% | 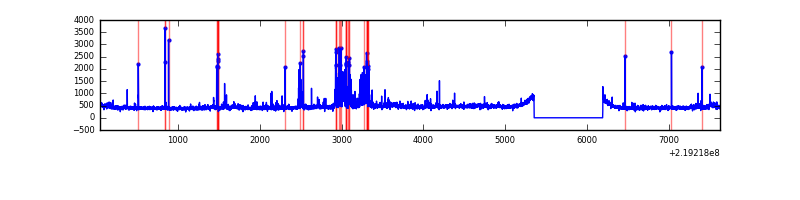 |
Top three noisy pixels from each quadrant. If the there are fewer than three noisy pixels in the level2.evt file, extra rows are filled as -1
| Pixel properties | Quadrant properties | ||||||
|---|---|---|---|---|---|---|---|
| Quadrant | DetID | PixID | Counts | Sigma | Mean | Median | Sigma |
| A | 15 | 236 | 80692 | 502.7 | 777 | 760 | 159.0 |
| A | 8 | 15 | 8086 | 46.07 | 777 | 760 | 159.0 |
| A | 15 | 239 | 7686 | 43.56 | 777 | 760 | 159.0 |
| B | 4 | 81 | 141995 | 946.95 | 777 | 759 | 149.1 |
| B | 0 | 219 | 70076 | 464.75 | 777 | 759 | 149.1 |
| B | 4 | 48 | 60669 | 401.68 | 777 | 759 | 149.1 |
| C | 13 | 61 | 5977 | 30.23 | 746 | 748 | 173.0 |
| C | 12 | 4 | 4120 | 19.49 | 746 | 748 | 173.0 |
| C | 8 | 222 | 2205 | 8.42 | 746 | 748 | 173.0 |
| D | 12 | 233 | 261242 | 1425.6 | 748 | 725 | 182.7 |
| D | 2 | 152 | 49461 | 266.69 | 748 | 725 | 182.7 |
| D | 2 | 14 | 31598 | 168.94 | 748 | 725 | 182.7 |
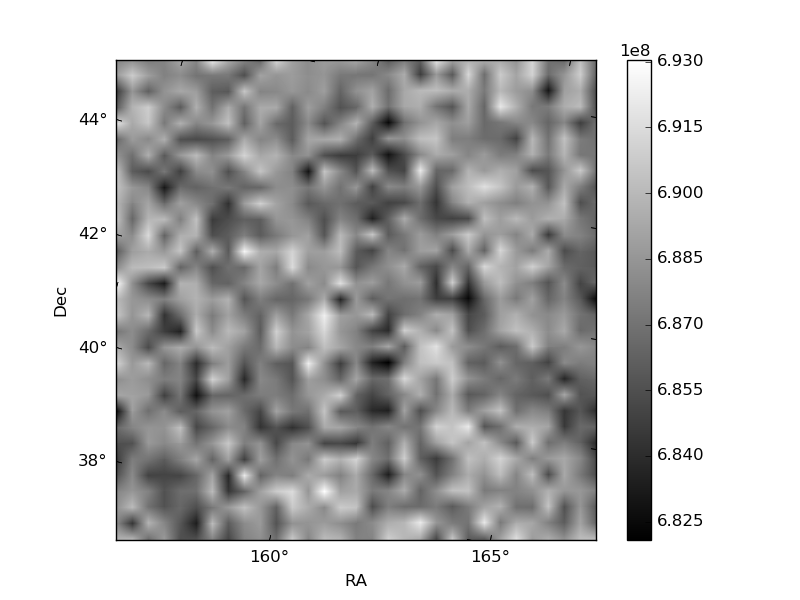
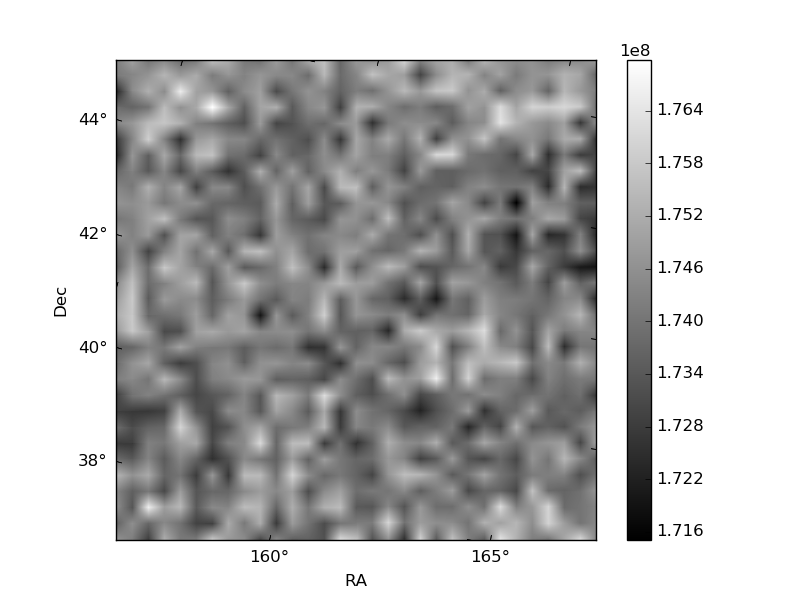
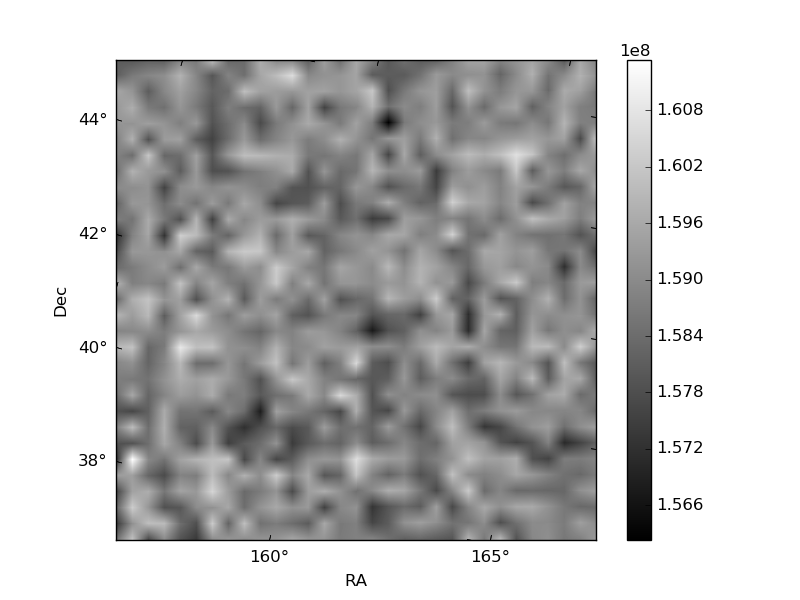
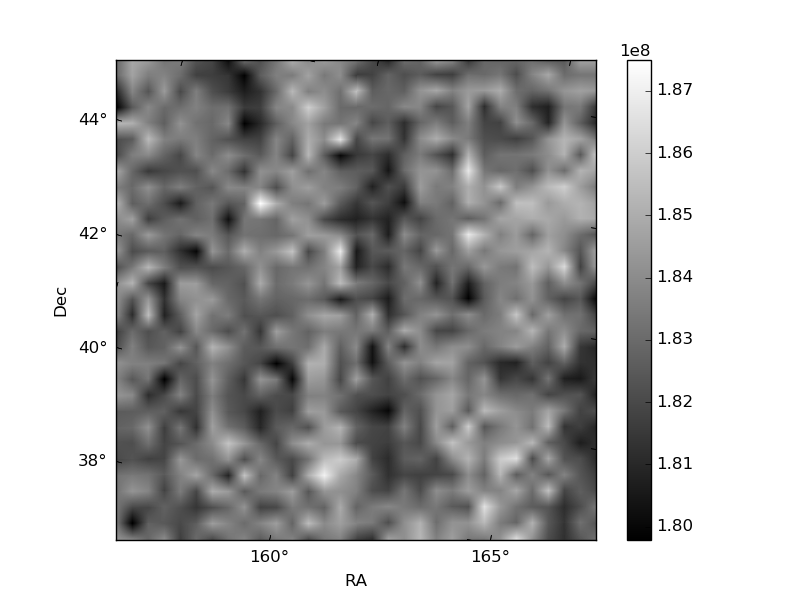
Histogram calculated using DETX and DETY for each event in the final _common_clean file
| Quadrant A | 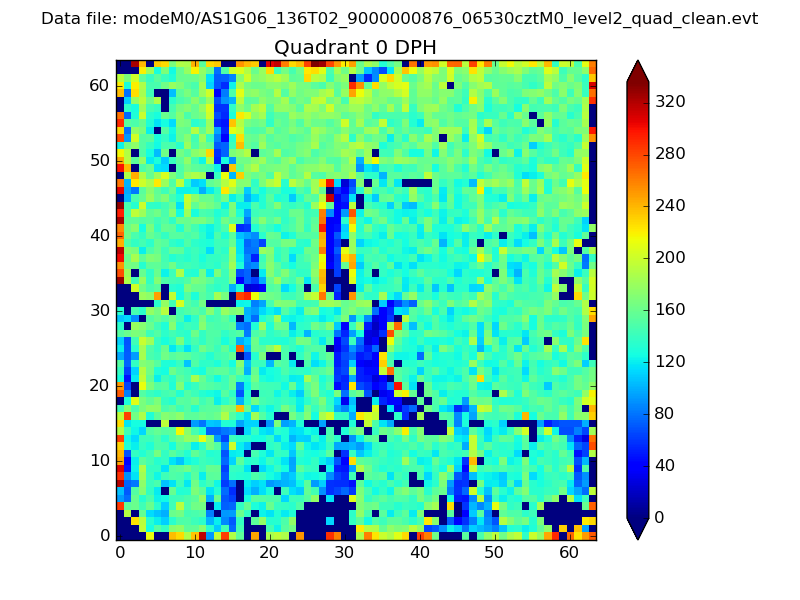 |
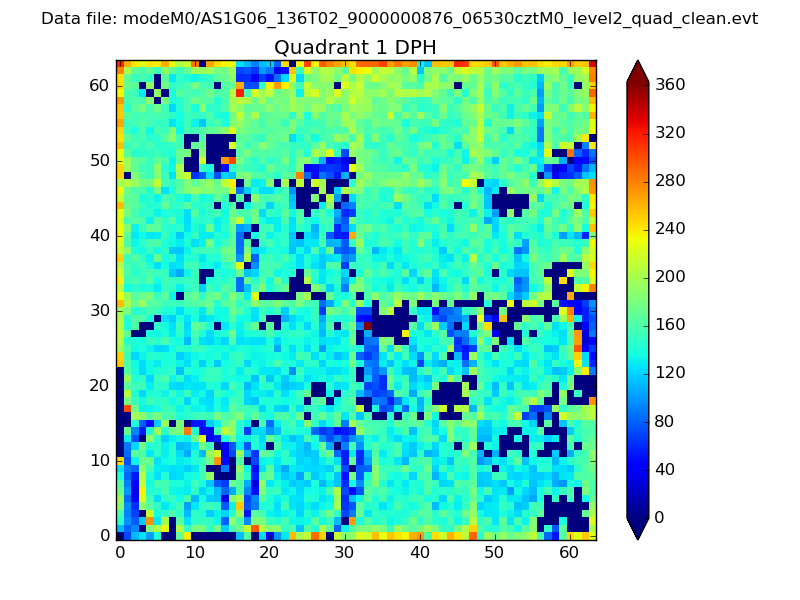 |
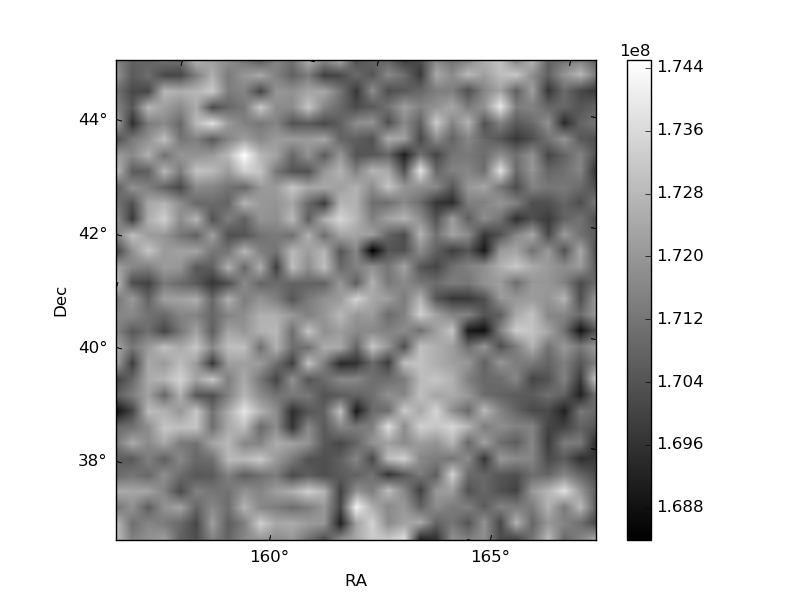
Quadrant B |
|---|---|---|---|
| Quadrant D | 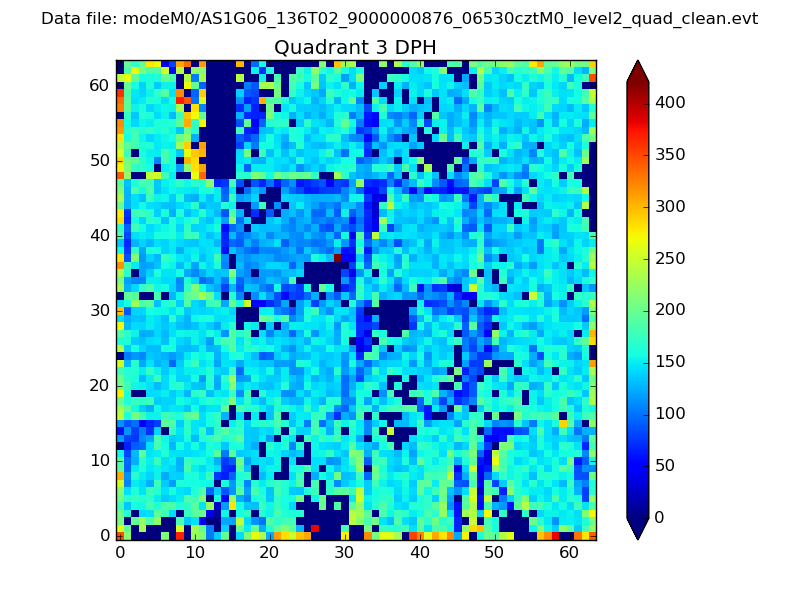 |
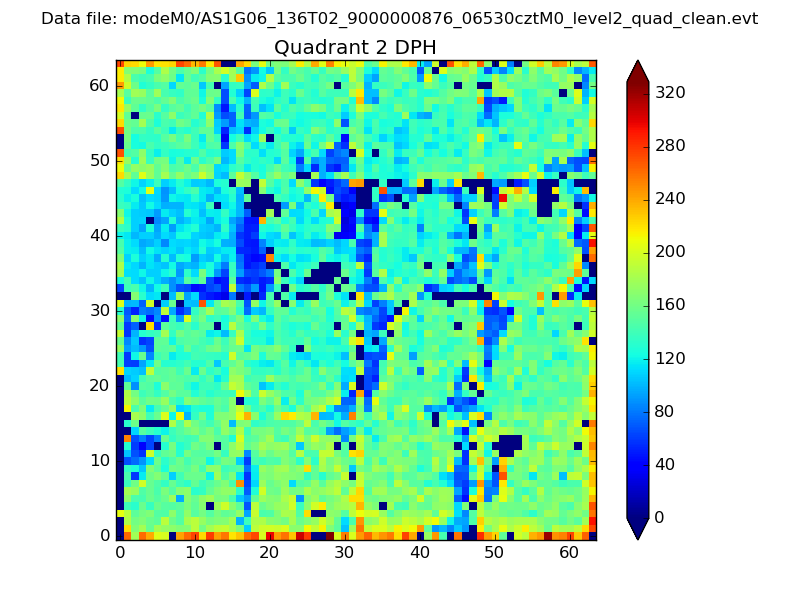 |
Quadrant C |
| Plot type | Count rate plots | Images |
|---|---|---|
| Comparison with Poisson distribution Blue bars denote a histogram of data divided into 1 sec bins. Red curve is a Poisson curve with rate = median count rate of data. |
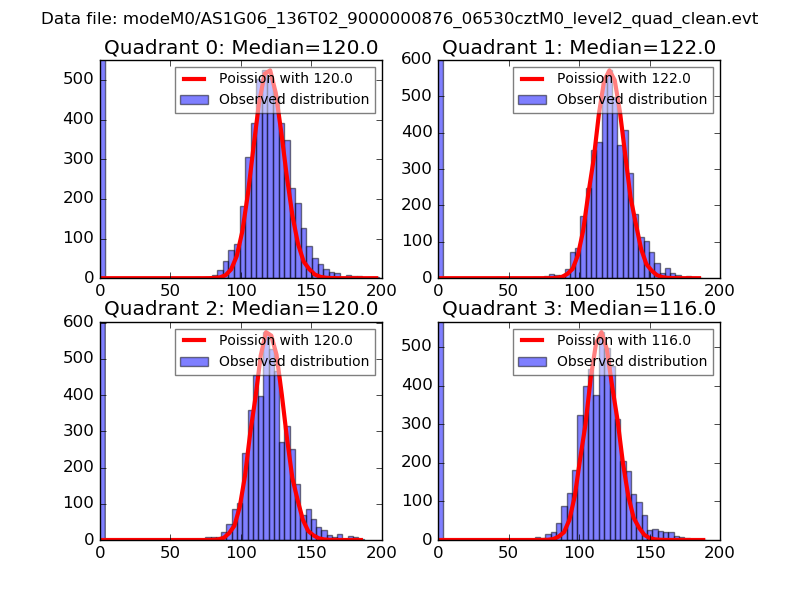 |
 |
| Quadrant-wise count rates Data is divided into 100 sec bins |
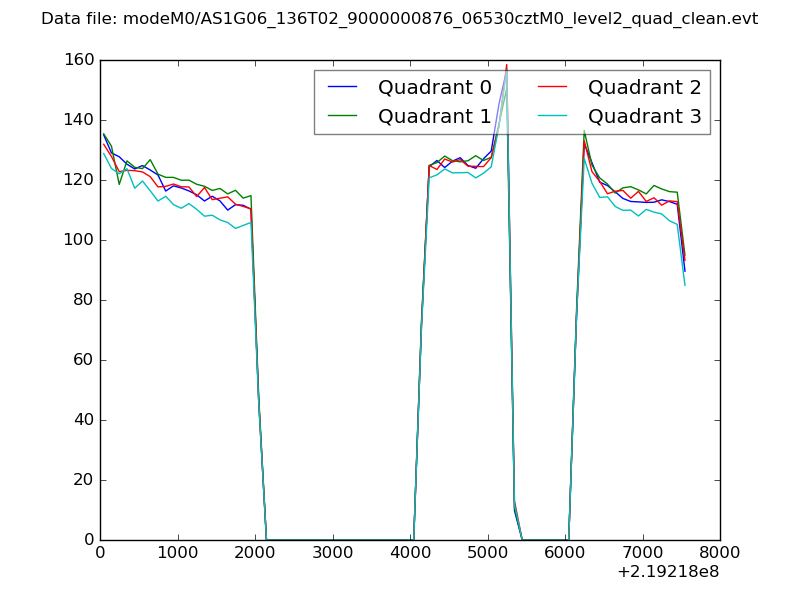 |
|
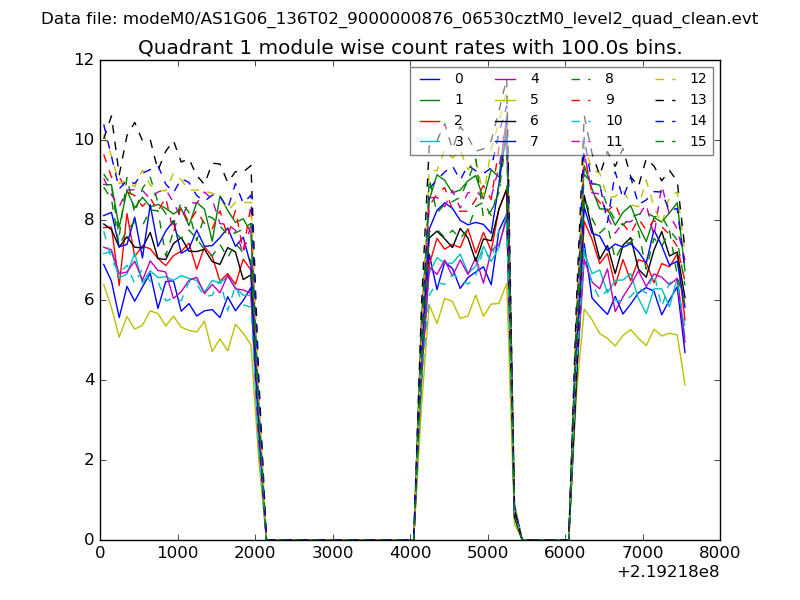
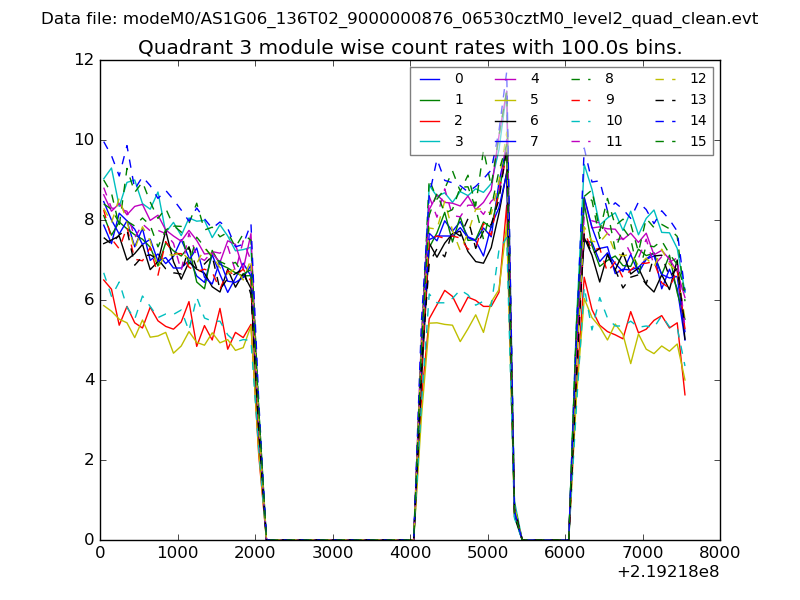
| Module-wise count rates for Quadrant A Data is divided into 100 sec bins |
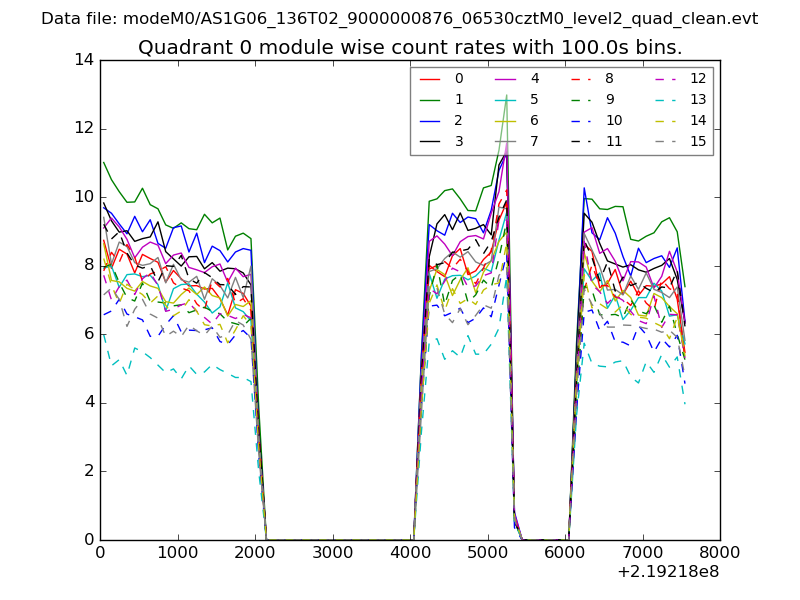 |
 |
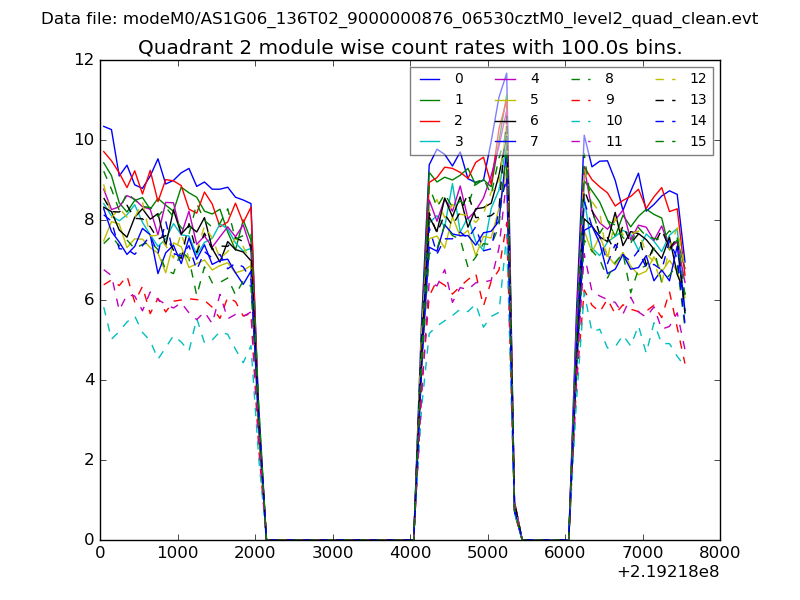
| Module-wise count rates for Quadrant B Data is divided into 100 sec bins |
 |
 |
| Module-wise count rates for Quadrant C Data is divided into 100 sec bins |
 |
 |
| Module-wise count rates for Quadrant D Data is divided into 100 sec bins |
 |
 |
| Parameter | Plot |
|---|---|
| CZT HV Monitor | 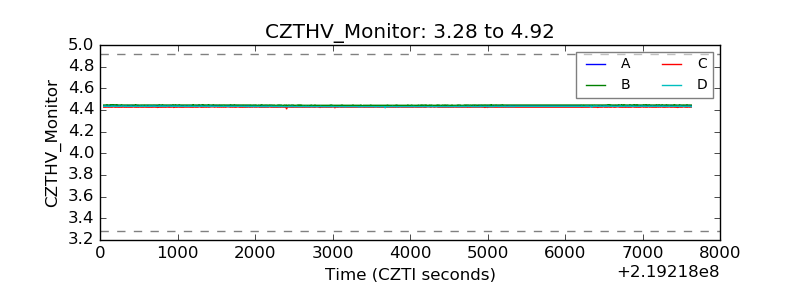 |
| D_VDD | 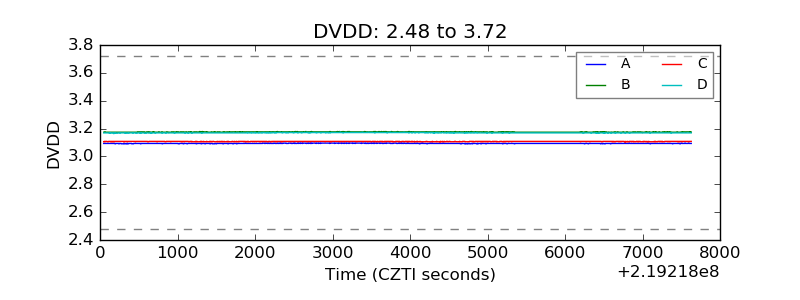 |
| Temperature 1 | 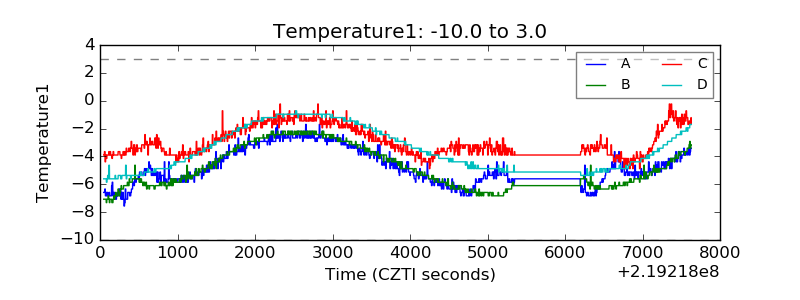 |
| Veto HV Monitor | 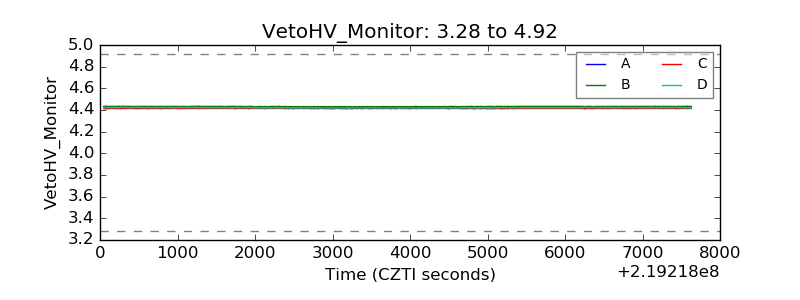 |
| Veto LLD | 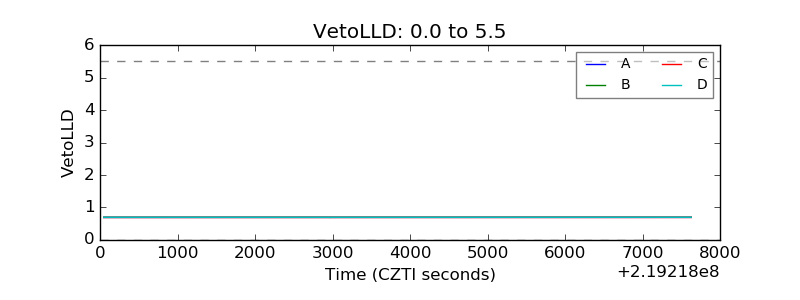 |
| Alpha Counter | 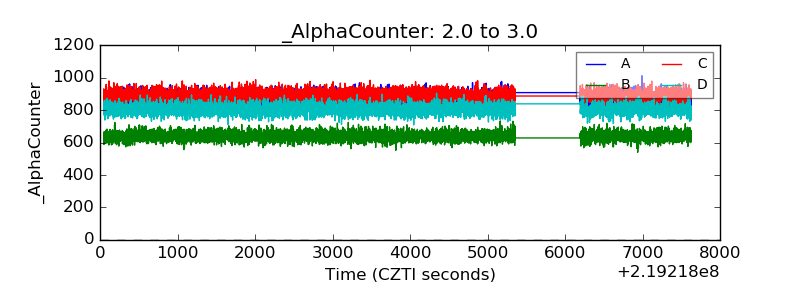 |
| _CPM_Rate | 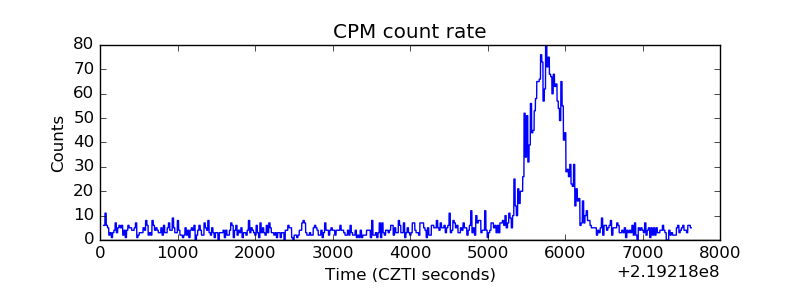 |
| CZT Counter | 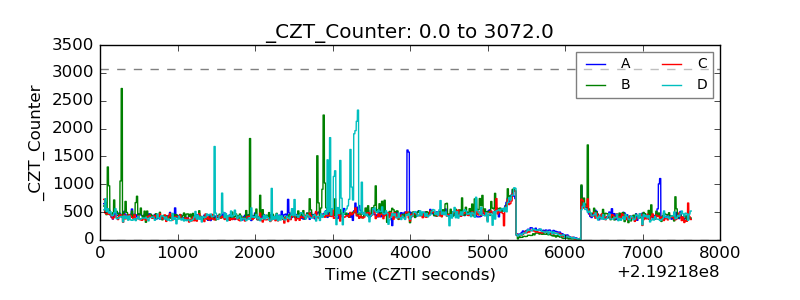 |
| +2.5 Volts monitor |  |
| +5 Volts monitor |  |
| _ROLL_ROT | 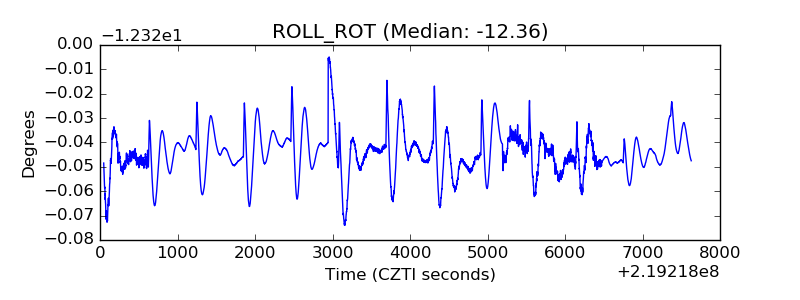 |
| _Roll_DEC | 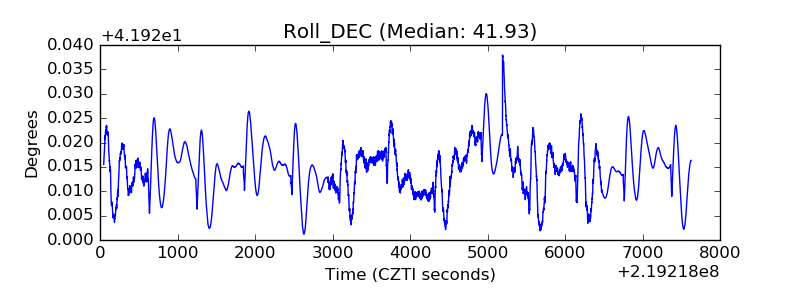 |
| _Roll_RA | 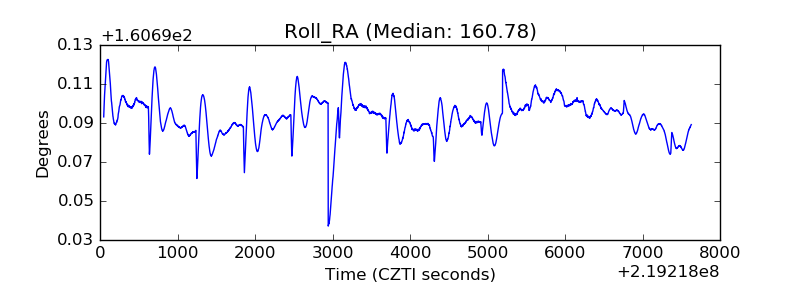 |
| Veto Counter | 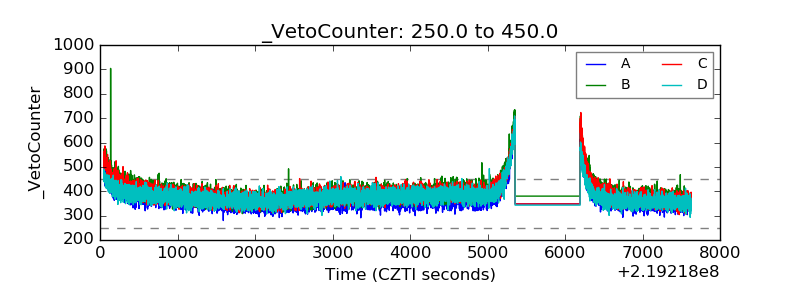 |