| Param | Original file | Final file |
|---|---|---|
| Filename | modeM0/AS1G06_091T01_9000000880cztM0_level2.fits | modeM0/AS1G06_091T01_9000000880cztM0_level2_quad_clean.evt |
| Size (bytes) | 599,901,120 | 716,711,040 |
| Size | 572.1 MB | 683.5 MB |
| Events in quadrant A | 3,535,311 | 4,441,378 |
| Events in quadrant B | 3,454,375 | 4,471,293 |
| Events in quadrant C | 3,589,330 | 4,317,503 |
| Events in quadrant D | 3,039,002 | 3,929,762 |
| Mode M0 | |||
|---|---|---|---|
| Quadrant | BADHDUFLAG | Total packets | Discarded packets |
| A | 0 | 153441 | 0 |
| B | 0 | 147437 | 0 |
| C | 0 | 135715 | 0 |
| D | 0 | 153630 | 0 |
| Mode M9 | |||
|---|---|---|---|
| Quadrant | BADHDUFLAG | Total packets | Discarded packets |
| A | 0 | 110 | 0 |
| B | 0 | 109 | 0 |
| C | 0 | 110 | 0 |
| D | 0 | 110 | 0 |
| Mode SS | |||
|---|---|---|---|
| Quadrant | BADHDUFLAG | Total packets | Discarded packets |
| A | 0 | 1348 | 0 |
| B | 0 | 1346 | 0 |
| C | 0 | 1352 | 0 |
| D | 0 | 1354 | 0 |
| Quadrant | Total seconds | Saturated seconds | Saturation percentage |
|---|---|---|---|
| A | 66295 | 2182 | 3.291349% |
| B | 66307 | 1869 | 2.818707% |
| C | 66341 | 768 | 1.157655% |
| D | 66284 | 2086 | 3.147064% |
Noise dominated data is calculated using 1-second bins in cleaned event files. If a bin has >2000 counts, and if more than 50% of those come from <1% of pixels, then it is considered to be noise-dominated and hence unusable.
| Quadrant | # 1 sec bins | Bins with >0 counts | Bins with >2000 counts | High rate bins dominated by noise | Noise dominated (total time) | Noise dominated (detector-on time) | Marked lightcurve |
|---|---|---|---|---|---|---|---|
| A | 77612 | 66753 | 0 | 0 | 0.00% | 0.00% | 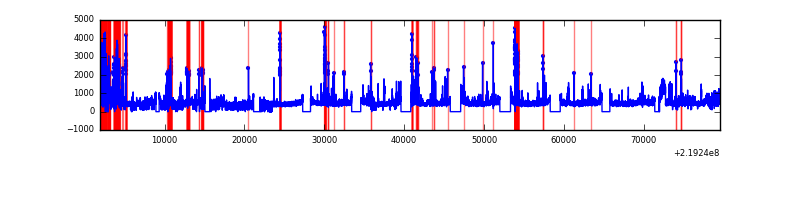 |
| B | 77612 | 66721 | 0 | 0 | 0.00% | 0.00% | 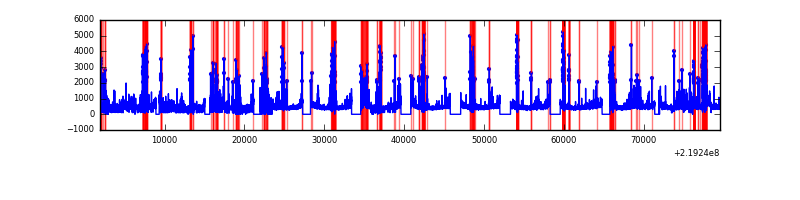 |
| C | 77612 | 66758 | 0 | 0 | 0.00% | 0.00% | 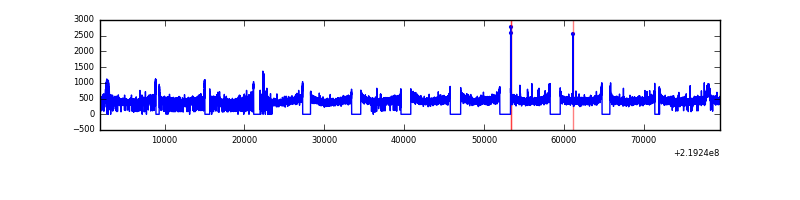 |
| D | 77612 | 66718 | 0 | 0 | 0.00% | 0.00% | 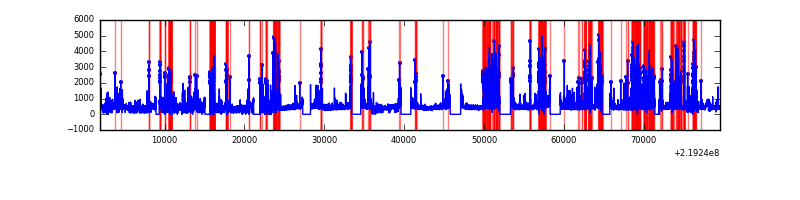 |
Top three noisy pixels from each quadrant. If the there are fewer than three noisy pixels in the level2.evt file, extra rows are filled as -1
| Pixel properties | Quadrant properties | ||||||
|---|---|---|---|---|---|---|---|
| Quadrant | DetID | PixID | Counts | Sigma | Mean | Median | Sigma |
| A | 14 | 188 | 3593 | 11.73 | 918 | 858 | 233.2 |
| A | 0 | 29 | 3583 | 11.69 | 918 | 858 | 233.2 |
| A | 7 | 110 | 3085 | 9.55 | 918 | 858 | 233.2 |
| B | 2 | 9 | 3073 | 12.37 | 912 | 871 | 178.1 |
| B | 12 | 226 | 2442 | 8.82 | 912 | 871 | 178.1 |
| B | 14 | 254 | 2390 | 8.53 | 912 | 871 | 178.1 |
| C | 1 | 81 | 2582 | 6.89 | 946 | 877 | 247.4 |
| C | 1 | 80 | 2580 | 6.88 | 946 | 877 | 247.4 |
| C | 12 | 241 | 2569 | 6.84 | 946 | 877 | 247.4 |
| D | 11 | 82 | 2232 | 6.26 | 867 | 788 | 230.8 |
| D | 3 | 14 | 2210 | 6.16 | 867 | 788 | 230.8 |
| D | 3 | 31 | 2196 | 6.1 | 867 | 788 | 230.8 |
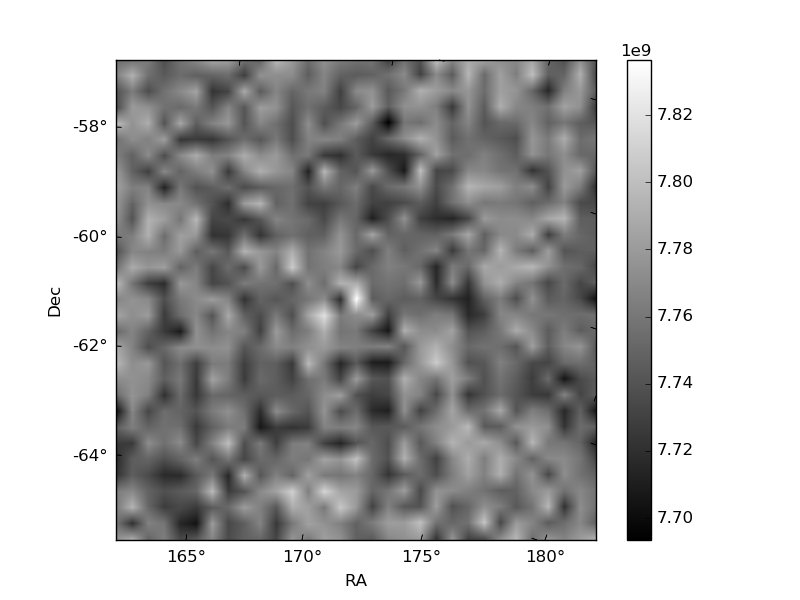
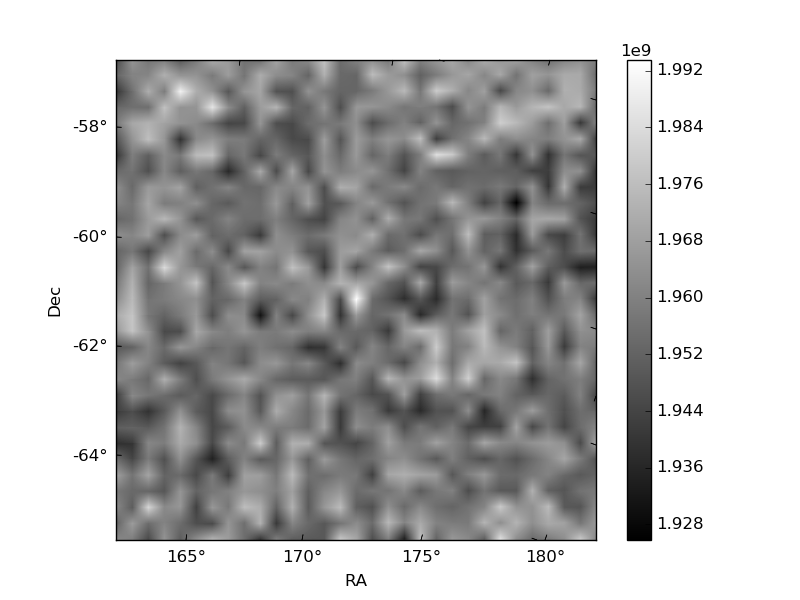
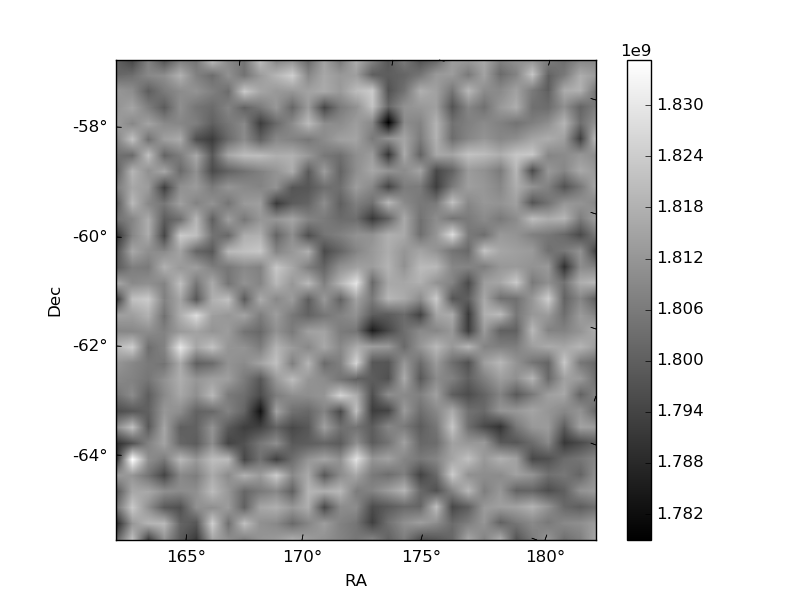
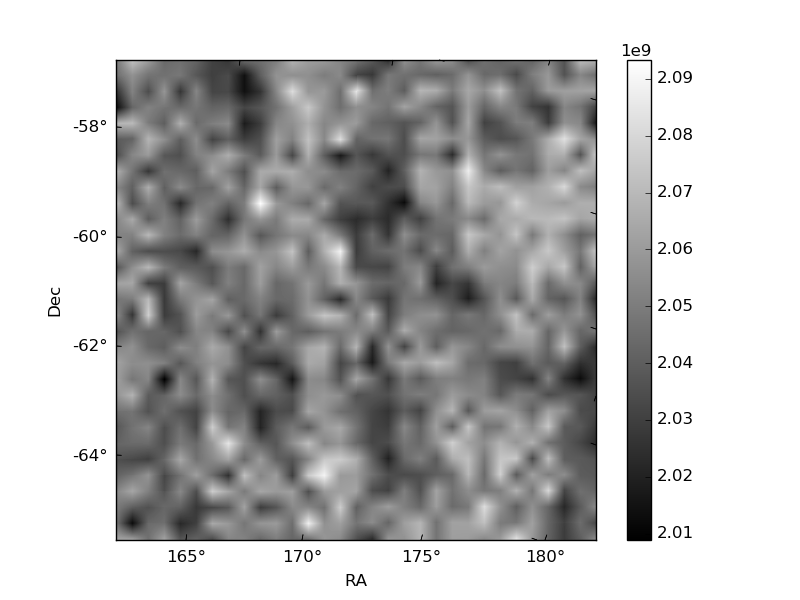
Histogram calculated using DETX and DETY for each event in the final _common_clean file
| Quadrant A | 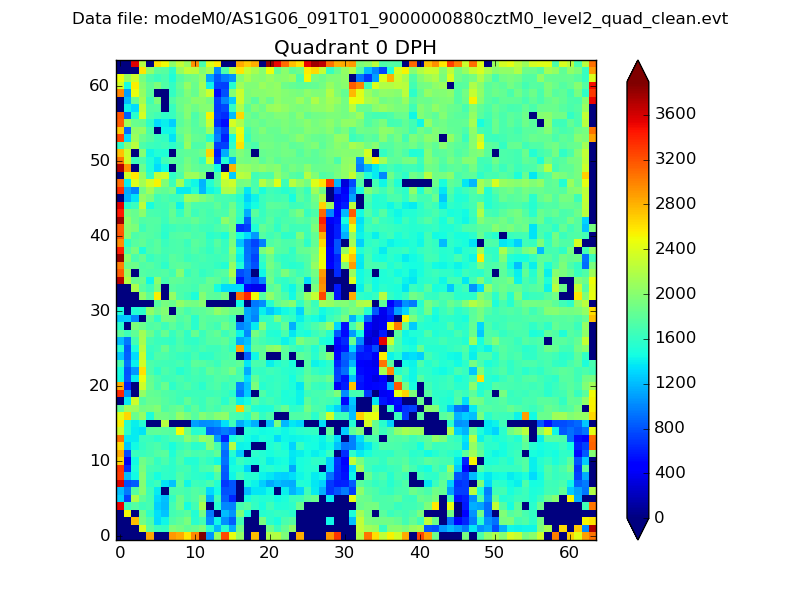 |
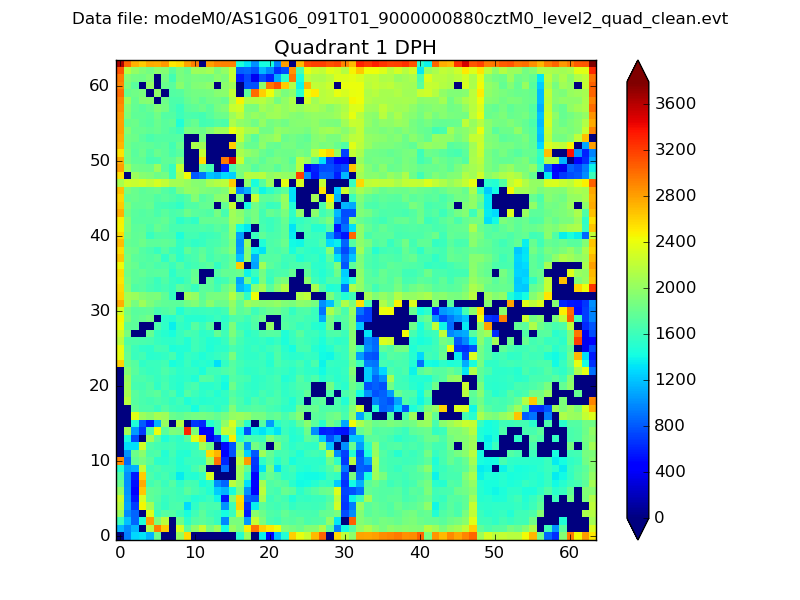 |
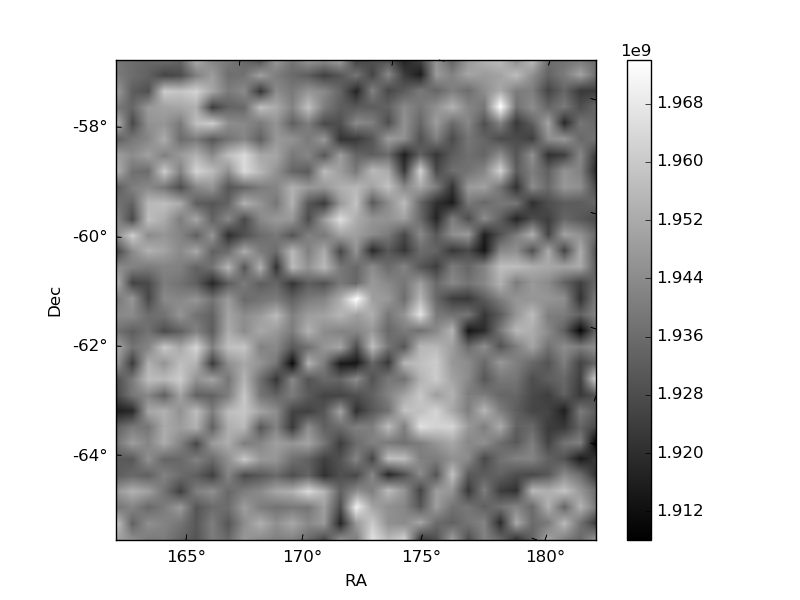
Quadrant B |
|---|---|---|---|
| Quadrant D | 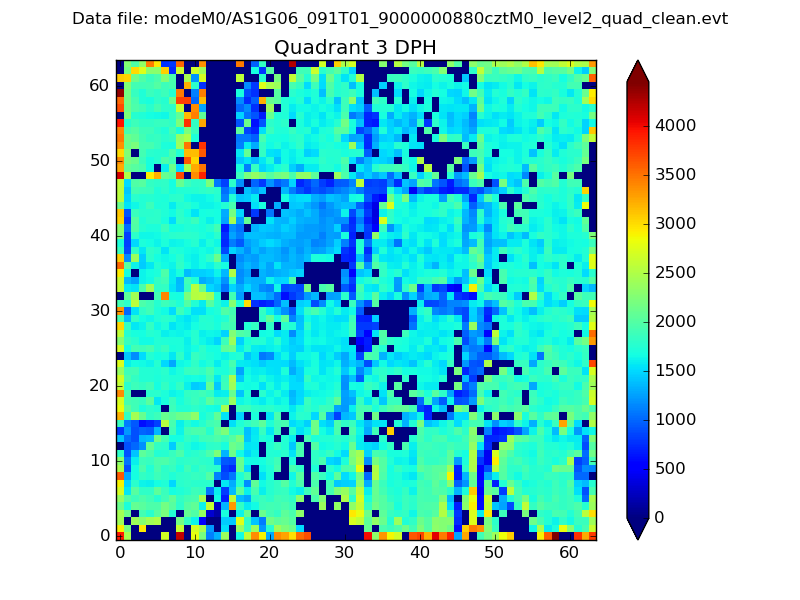 |
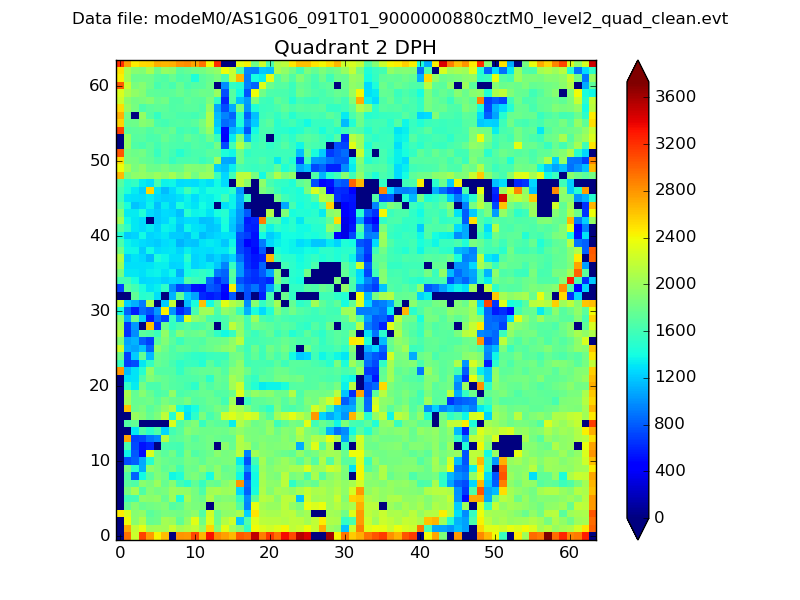 |
Quadrant C |
| Plot type | Count rate plots | Images |
|---|---|---|
| Comparison with Poisson distribution Blue bars denote a histogram of data divided into 1 sec bins. Red curve is a Poisson curve with rate = median count rate of data. |
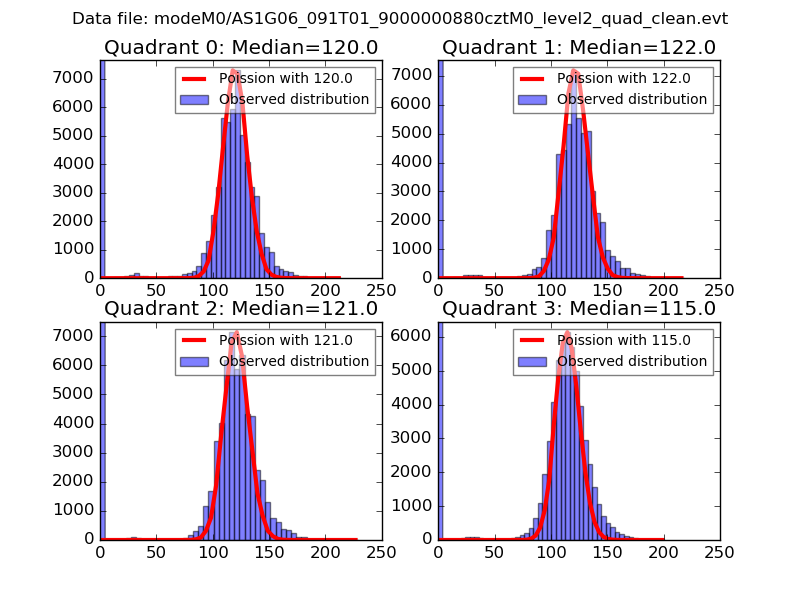 |
 |
| Quadrant-wise count rates Data is divided into 100 sec bins |
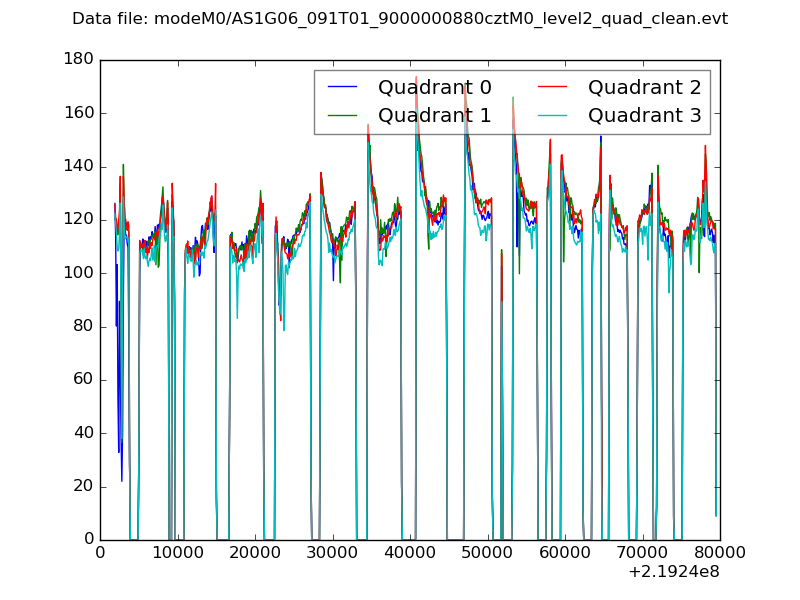 |
|
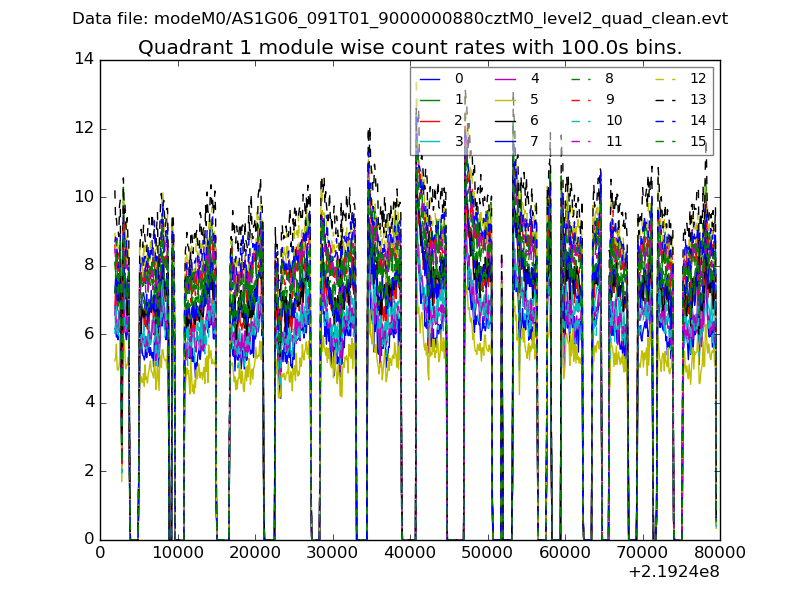
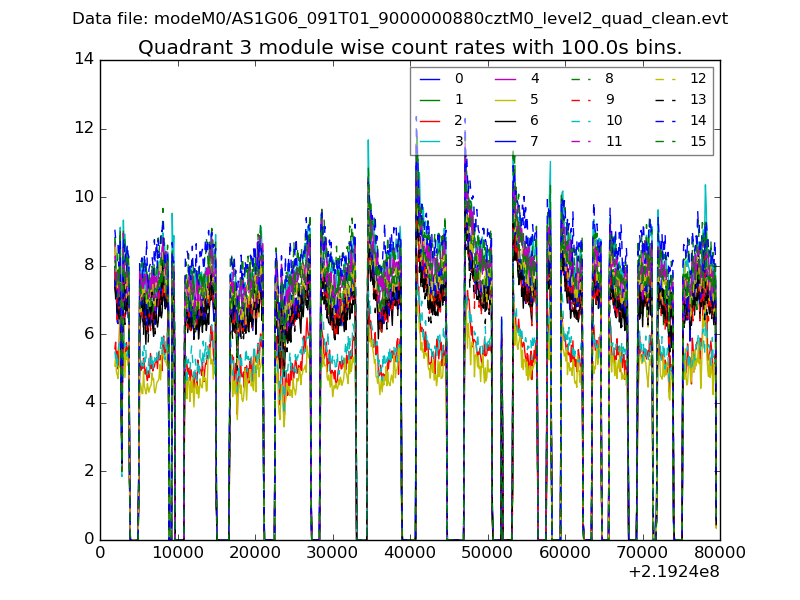
| Module-wise count rates for Quadrant A Data is divided into 100 sec bins |
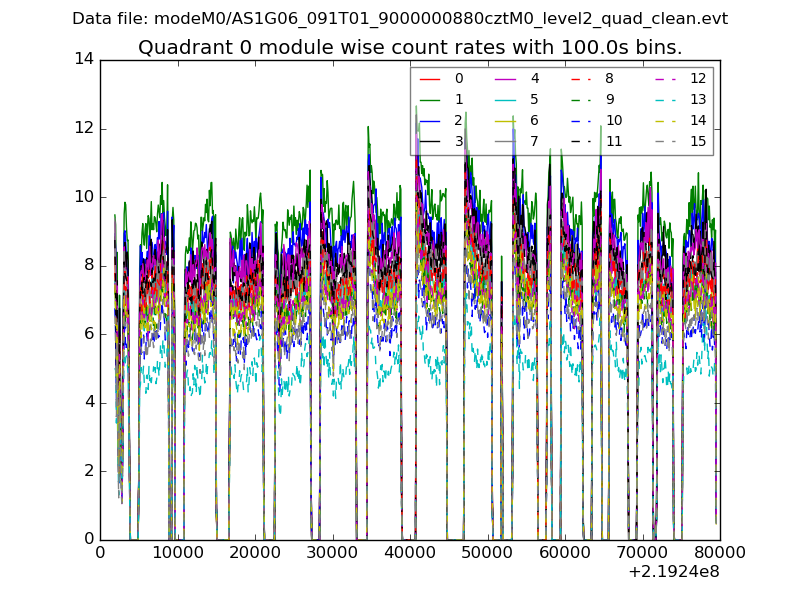 |
 |
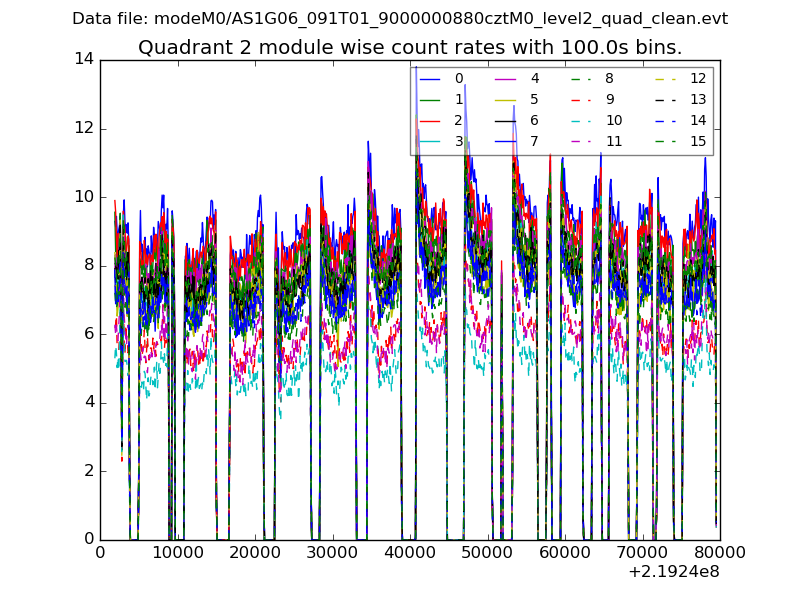
| Module-wise count rates for Quadrant B Data is divided into 100 sec bins |
 |
 |
| Module-wise count rates for Quadrant C Data is divided into 100 sec bins |
 |
 |
| Module-wise count rates for Quadrant D Data is divided into 100 sec bins |
 |
 |
| Parameter | Plot |
|---|---|
| CZT HV Monitor | 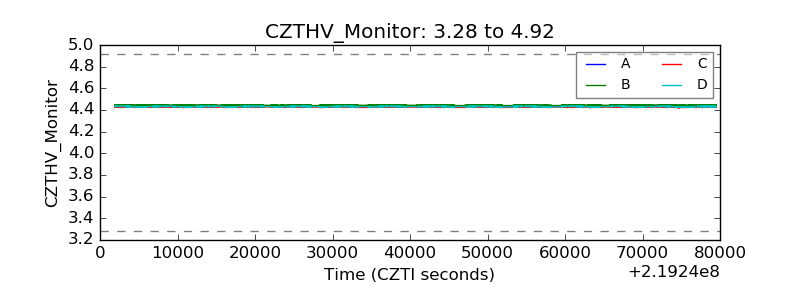 |
| D_VDD | 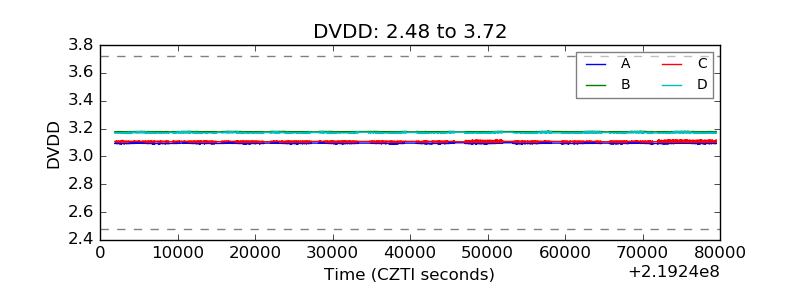 |
| Temperature 1 | 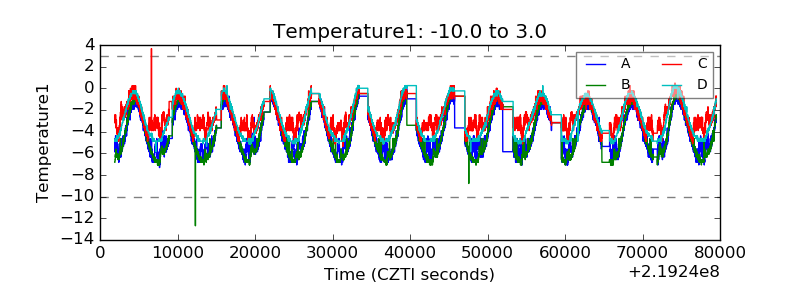 |
| Veto HV Monitor | 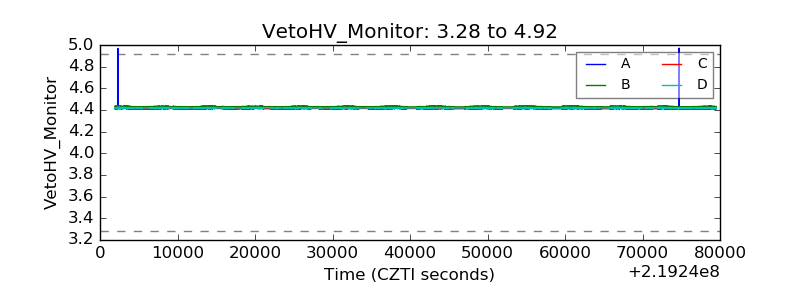 |
| Veto LLD | 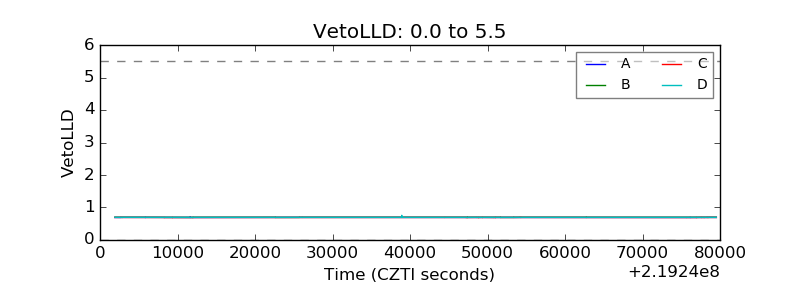 |
| Alpha Counter | 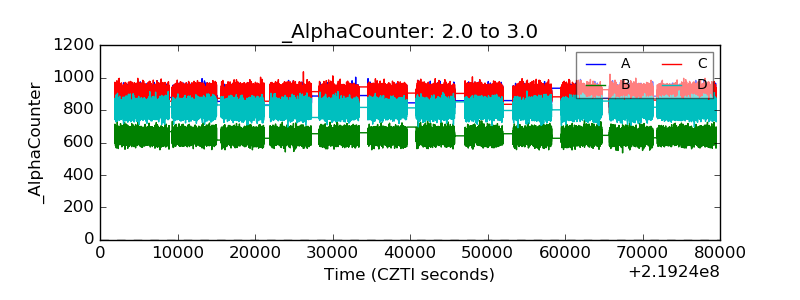 |
| _CPM_Rate | 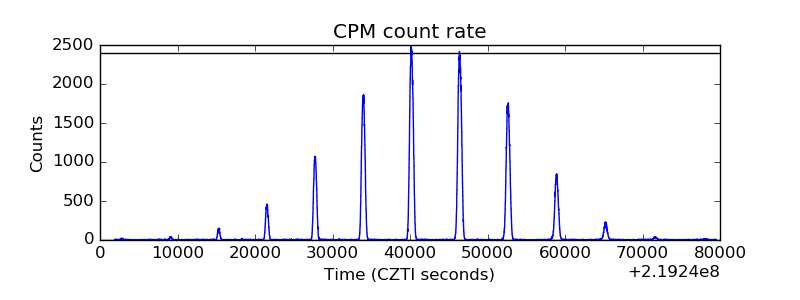 |
| CZT Counter | 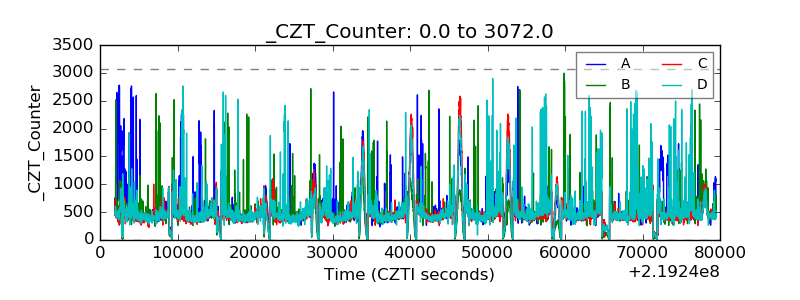 |
| +2.5 Volts monitor | 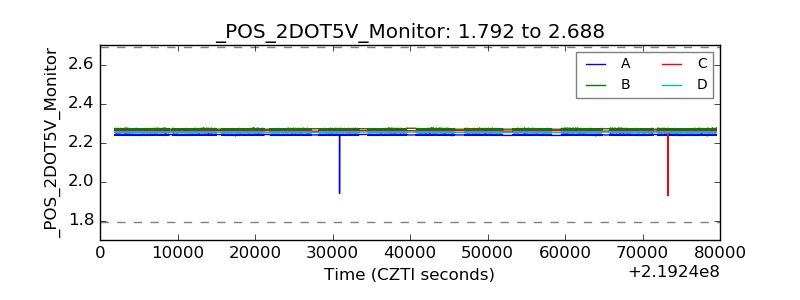 |
| +5 Volts monitor | 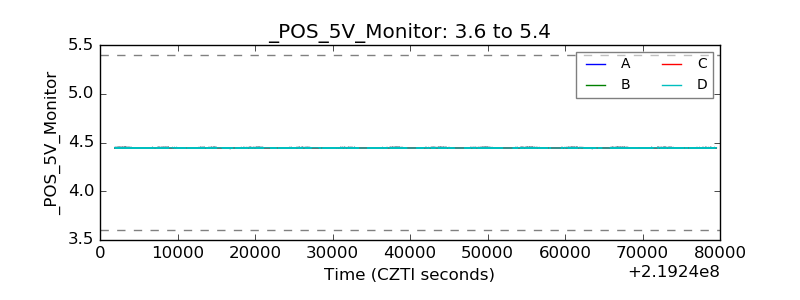 |
| _ROLL_ROT | 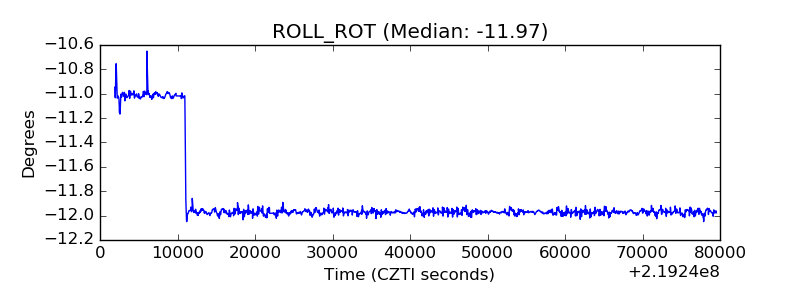 |
| _Roll_DEC | 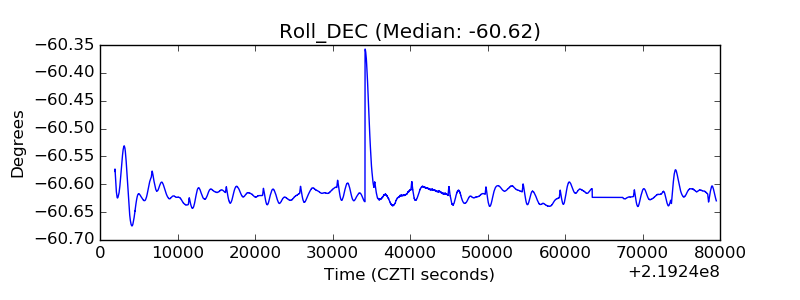 |
| _Roll_RA | 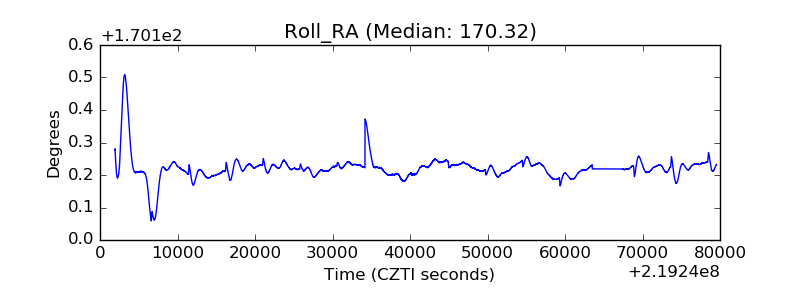 |
| Veto Counter | 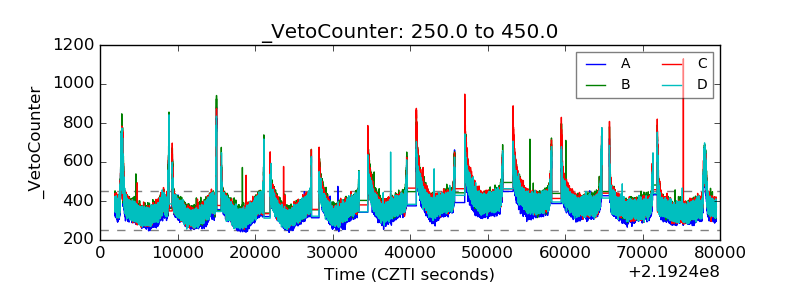 |