| Param | Original file | Final file |
|---|---|---|
| Filename | modeM0/AS1G06_091T01_9000000880_06536cztM0_level2.evt | modeM0/AS1G06_091T01_9000000880_06536cztM0_level2_quad_clean.evt |
| Size (bytes) | 1,365,641,280 | 270,728,640 |
| Size | 1.3 GB | 258.2 MB |
| Events in quadrant A | 11,895,214 | 1,700,178 |
| Events in quadrant B | 9,951,335 | 1,754,062 |
| Events in quadrant C | 8,447,224 | 1,750,077 |
| Events in quadrant D | 9,767,901 | 1,674,773 |
| Mode M0 | |||
|---|---|---|---|
| Quadrant | BADHDUFLAG | Total packets | Discarded packets |
| A | 0 | 50005 | 1323 |
| B | 0 | 43613 | 1084 |
| C | 0 | 40303 | 834 |
| D | 0 | 44021 | 1231 |
| Mode M9 | |||
|---|---|---|---|
| Quadrant | BADHDUFLAG | Total packets | Discarded packets |
| A | 0 | 20 | 0 |
| B | 0 | 20 | 1 |
| C | 0 | 20 | 0 |
| D | 0 | 20 | 0 |
| Mode SS | |||
|---|---|---|---|
| Quadrant | BADHDUFLAG | Total packets | Discarded packets |
| A | 0 | 400 | 8 |
| B | 0 | 400 | 10 |
| C | 0 | 400 | 4 |
| D | 0 | 400 | 4 |
| Quadrant | Total seconds | Saturated seconds | Saturation percentage |
|---|---|---|---|
| A | 19140 | 1338 | 6.990596% |
| B | 19152 | 614 | 3.205931% |
| C | 19182 | 280 | 1.459702% |
| D | 19141 | 550 | 2.873413% |
Noise dominated data is calculated using 1-second bins in cleaned event files. If a bin has >2000 counts, and if more than 50% of those come from <1% of pixels, then it is considered to be noise-dominated and hence unusable.
| Quadrant | # 1 sec bins | Bins with >0 counts | Bins with >2000 counts | High rate bins dominated by noise | Noise dominated (total time) | Noise dominated (detector-on time) | Marked lightcurve |
|---|---|---|---|---|---|---|---|
| A | 21543 | 19551 | 560 | 560 | 2.60% | 2.86% | 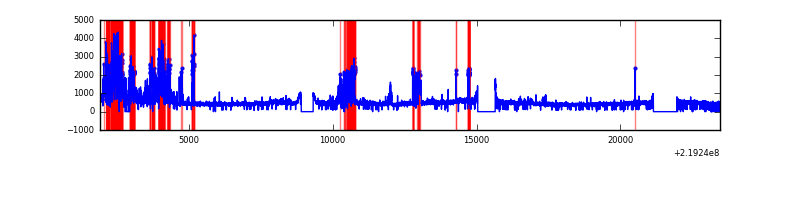 |
| B | 21543 | 19547 | 116 | 116 | 0.54% | 0.59% | 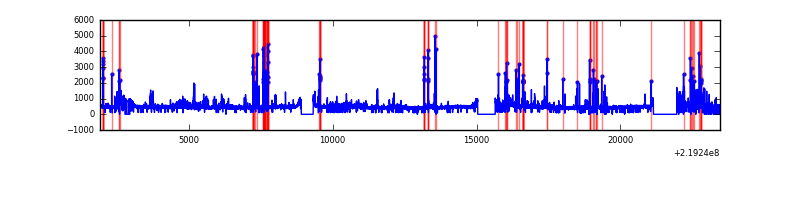 |
| C | 21541 | 19550 | 0 | 0 | 0.00% | 0.00% | 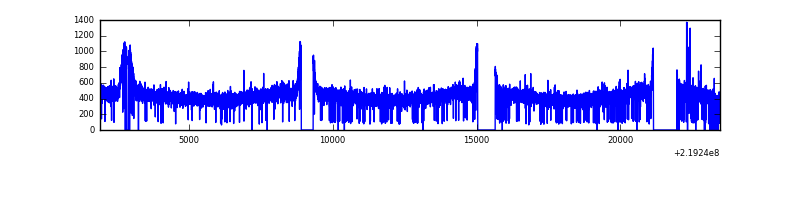 |
| D | 21543 | 19545 | 170 | 170 | 0.79% | 0.87% | 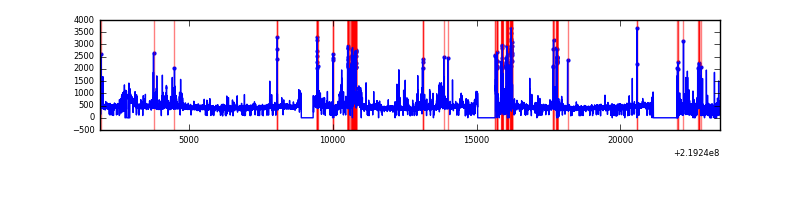 |
Top three noisy pixels from each quadrant. If the there are fewer than three noisy pixels in the level2.evt file, extra rows are filled as -1
| Pixel properties | Quadrant properties | ||||||
|---|---|---|---|---|---|---|---|
| Quadrant | DetID | PixID | Counts | Sigma | Mean | Median | Sigma |
| A | 15 | 236 | 3514688 | 8081.44 | 2134 | 2083 | 434.7 |
| A | 8 | 15 | 85404 | 191.7 | 2134 | 2083 | 434.7 |
| A | 15 | 174 | 54665 | 120.98 | 2134 | 2083 | 434.7 |
| B | 4 | 170 | 456915 | 1084.83 | 2205 | 2146 | 419.2 |
| B | 0 | 219 | 252208 | 596.51 | 2205 | 2146 | 419.2 |
| B | 4 | 48 | 178630 | 420.99 | 2205 | 2146 | 419.2 |
| C | 1 | 16 | 53038 | 102.06 | 2150 | 2156 | 498.5 |
| C | 13 | 61 | 17233 | 30.24 | 2150 | 2156 | 498.5 |
| C | 12 | 4 | 7055 | 9.83 | 2150 | 2156 | 498.5 |
| D | 2 | 63 | 461040 | 880.56 | 2135 | 2069 | 521.2 |
| D | 2 | 33 | 411063 | 784.68 | 2135 | 2069 | 521.2 |
| D | 2 | 152 | 237039 | 450.8 | 2135 | 2069 | 521.2 |
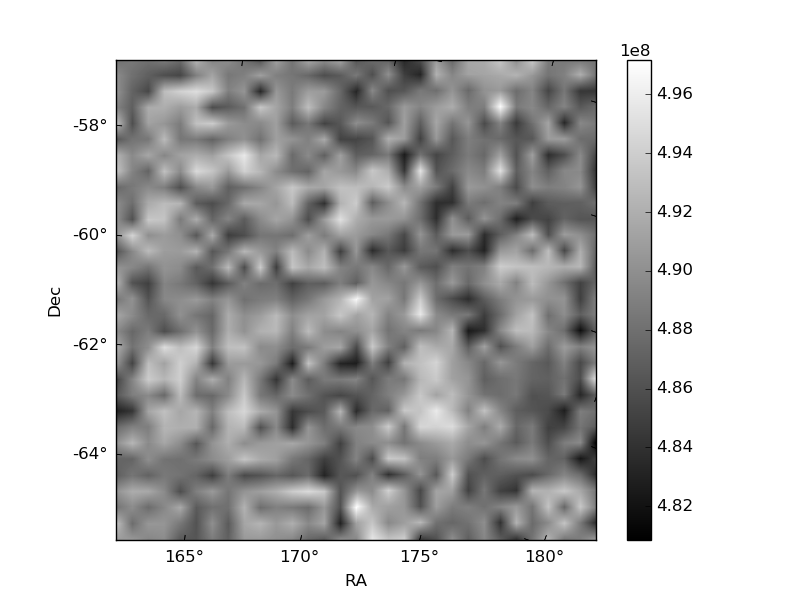
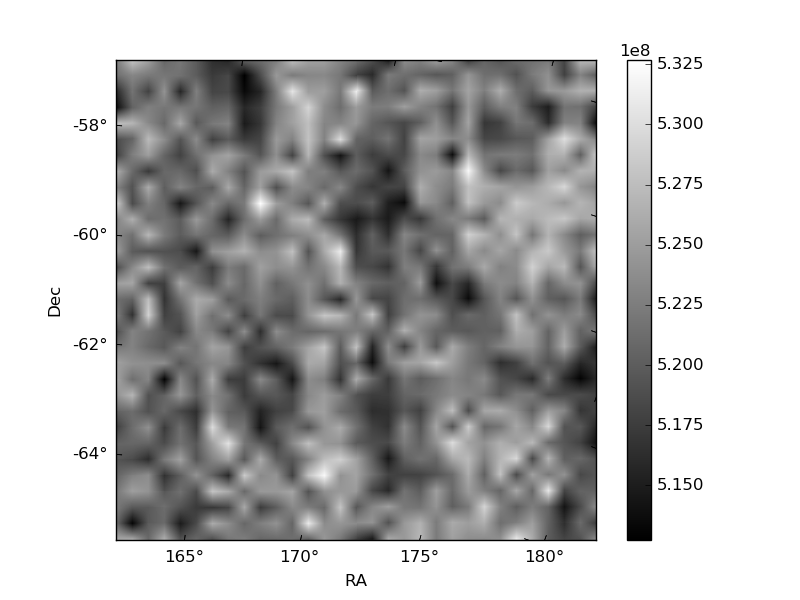
Histogram calculated using DETX and DETY for each event in the final _common_clean file
| Quadrant A | 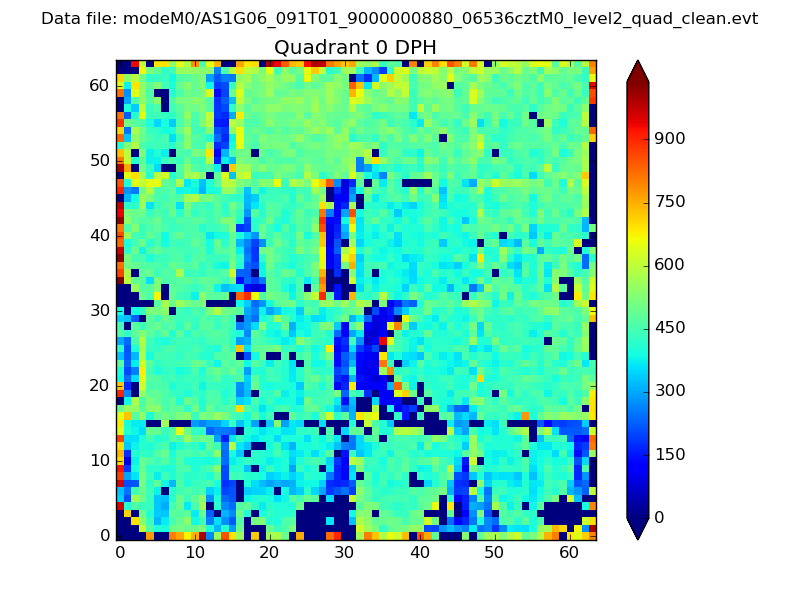 |
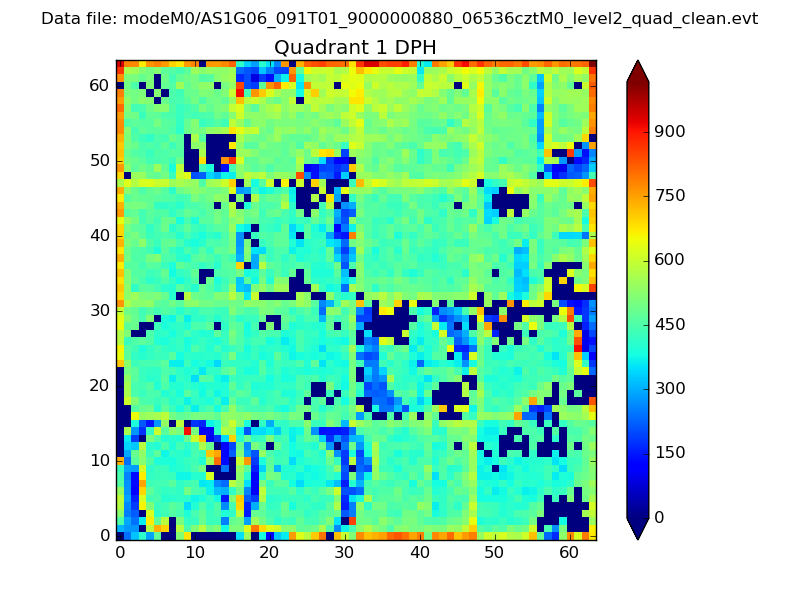 |
Quadrant B |
|---|---|---|---|
| Quadrant D | 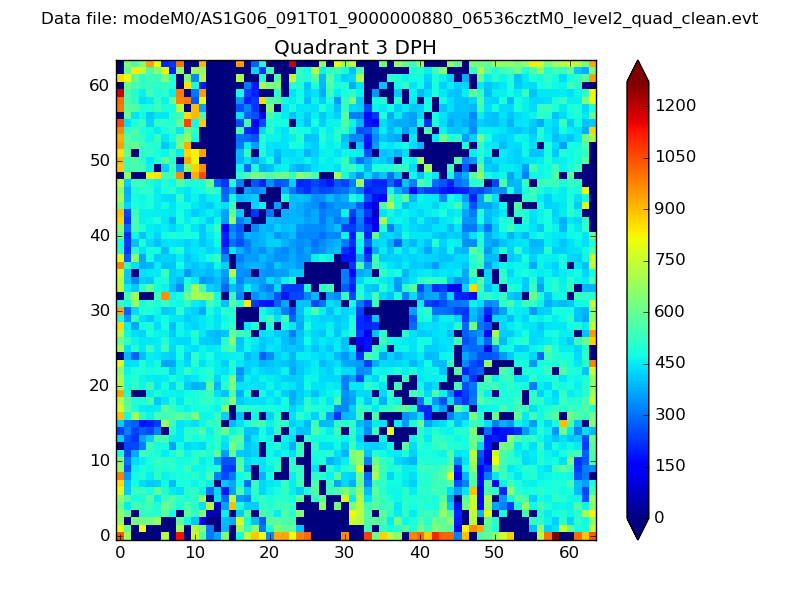 |
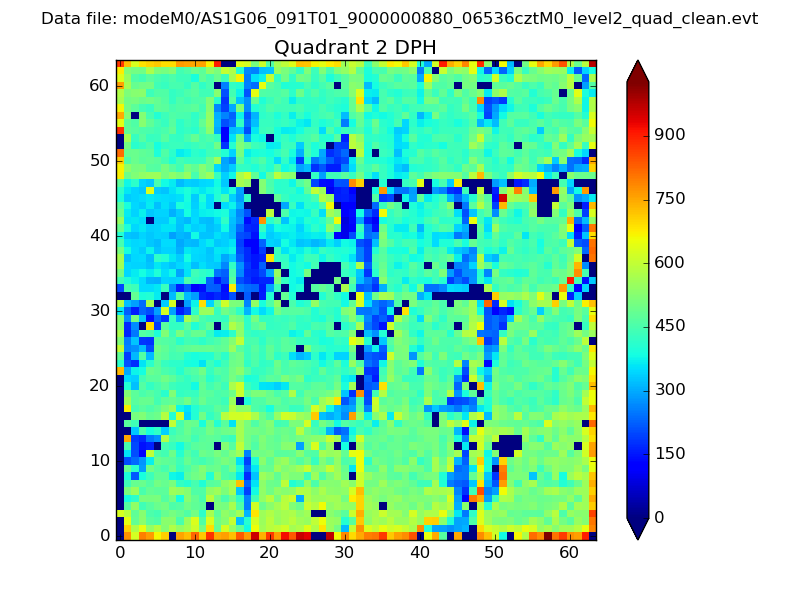 |
Quadrant C |
| Plot type | Count rate plots | Images |
|---|---|---|
| Comparison with Poisson distribution Blue bars denote a histogram of data divided into 1 sec bins. Red curve is a Poisson curve with rate = median count rate of data. |
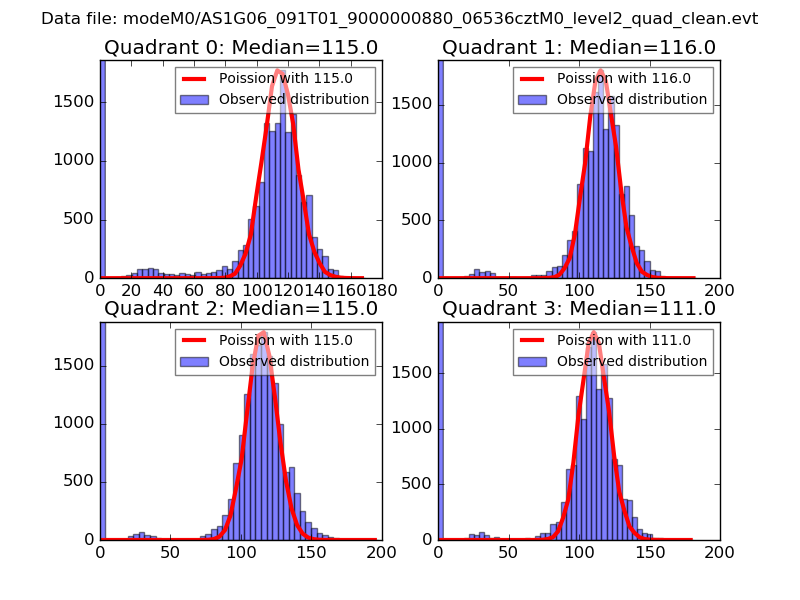 |
 |
| Quadrant-wise count rates Data is divided into 100 sec bins |
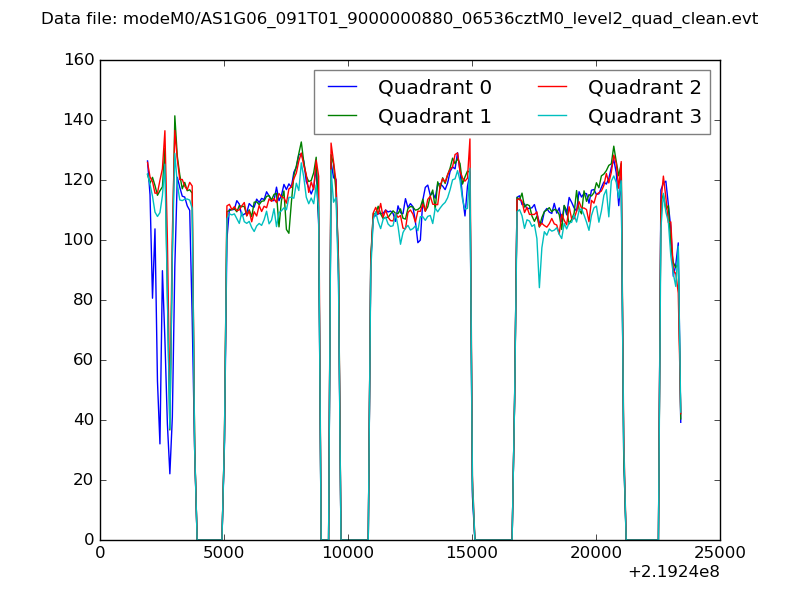 |
|
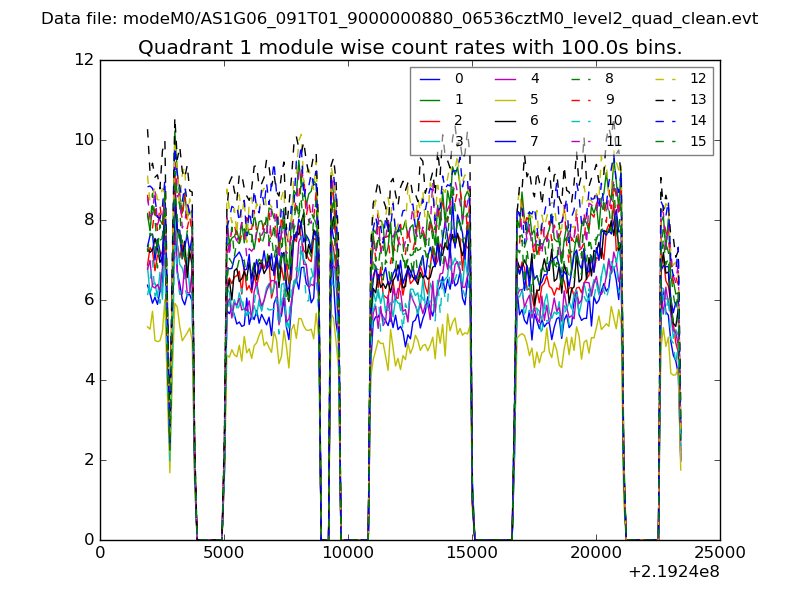
| Module-wise count rates for Quadrant A Data is divided into 100 sec bins |
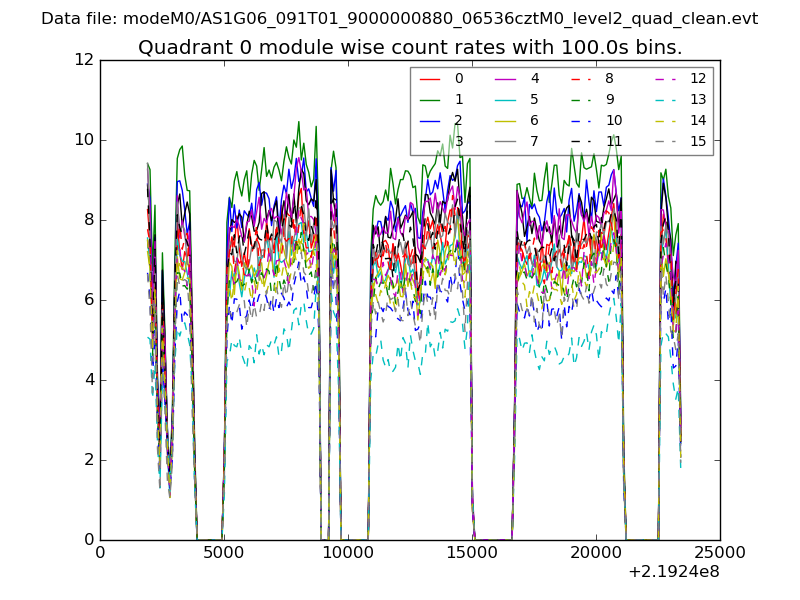 |
 |
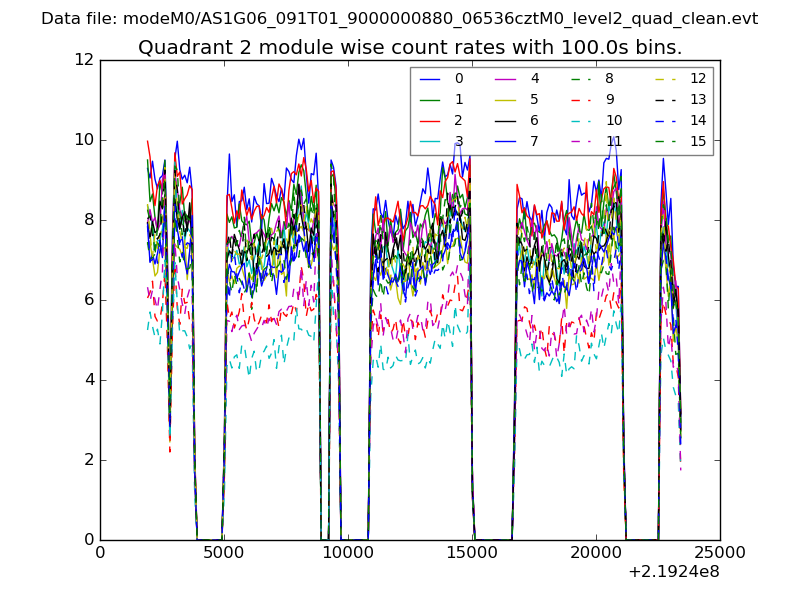
| Module-wise count rates for Quadrant B Data is divided into 100 sec bins |
 |
 |
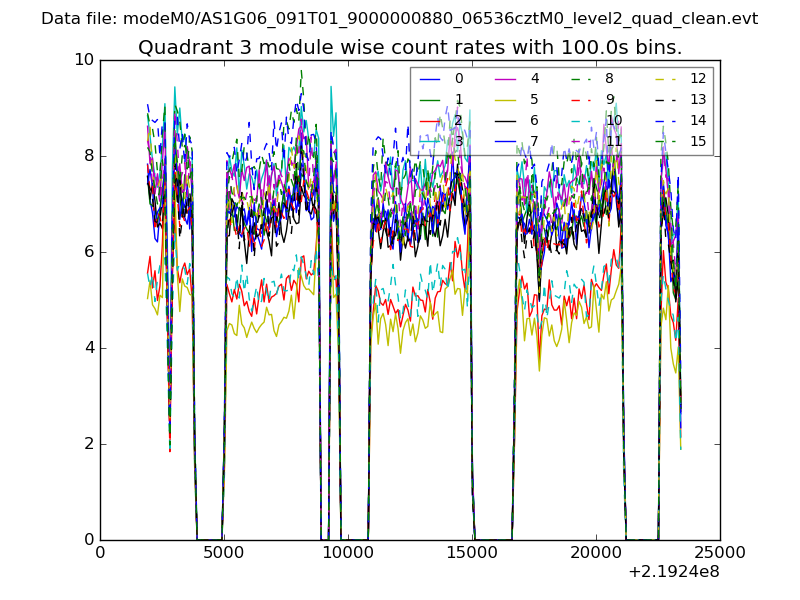
| Module-wise count rates for Quadrant C Data is divided into 100 sec bins |
 |
 |
| Module-wise count rates for Quadrant D Data is divided into 100 sec bins |
 |
 |
| Parameter | Plot |
|---|---|
| CZT HV Monitor | 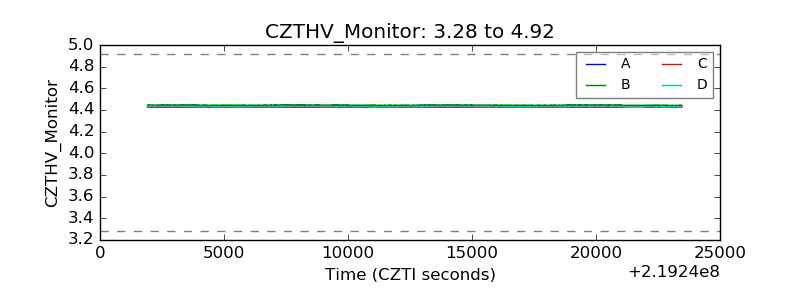 |
| D_VDD |  |
| Temperature 1 | 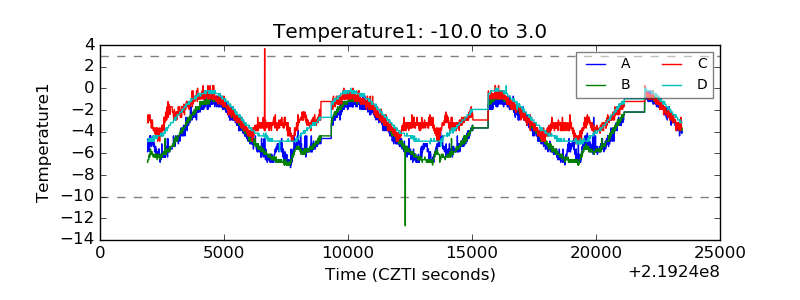 |
| Veto HV Monitor | 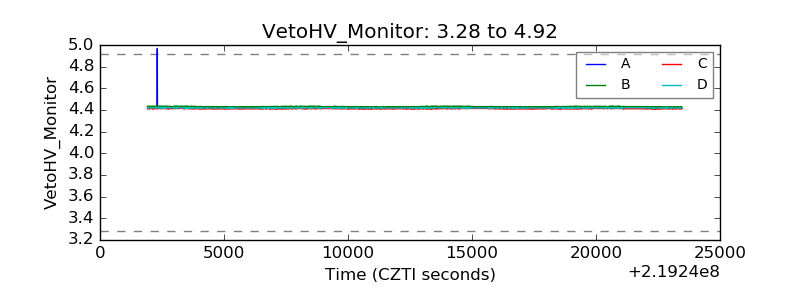 |
| Veto LLD |  |
| Alpha Counter | 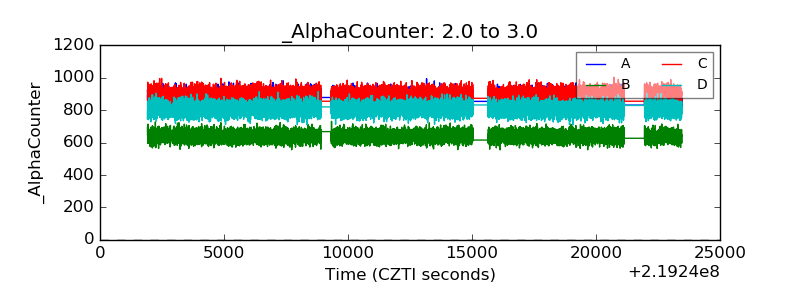 |
| _CPM_Rate | 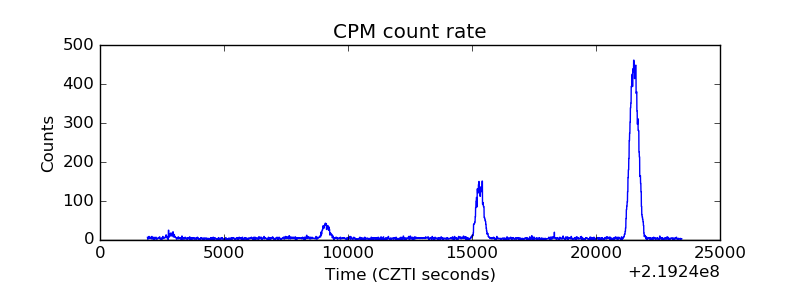 |
| CZT Counter | 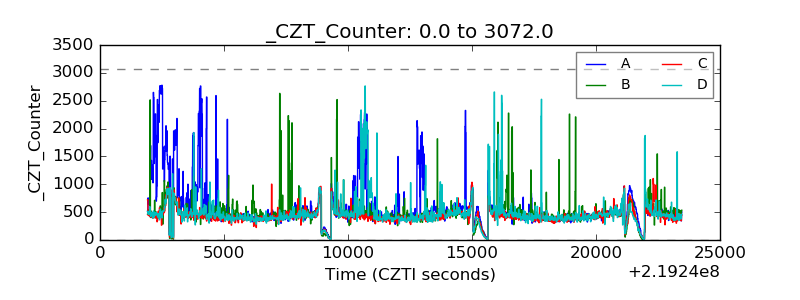 |
| +2.5 Volts monitor |  |
| +5 Volts monitor |  |
| _ROLL_ROT | 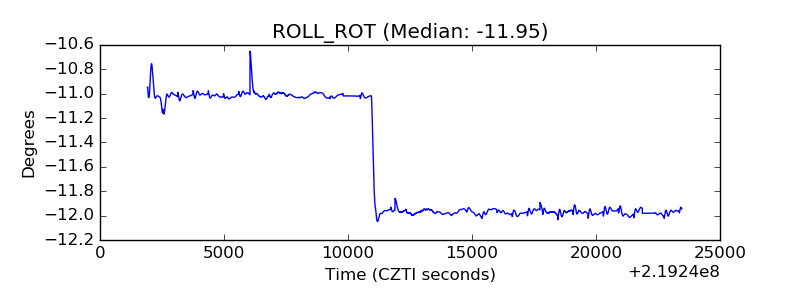 |
| _Roll_DEC | 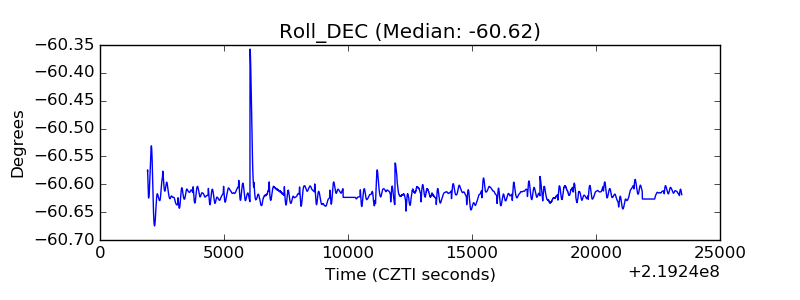 |
| _Roll_RA |  |
| Veto Counter | 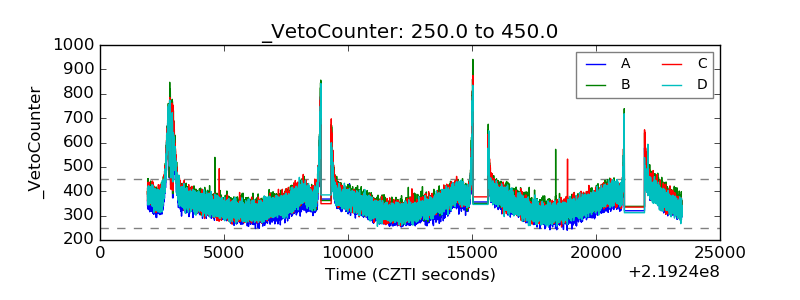 |