| Param | Original file | Final file |
|---|---|---|
| Filename | modeM0/AS1G06_091T01_9000000880_06537cztM0_level2.evt | modeM0/AS1G06_091T01_9000000880_06537cztM0_level2_quad_clean.evt |
| Size (bytes) | 408,326,400 | 102,456,000 |
| Size | 389.4 MB | 97.7 MB |
| Events in quadrant A | 2,831,018 | 677,821 |
| Events in quadrant B | 3,156,965 | 681,085 |
| Events in quadrant C | 2,676,057 | 672,047 |
| Events in quadrant D | 3,279,699 | 638,733 |
| Mode M0 | |||
|---|---|---|---|
| Quadrant | BADHDUFLAG | Total packets | Discarded packets |
| A | 0 | 12781 | 2 |
| B | 0 | 13600 | 1 |
| C | 0 | 12577 | 1 |
| D | 0 | 14172 | 1 |
| Mode M9 | |||
|---|---|---|---|
| Quadrant | BADHDUFLAG | Total packets | Discarded packets |
| A | 0 | 10 | 0 |
| B | 0 | 10 | 0 |
| C | 0 | 10 | 0 |
| D | 0 | 10 | 0 |
| Mode SS | |||
|---|---|---|---|
| Quadrant | BADHDUFLAG | Total packets | Discarded packets |
| A | 0 | 126 | 0 |
| B | 0 | 126 | 0 |
| C | 0 | 126 | 0 |
| D | 0 | 126 | 0 |
| Quadrant | Total seconds | Saturated seconds | Saturation percentage |
|---|---|---|---|
| A | 6208 | 47 | 0.757088% |
| B | 6208 | 90 | 1.449742% |
| C | 6208 | 14 | 0.225515% |
| D | 6208 | 120 | 1.932990% |
Noise dominated data is calculated using 1-second bins in cleaned event files. If a bin has >2000 counts, and if more than 50% of those come from <1% of pixels, then it is considered to be noise-dominated and hence unusable.
| Quadrant | # 1 sec bins | Bins with >0 counts | Bins with >2000 counts | High rate bins dominated by noise | Noise dominated (total time) | Noise dominated (detector-on time) | Marked lightcurve |
|---|---|---|---|---|---|---|---|
| A | 7198 | 6209 | 13 | 13 | 0.18% | 0.21% | 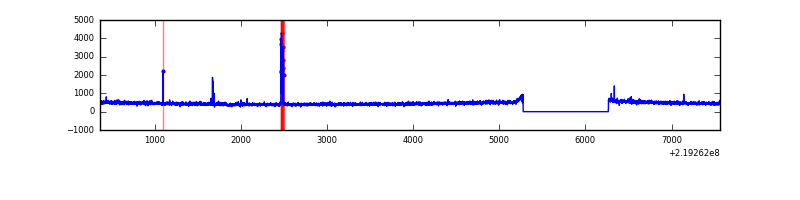 |
| B | 7198 | 6209 | 31 | 31 | 0.43% | 0.50% | 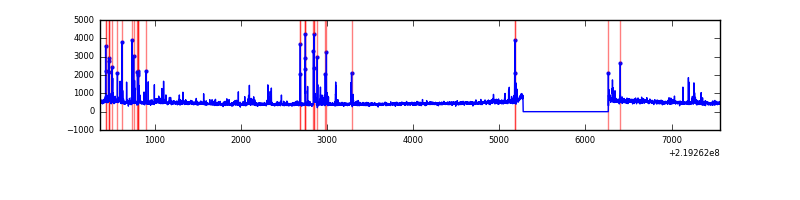 |
| C | 7198 | 6209 | 0 | 0 | 0.00% | 0.00% | 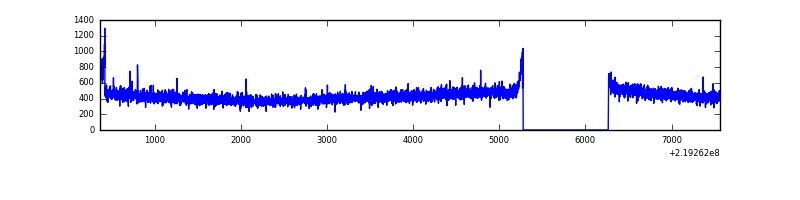 |
| D | 7198 | 6209 | 95 | 95 | 1.32% | 1.53% | 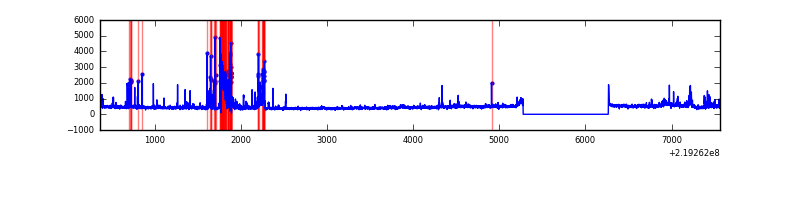 |
Top three noisy pixels from each quadrant. If the there are fewer than three noisy pixels in the level2.evt file, extra rows are filled as -1
| Pixel properties | Quadrant properties | ||||||
|---|---|---|---|---|---|---|---|
| Quadrant | DetID | PixID | Counts | Sigma | Mean | Median | Sigma |
| A | 13 | 251 | 61200 | 416.51 | 704 | 690 | 145.3 |
| A | 8 | 15 | 33520 | 225.98 | 704 | 690 | 145.3 |
| A | 15 | 174 | 10446 | 67.15 | 704 | 690 | 145.3 |
| B | 4 | 170 | 142191 | 1041.46 | 708 | 691 | 135.9 |
| B | 0 | 219 | 126371 | 925.02 | 708 | 691 | 135.9 |
| B | 15 | 204 | 42315 | 306.36 | 708 | 691 | 135.9 |
| C | 1 | 16 | 22806 | 140.42 | 679 | 682 | 157.6 |
| C | 13 | 61 | 5580 | 31.09 | 679 | 682 | 157.6 |
| C | 12 | 4 | 2698 | 12.8 | 679 | 682 | 157.6 |
| D | 2 | 33 | 341735 | 2030.77 | 673 | 651 | 168.0 |
| D | 2 | 152 | 130537 | 773.33 | 673 | 651 | 168.0 |
| D | 13 | 105 | 104377 | 617.57 | 673 | 651 | 168.0 |
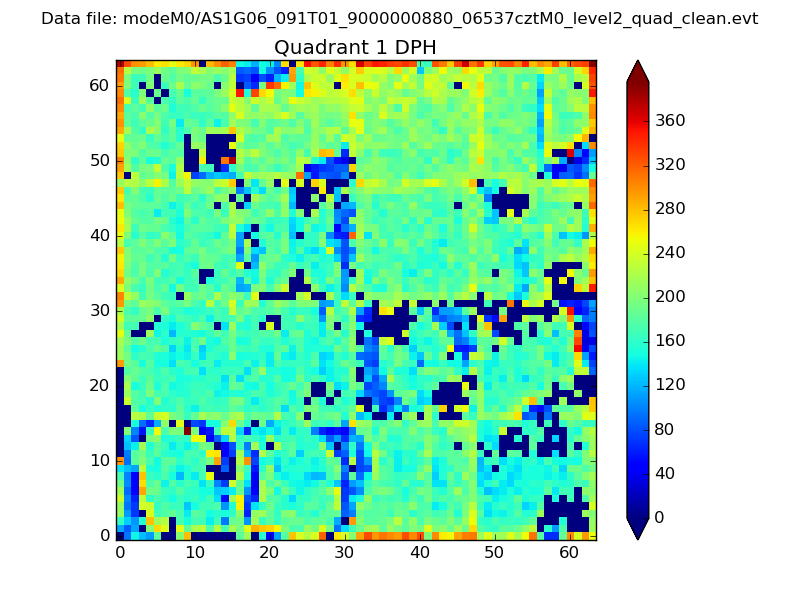
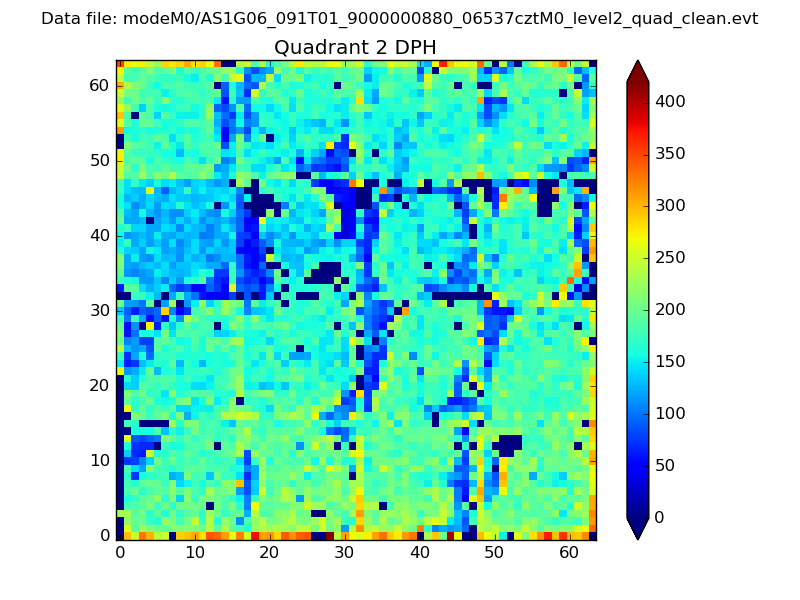
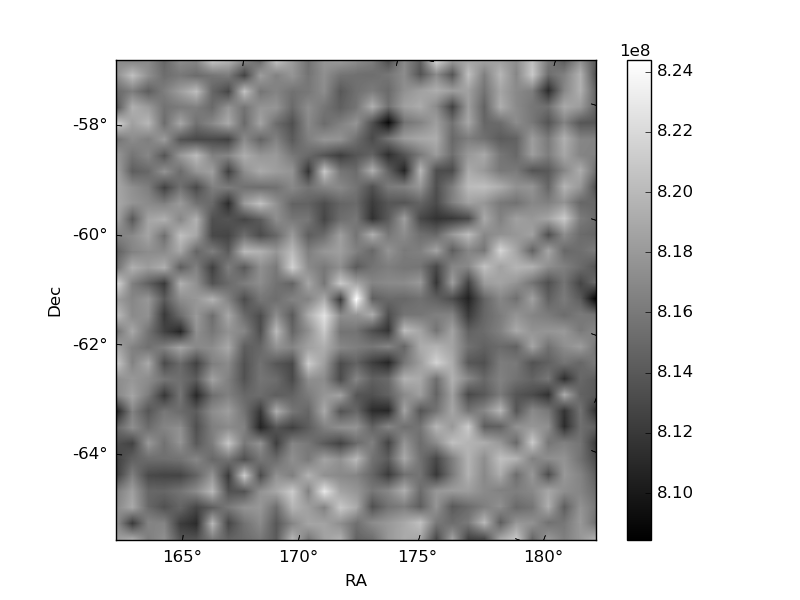
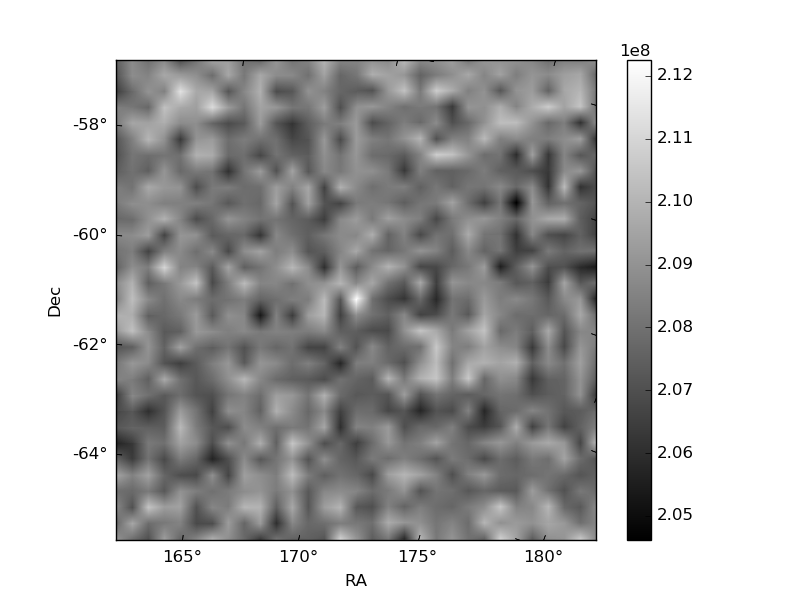
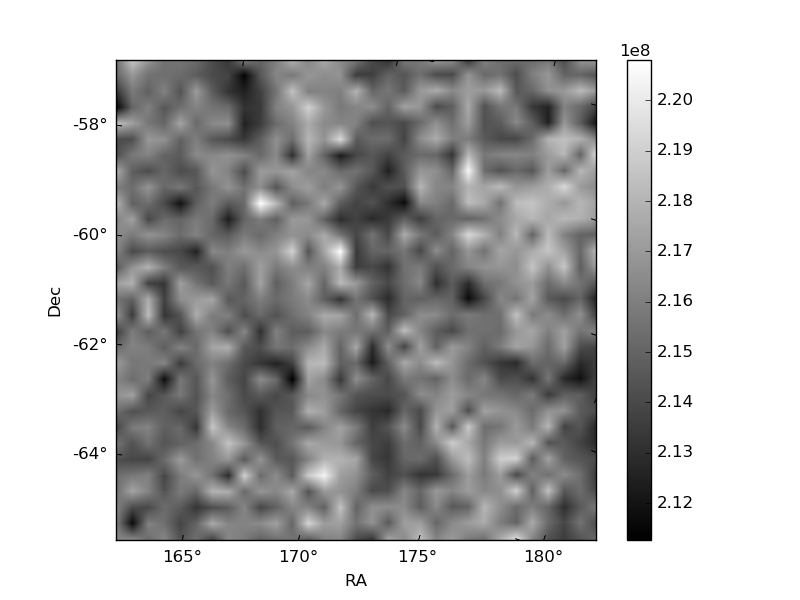
Histogram calculated using DETX and DETY for each event in the final _common_clean file
| Quadrant A |  |
 |
Quadrant B |
|---|---|---|---|
| Quadrant D | 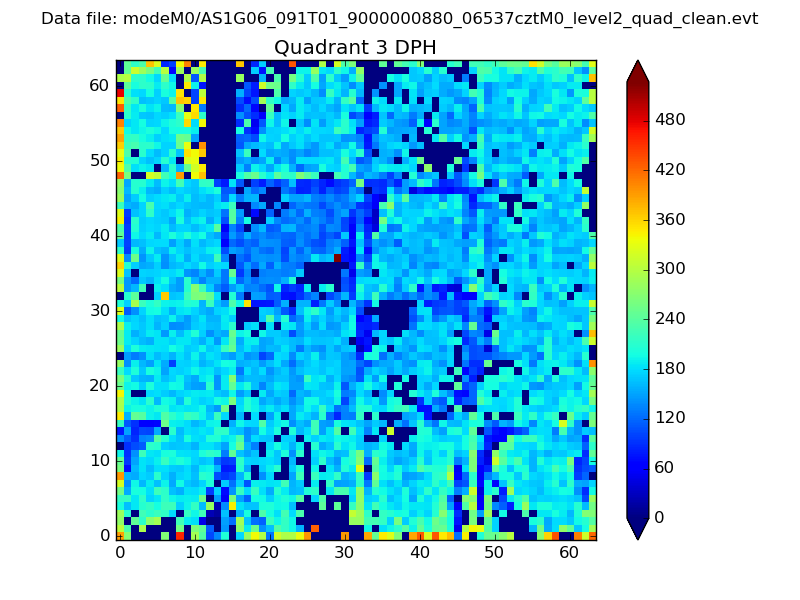 |
 |
Quadrant C |
| Plot type | Count rate plots | Images |
|---|---|---|
| Comparison with Poisson distribution Blue bars denote a histogram of data divided into 1 sec bins. Red curve is a Poisson curve with rate = median count rate of data. |
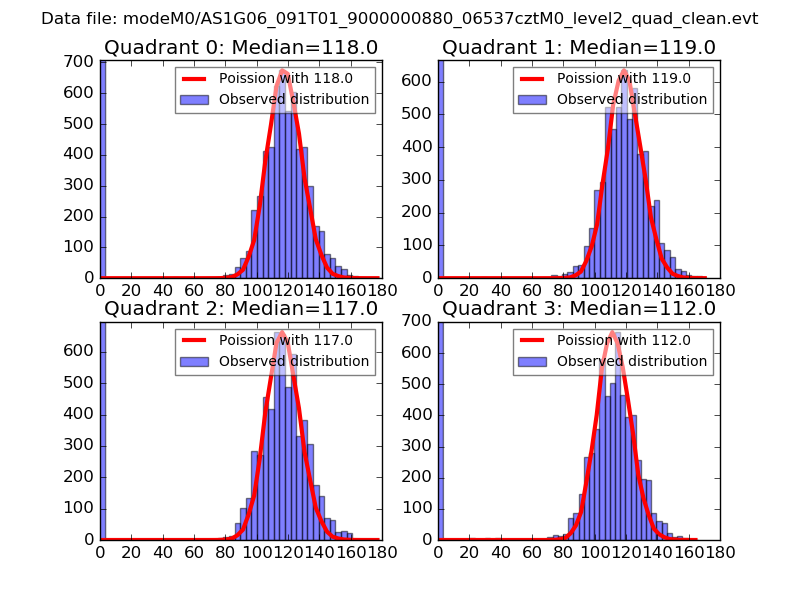 |
 |
| Quadrant-wise count rates Data is divided into 100 sec bins |
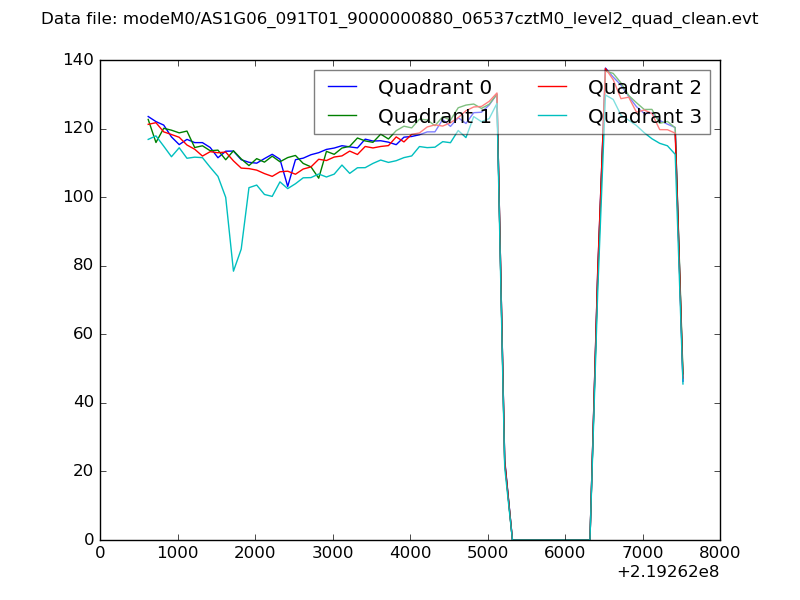 |
|
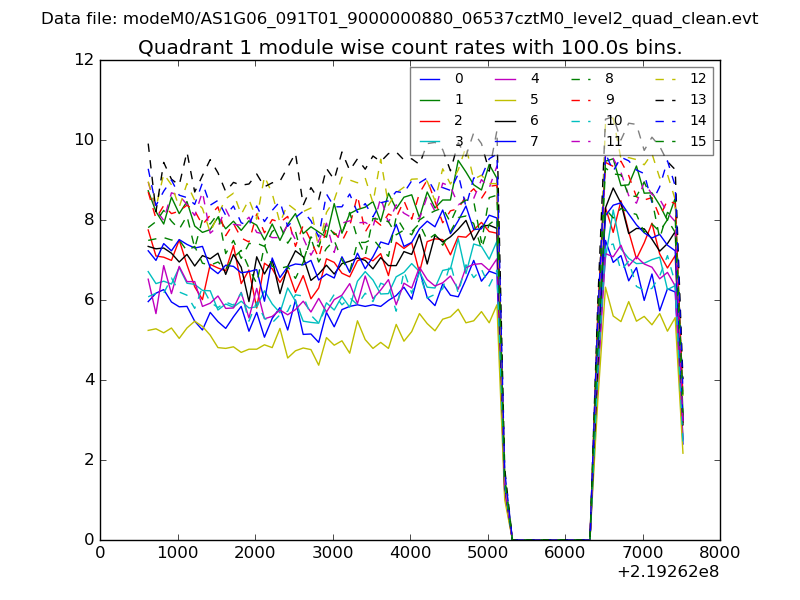
| Module-wise count rates for Quadrant A Data is divided into 100 sec bins |
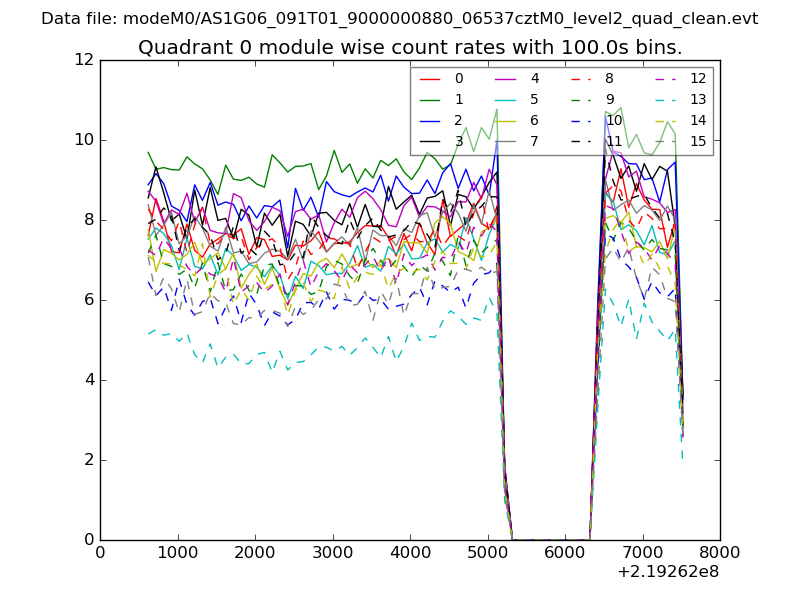 |
 |
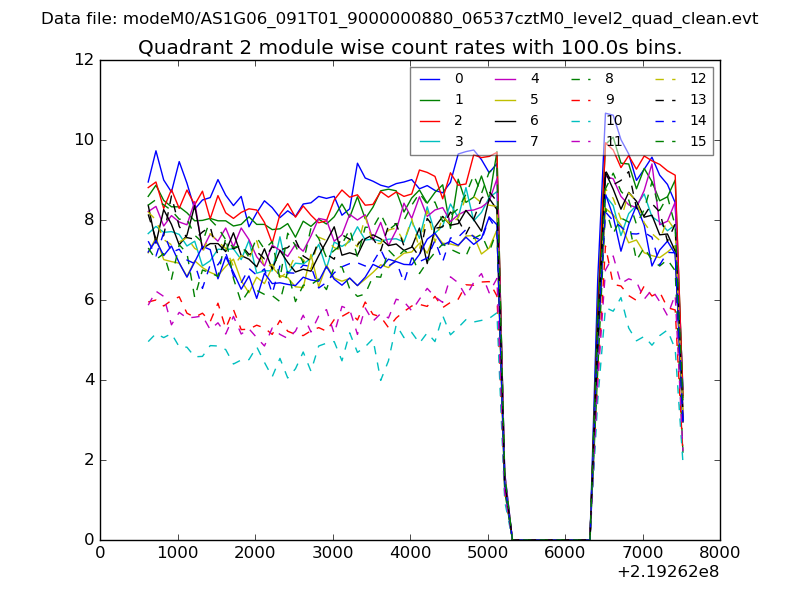
| Module-wise count rates for Quadrant B Data is divided into 100 sec bins |
 |
 |
| Module-wise count rates for Quadrant C Data is divided into 100 sec bins |
 |
 |
| Module-wise count rates for Quadrant D Data is divided into 100 sec bins |
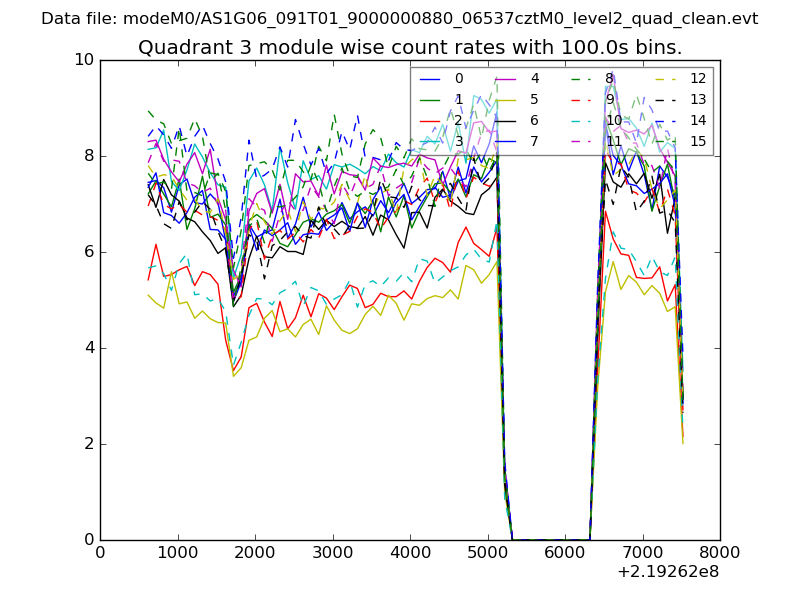 |
 |
| Parameter | Plot |
|---|---|
| CZT HV Monitor | 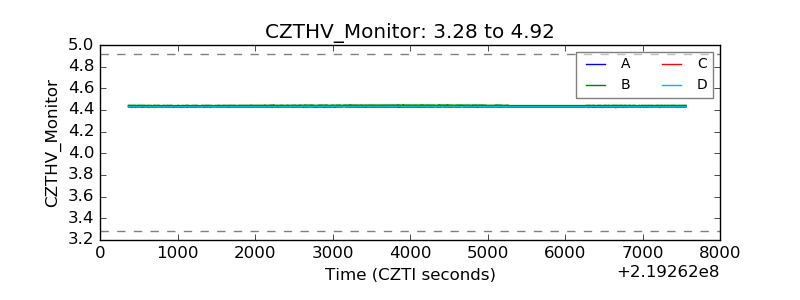 |
| D_VDD | 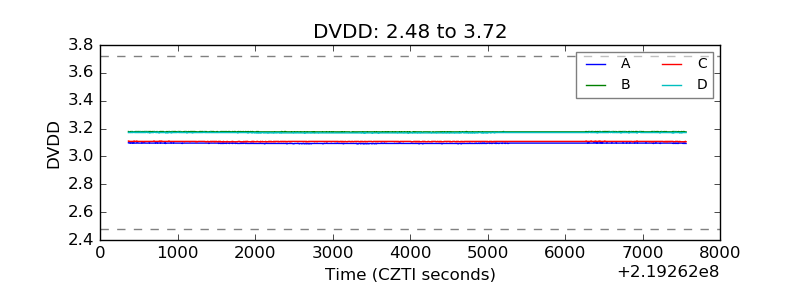 |
| Temperature 1 | 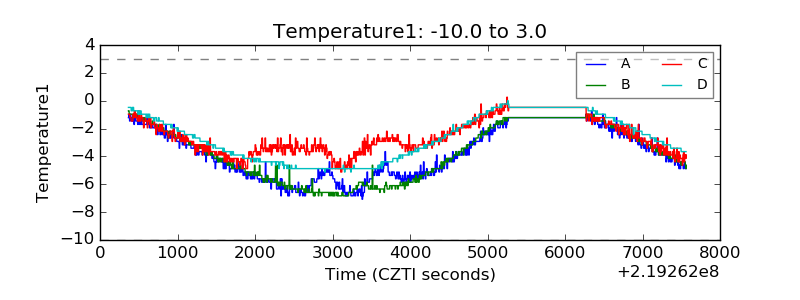 |
| Veto HV Monitor | 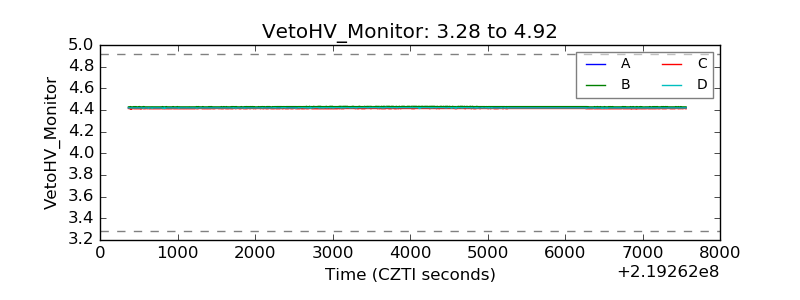 |
| Veto LLD | 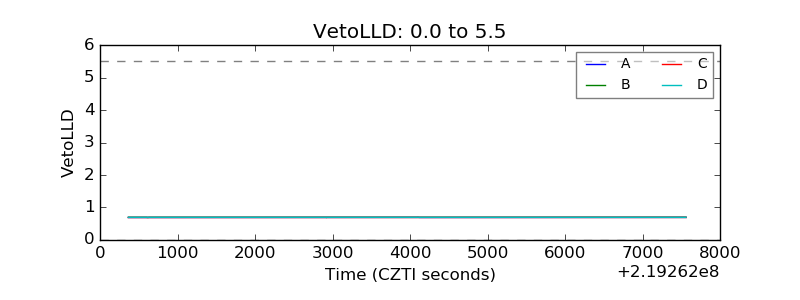 |
| Alpha Counter | 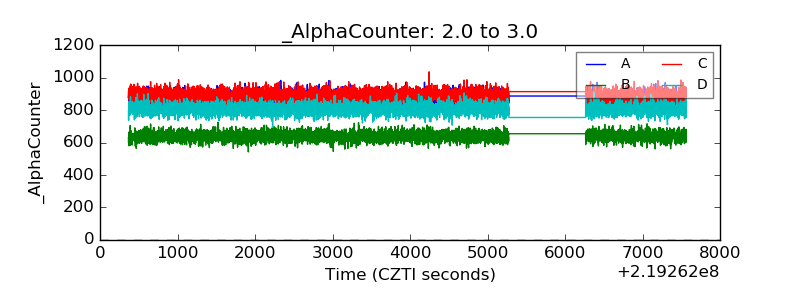 |
| _CPM_Rate | 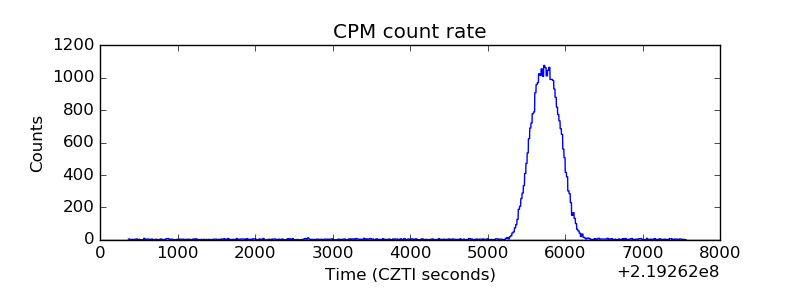 |
| CZT Counter | 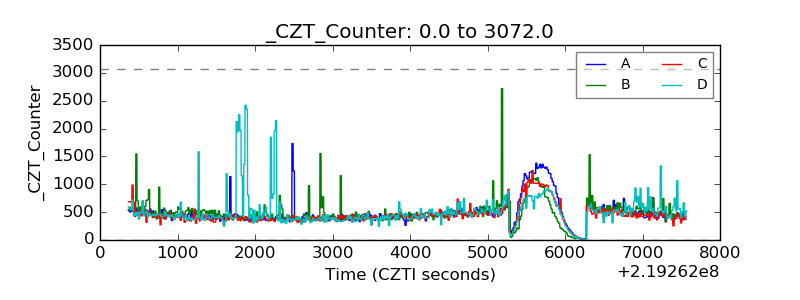 |
| +2.5 Volts monitor |  |
| +5 Volts monitor | 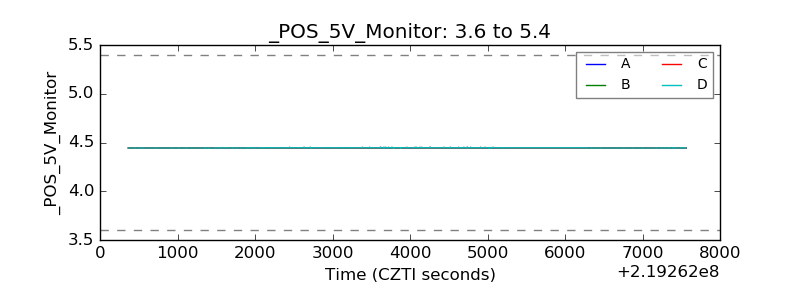 |
| _ROLL_ROT | 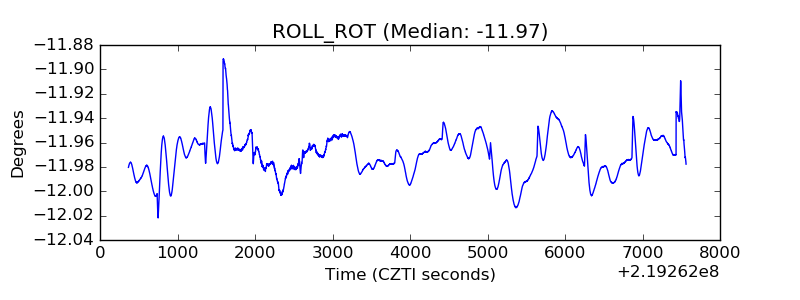 |
| _Roll_DEC | 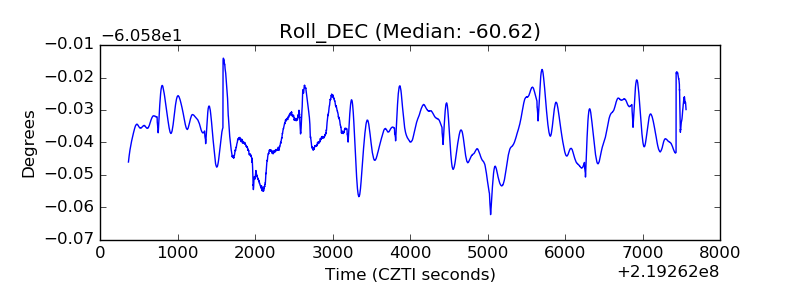 |
| _Roll_RA | 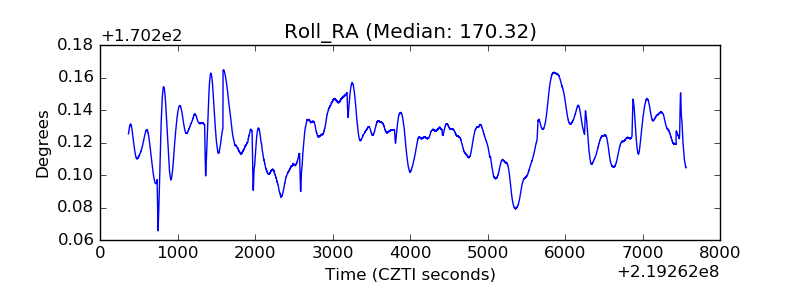 |
| Veto Counter | 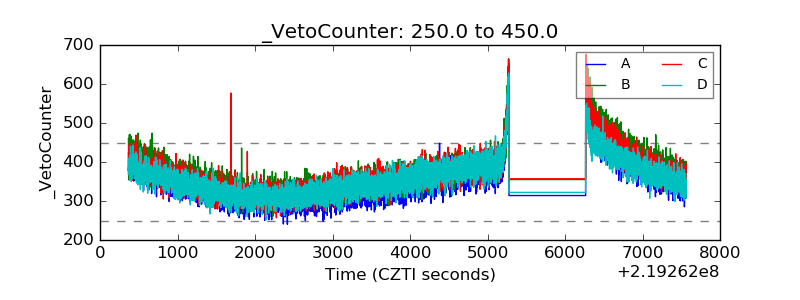 |