| Param | Original file | Final file |
|---|---|---|
| Filename | modeM0/AS1G06_091T01_9000000880_06539cztM0_level2.evt | modeM0/AS1G06_091T01_9000000880_06539cztM0_level2_quad_clean.evt |
| Size (bytes) | 445,613,760 | 110,396,160 |
| Size | 425.0 MB | 105.3 MB |
| Events in quadrant A | 3,333,213 | 732,135 |
| Events in quadrant B | 3,583,688 | 735,201 |
| Events in quadrant C | 2,863,055 | 728,241 |
| Events in quadrant D | 3,272,424 | 693,377 |
| Mode M0 | |||
|---|---|---|---|
| Quadrant | BADHDUFLAG | Total packets | Discarded packets |
| A | 0 | 14145 | 3 |
| B | 0 | 15168 | 2 |
| C | 0 | 13189 | 2 |
| D | 0 | 14355 | 2 |
| Mode M9 | |||
|---|---|---|---|
| Quadrant | BADHDUFLAG | Total packets | Discarded packets |
| A | 0 | 21 | 0 |
| B | 0 | 21 | 0 |
| C | 0 | 21 | 0 |
| D | 0 | 21 | 0 |
| Mode SS | |||
|---|---|---|---|
| Quadrant | BADHDUFLAG | Total packets | Discarded packets |
| A | 0 | 136 | 0 |
| B | 0 | 136 | 0 |
| C | 0 | 136 | 0 |
| D | 0 | 136 | 0 |
| Quadrant | Total seconds | Saturated seconds | Saturation percentage |
|---|---|---|---|
| A | 6511 | 73 | 1.121180% |
| B | 6511 | 172 | 2.641683% |
| C | 6511 | 15 | 0.230379% |
| D | 6511 | 81 | 1.244049% |
Noise dominated data is calculated using 1-second bins in cleaned event files. If a bin has >2000 counts, and if more than 50% of those come from <1% of pixels, then it is considered to be noise-dominated and hence unusable.
| Quadrant | # 1 sec bins | Bins with >0 counts | Bins with >2000 counts | High rate bins dominated by noise | Noise dominated (total time) | Noise dominated (detector-on time) | Marked lightcurve |
|---|---|---|---|---|---|---|---|
| A | 8646 | 6513 | 26 | 26 | 0.30% | 0.40% | 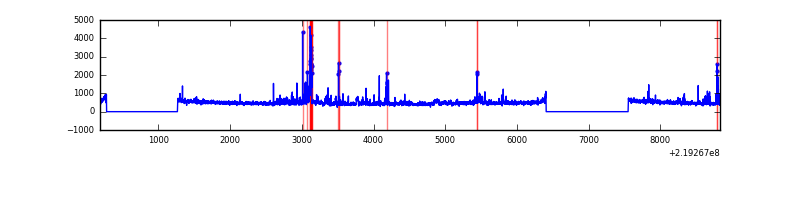 |
| B | 8646 | 6513 | 67 | 67 | 0.77% | 1.03% | 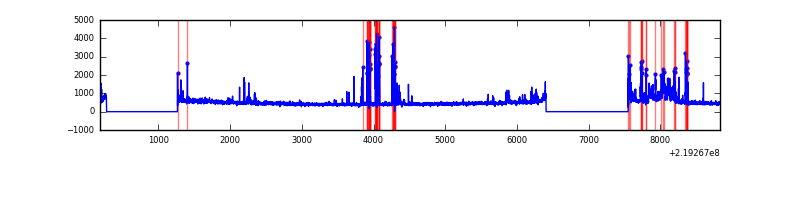 |
| C | 8646 | 6513 | 0 | 0 | 0.00% | 0.00% | 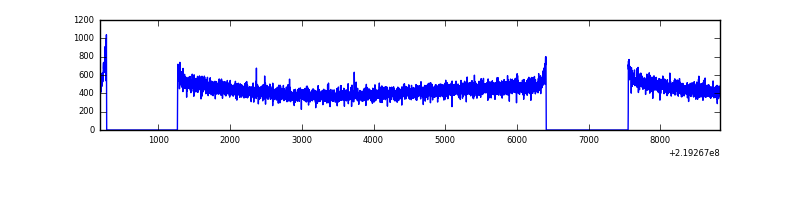 |
| D | 8646 | 6513 | 32 | 32 | 0.37% | 0.49% | 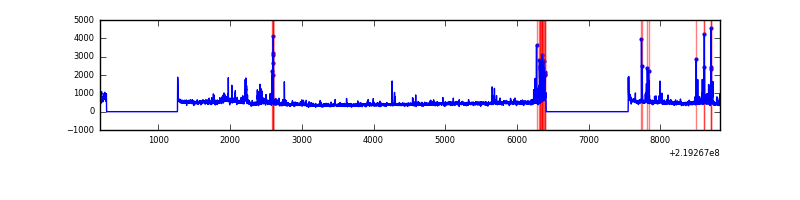 |
Top three noisy pixels from each quadrant. If the there are fewer than three noisy pixels in the level2.evt file, extra rows are filled as -1
| Pixel properties | Quadrant properties | ||||||
|---|---|---|---|---|---|---|---|
| Quadrant | DetID | PixID | Counts | Sigma | Mean | Median | Sigma |
| A | 13 | 251 | 304353 | 1949.21 | 756 | 738 | 155.8 |
| A | 15 | 236 | 74921 | 476.25 | 756 | 738 | 155.8 |
| A | 8 | 15 | 20577 | 127.36 | 756 | 738 | 155.8 |
| B | 4 | 170 | 313003 | 2176.25 | 761 | 743 | 143.5 |
| B | 0 | 219 | 184157 | 1278.28 | 761 | 743 | 143.5 |
| B | 15 | 204 | 23513 | 158.69 | 761 | 743 | 143.5 |
| C | 13 | 61 | 5973 | 30.87 | 732 | 737 | 169.6 |
| C | 5 | 223 | 2491 | 10.34 | 732 | 737 | 169.6 |
| C | 0 | 235 | 2422 | 9.93 | 732 | 737 | 169.6 |
| D | 2 | 152 | 157683 | 881.5 | 725 | 702 | 178.1 |
| D | 12 | 233 | 99167 | 552.92 | 725 | 702 | 178.1 |
| D | 2 | 33 | 79905 | 444.75 | 725 | 702 | 178.1 |
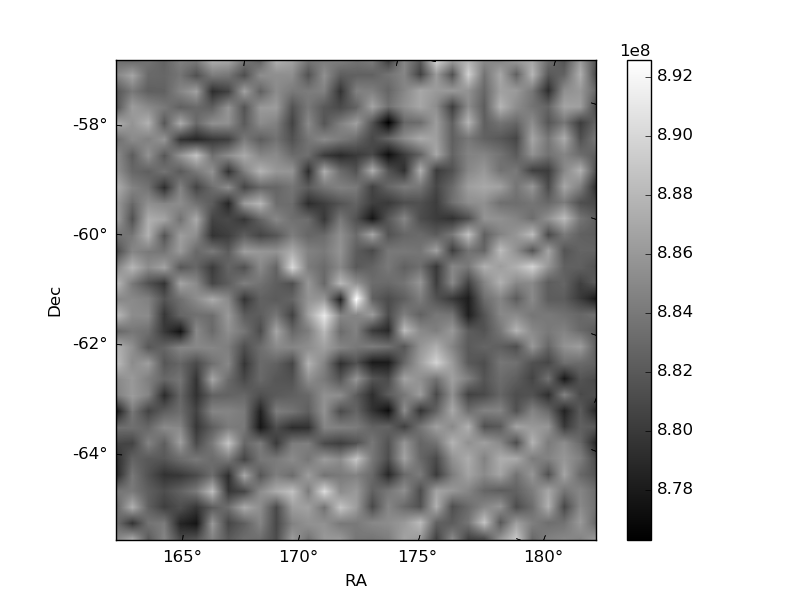
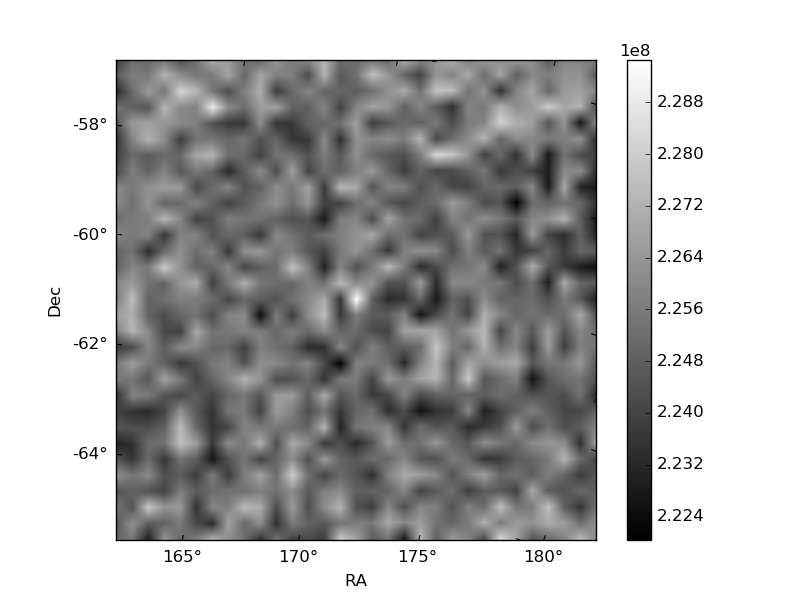
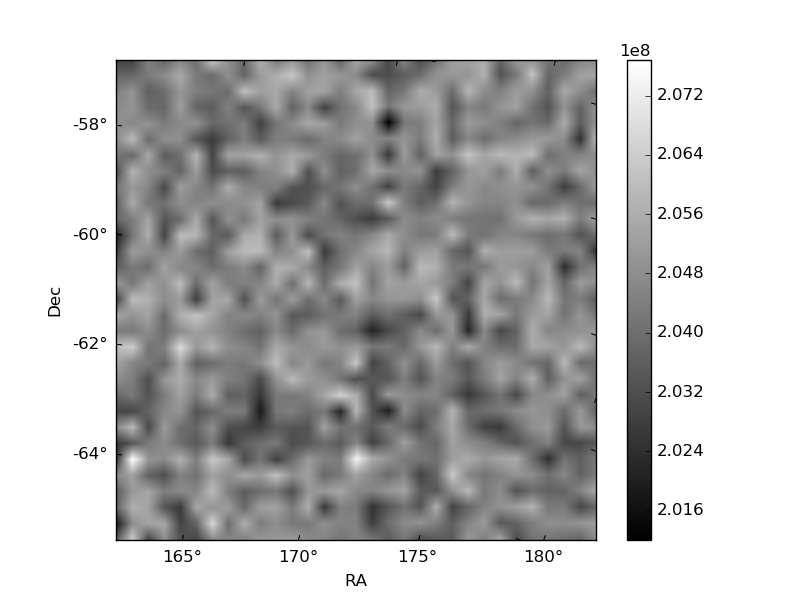
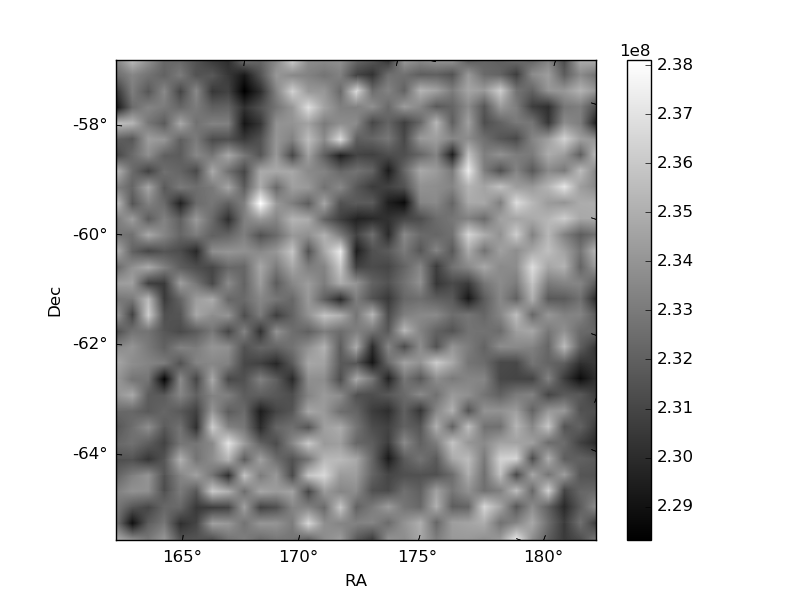
Histogram calculated using DETX and DETY for each event in the final _common_clean file
| Quadrant A | 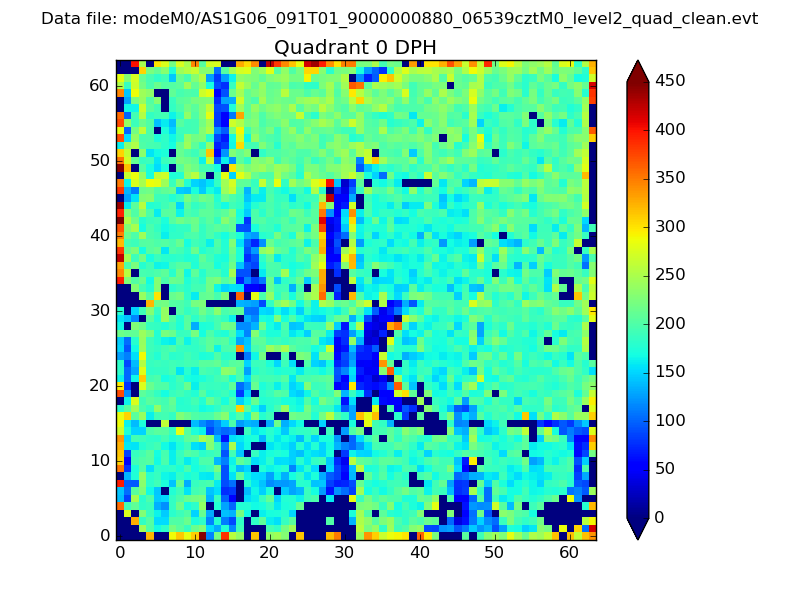 |
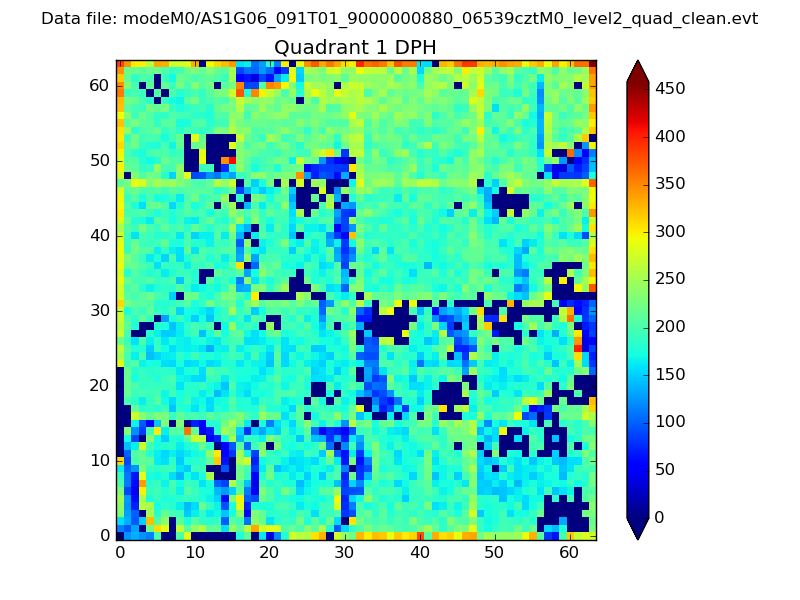 |
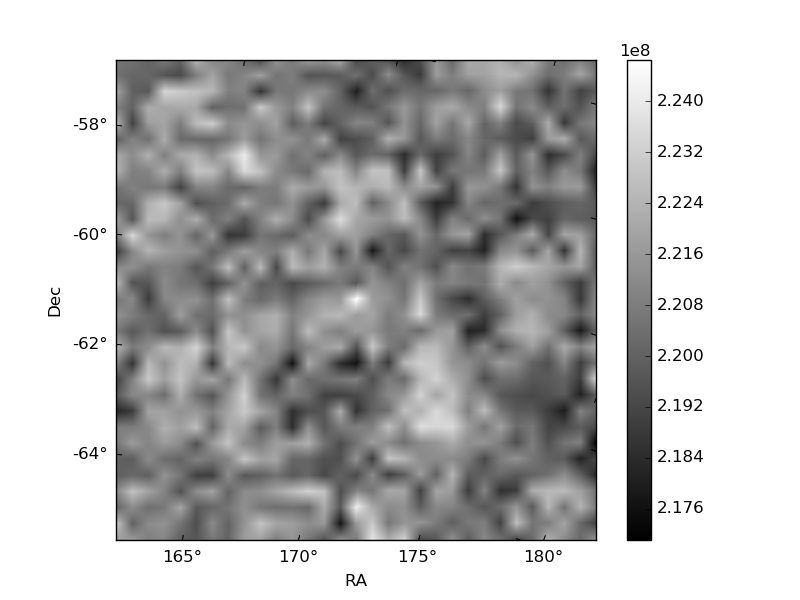
Quadrant B |
|---|---|---|---|
| Quadrant D | 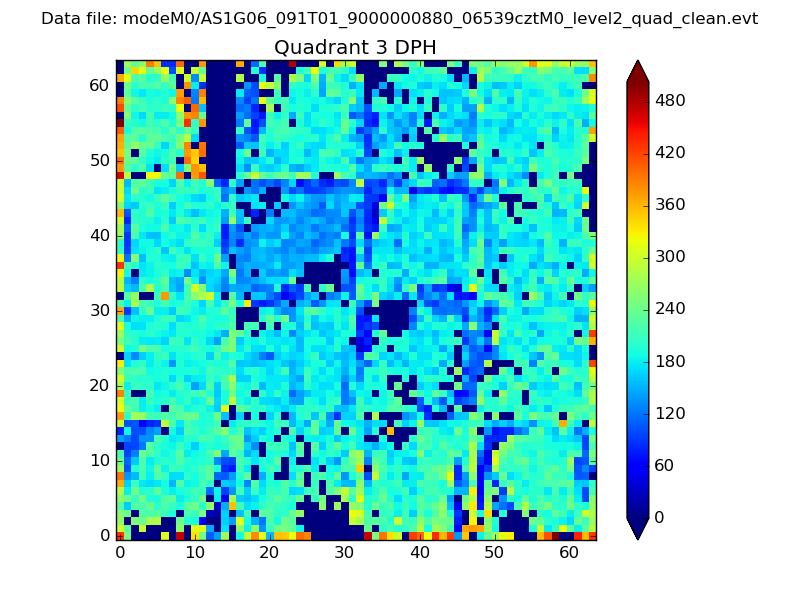 |
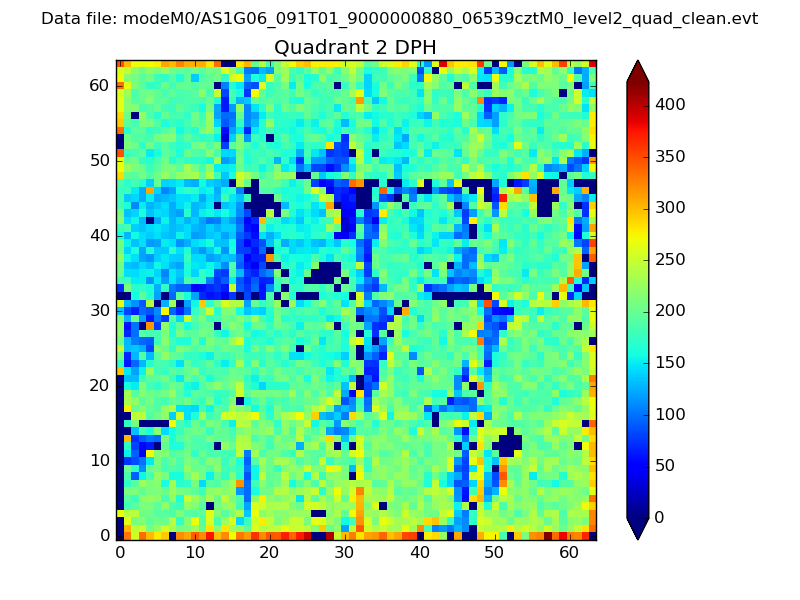 |
Quadrant C |
| Plot type | Count rate plots | Images |
|---|---|---|
| Comparison with Poisson distribution Blue bars denote a histogram of data divided into 1 sec bins. Red curve is a Poisson curve with rate = median count rate of data. |
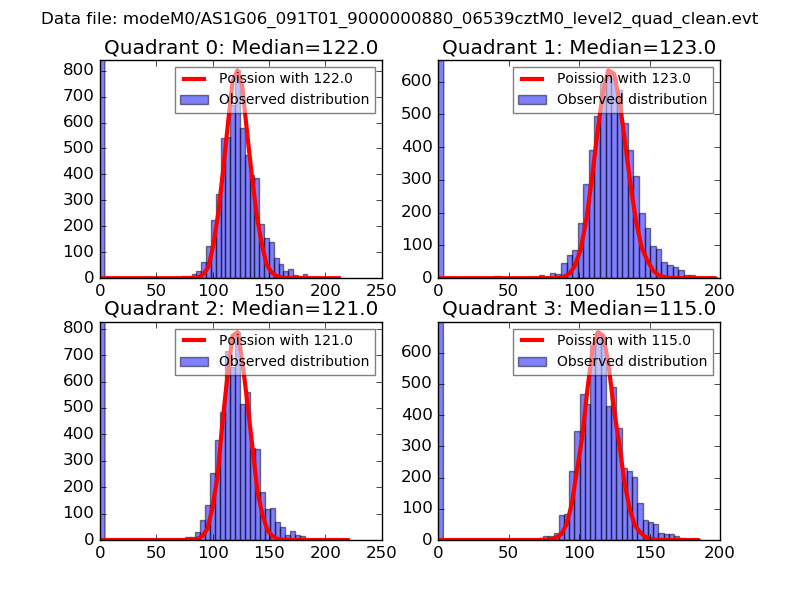 |
 |
| Quadrant-wise count rates Data is divided into 100 sec bins |
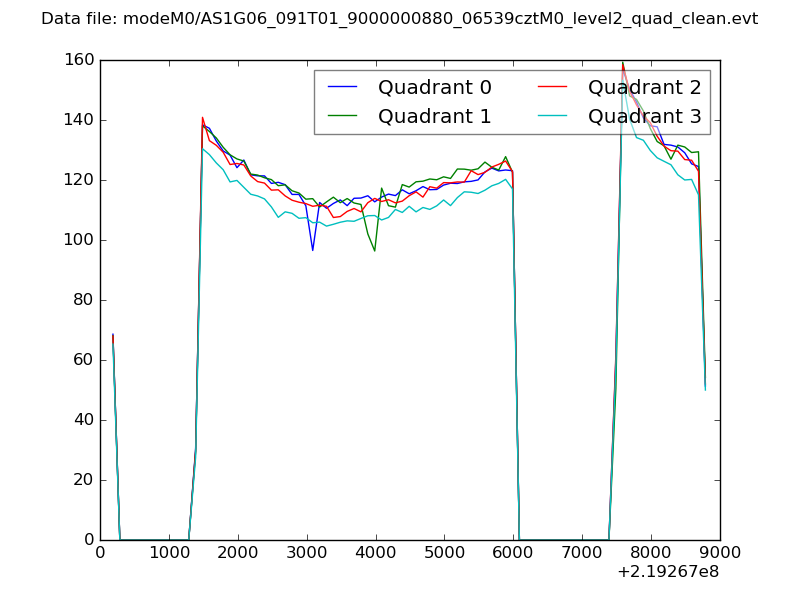 |
|
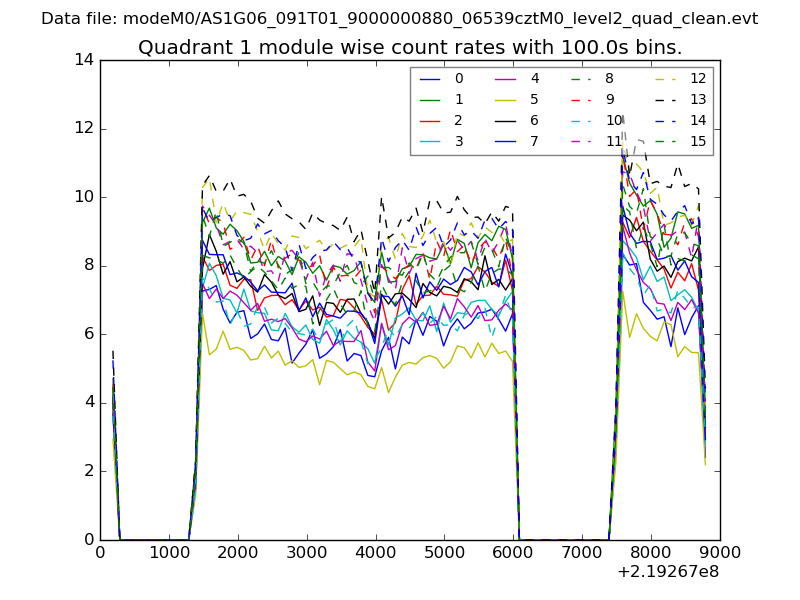
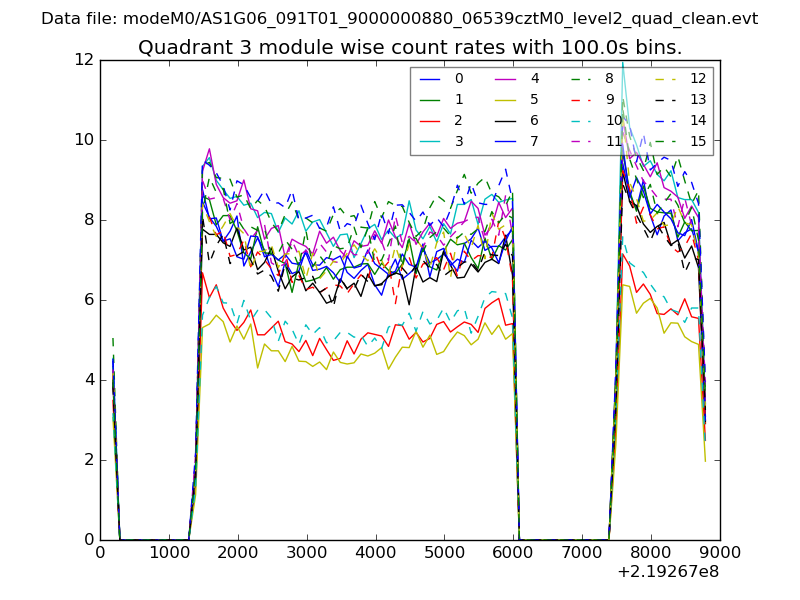
| Module-wise count rates for Quadrant A Data is divided into 100 sec bins |
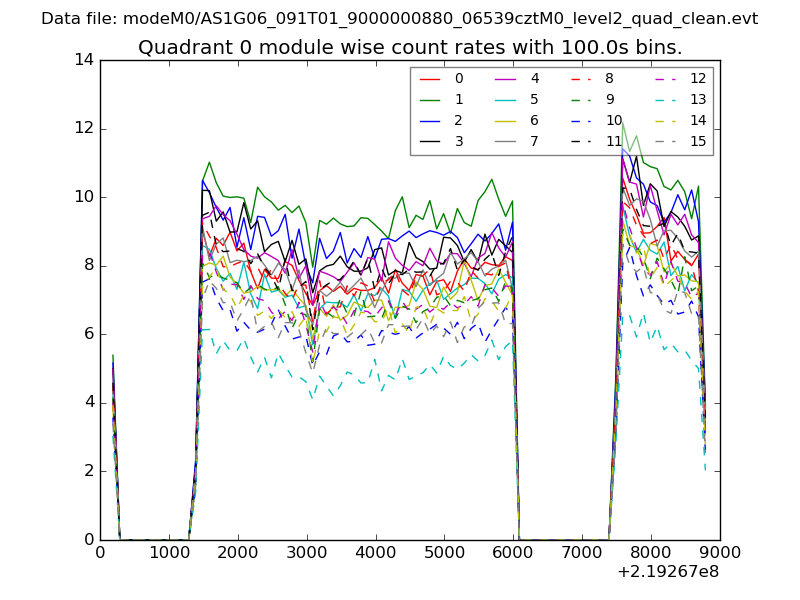 |
 |
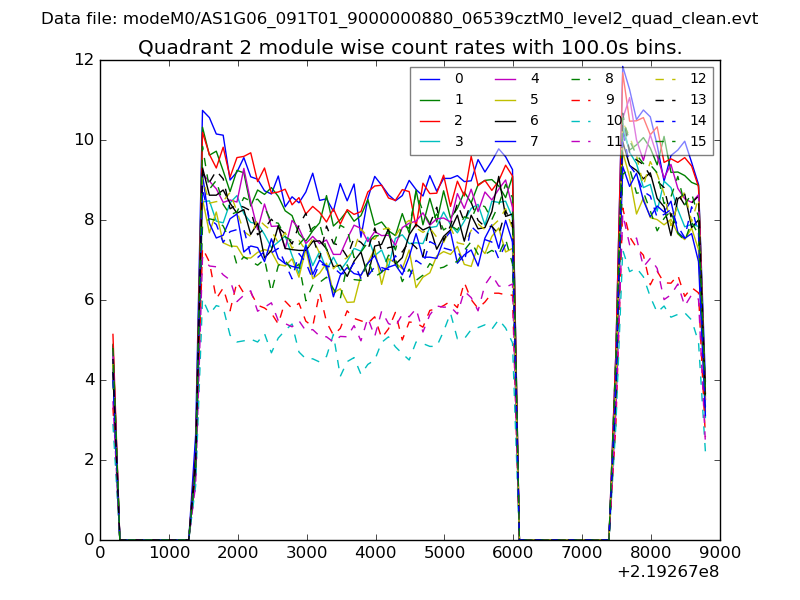
| Module-wise count rates for Quadrant B Data is divided into 100 sec bins |
 |
 |
| Module-wise count rates for Quadrant C Data is divided into 100 sec bins |
 |
 |
| Module-wise count rates for Quadrant D Data is divided into 100 sec bins |
 |
 |
| Parameter | Plot |
|---|---|
| CZT HV Monitor | 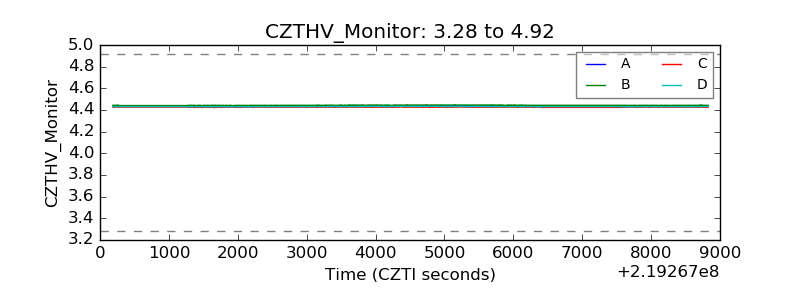 |
| D_VDD | 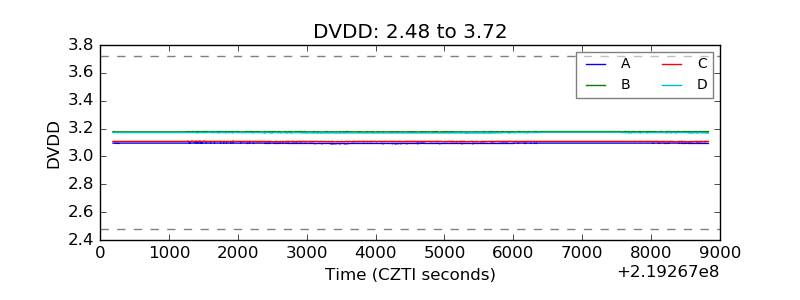 |
| Temperature 1 | 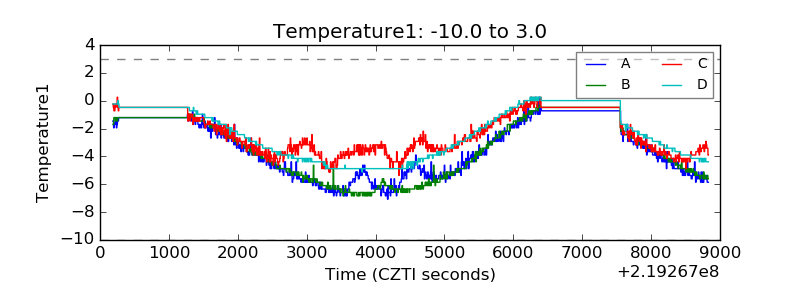 |
| Veto HV Monitor | 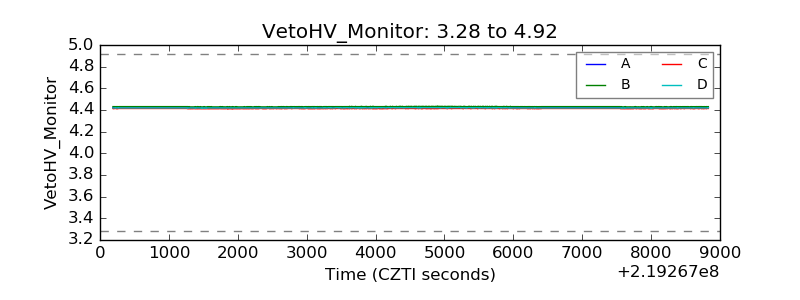 |
| Veto LLD | 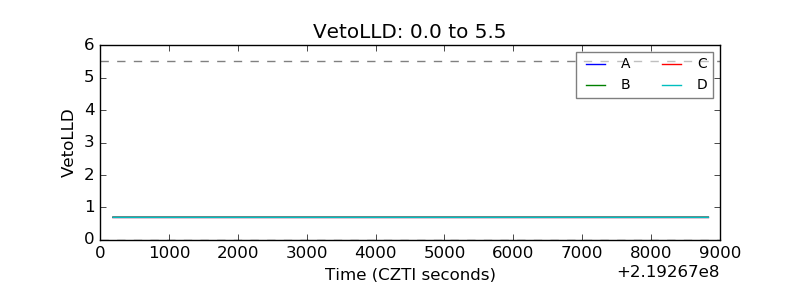 |
| Alpha Counter | 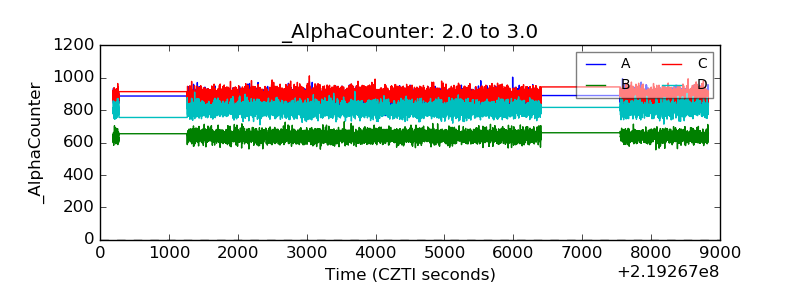 |
| _CPM_Rate | 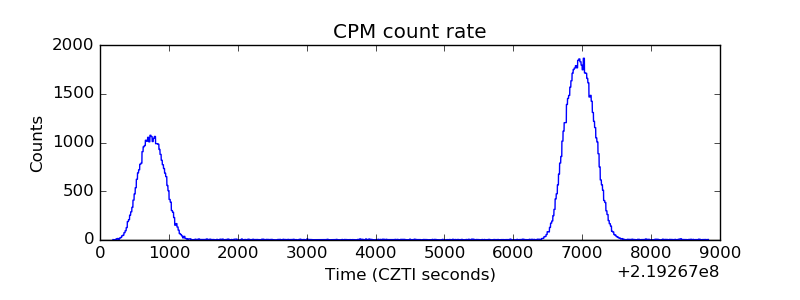 |
| CZT Counter | 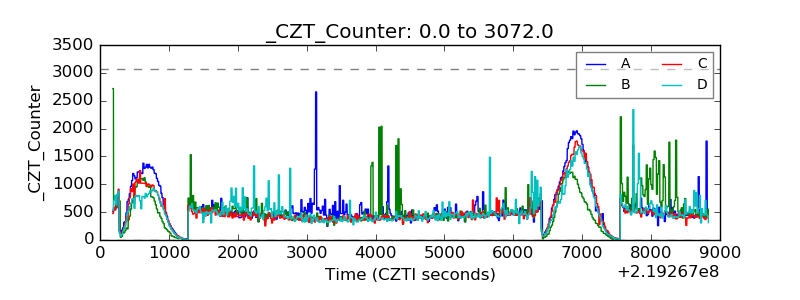 |
| +2.5 Volts monitor |  |
| +5 Volts monitor |  |
| _ROLL_ROT | 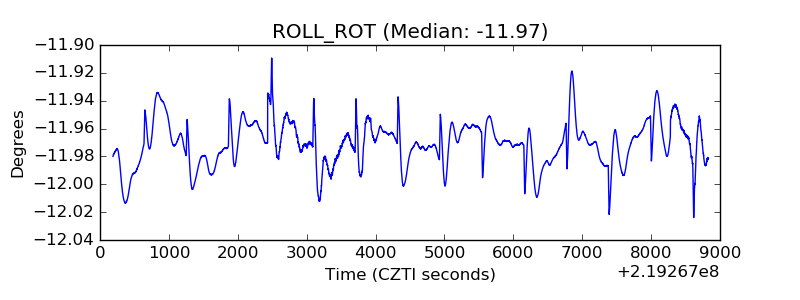 |
| _Roll_DEC | 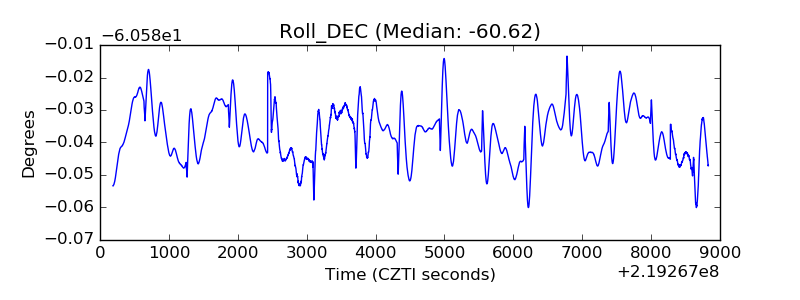 |
| _Roll_RA | 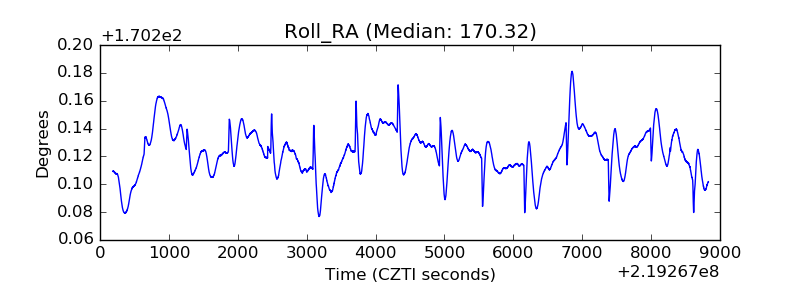 |
| Veto Counter | 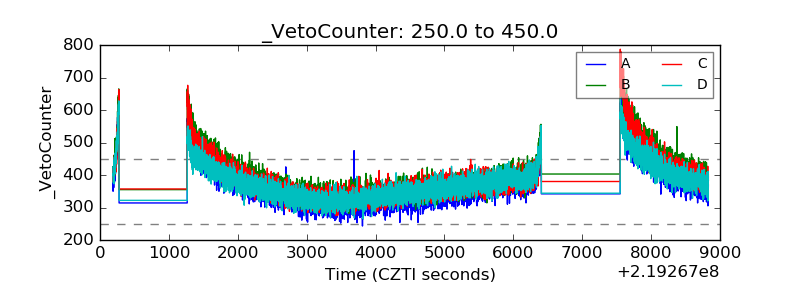 |