| Param | Original file | Final file |
|---|---|---|
| Filename | modeM0/AS1G06_091T01_9000000880_06542cztM0_level2.evt | modeM0/AS1G06_091T01_9000000880_06542cztM0_level2_quad_clean.evt |
| Size (bytes) | 459,132,480 | 107,069,760 |
| Size | 437.9 MB | 102.1 MB |
| Events in quadrant A | 3,476,405 | 691,787 |
| Events in quadrant B | 3,324,581 | 716,929 |
| Events in quadrant C | 3,019,322 | 715,109 |
| Events in quadrant D | 3,646,279 | 669,213 |
| Mode M0 | |||
|---|---|---|---|
| Quadrant | BADHDUFLAG | Total packets | Discarded packets |
| A | 0 | 14771 | 3 |
| B | 0 | 14117 | 2 |
| C | 0 | 13208 | 2 |
| D | 0 | 15336 | 2 |
| Mode M9 | |||
|---|---|---|---|
| Quadrant | BADHDUFLAG | Total packets | Discarded packets |
| A | 0 | 17 | 0 |
| B | 0 | 17 | 0 |
| C | 0 | 17 | 0 |
| D | 0 | 18 | 0 |
| Mode SS | |||
|---|---|---|---|
| Quadrant | BADHDUFLAG | Total packets | Discarded packets |
| A | 0 | 130 | 0 |
| B | 0 | 130 | 0 |
| C | 0 | 130 | 0 |
| D | 0 | 130 | 0 |
| Quadrant | Total seconds | Saturated seconds | Saturation percentage |
|---|---|---|---|
| A | 6451 | 122 | 1.891180% |
| B | 6451 | 104 | 1.612153% |
| C | 6451 | 19 | 0.294528% |
| D | 6451 | 142 | 2.201209% |
Noise dominated data is calculated using 1-second bins in cleaned event files. If a bin has >2000 counts, and if more than 50% of those come from <1% of pixels, then it is considered to be noise-dominated and hence unusable.
| Quadrant | # 1 sec bins | Bins with >0 counts | Bins with >2000 counts | High rate bins dominated by noise | Noise dominated (total time) | Noise dominated (detector-on time) | Marked lightcurve |
|---|---|---|---|---|---|---|---|
| A | 7796 | 6452 | 84 | 84 | 1.08% | 1.30% | 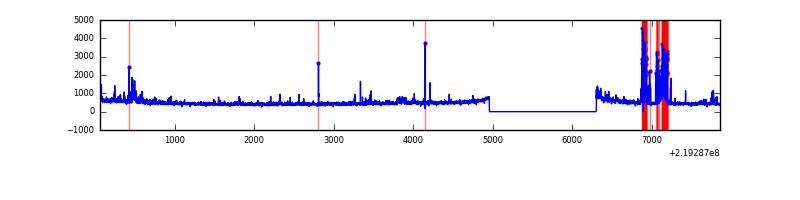 |
| B | 7796 | 6452 | 56 | 56 | 0.72% | 0.87% | 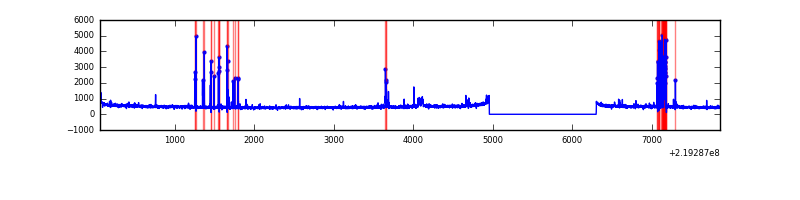 |
| C | 7796 | 6452 | 2 | 2 | 0.03% | 0.03% | 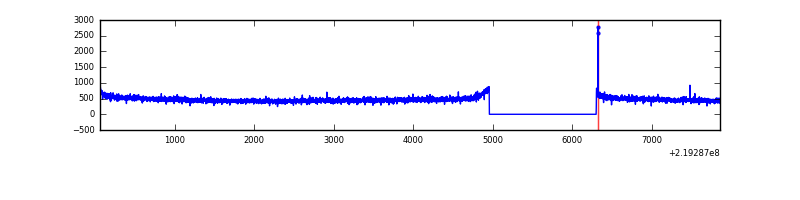 |
| D | 7796 | 6452 | 87 | 87 | 1.12% | 1.35% | 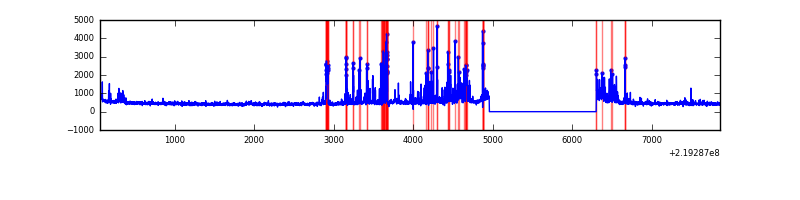 |
Top three noisy pixels from each quadrant. If the there are fewer than three noisy pixels in the level2.evt file, extra rows are filled as -1
| Pixel properties | Quadrant properties | ||||||
|---|---|---|---|---|---|---|---|
| Quadrant | DetID | PixID | Counts | Sigma | Mean | Median | Sigma |
| A | 13 | 251 | 352434 | 2294.59 | 756 | 740 | 153.3 |
| A | 15 | 236 | 145376 | 943.66 | 756 | 740 | 153.3 |
| A | 14 | 111 | 41515 | 266.03 | 756 | 740 | 153.3 |
| B | 4 | 48 | 201363 | 1404.61 | 775 | 758 | 142.8 |
| B | 4 | 170 | 30735 | 209.9 | 775 | 758 | 142.8 |
| B | 0 | 214 | 26160 | 177.86 | 775 | 758 | 142.8 |
| C | 8 | 128 | 11969 | 63.15 | 766 | 770 | 177.3 |
| C | 9 | 237 | 6985 | 35.04 | 766 | 770 | 177.3 |
| C | 8 | 112 | 6274 | 31.04 | 766 | 770 | 177.3 |
| D | 14 | 34 | 356229 | 1943.59 | 748 | 728 | 182.9 |
| D | 2 | 33 | 186830 | 1017.45 | 748 | 728 | 182.9 |
| D | 2 | 152 | 146854 | 798.89 | 748 | 728 | 182.9 |
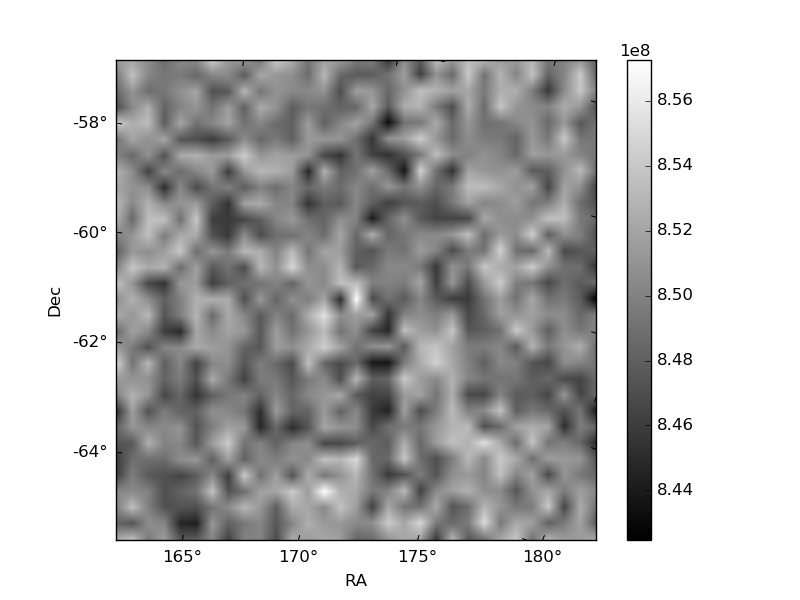
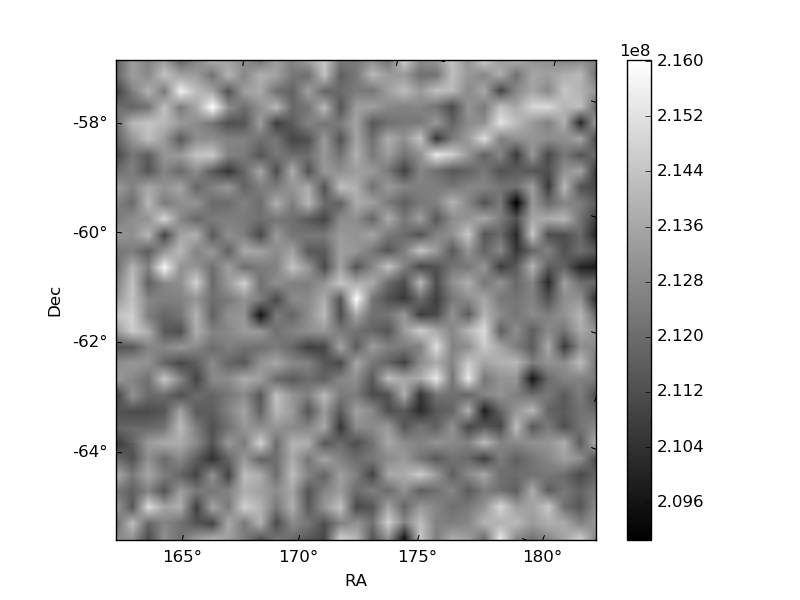
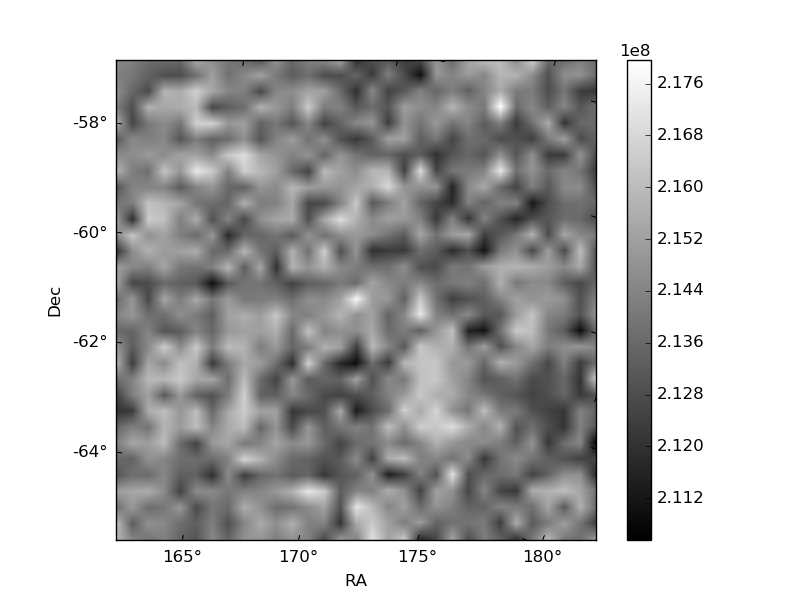
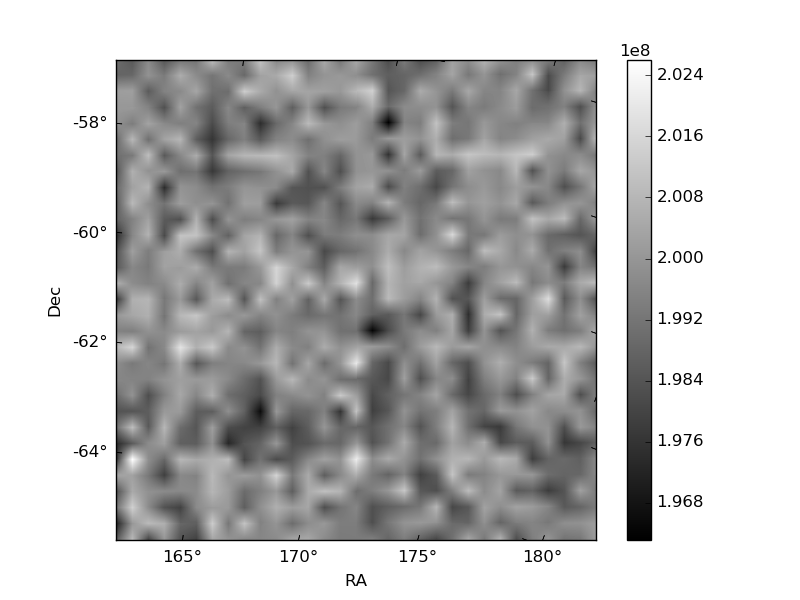
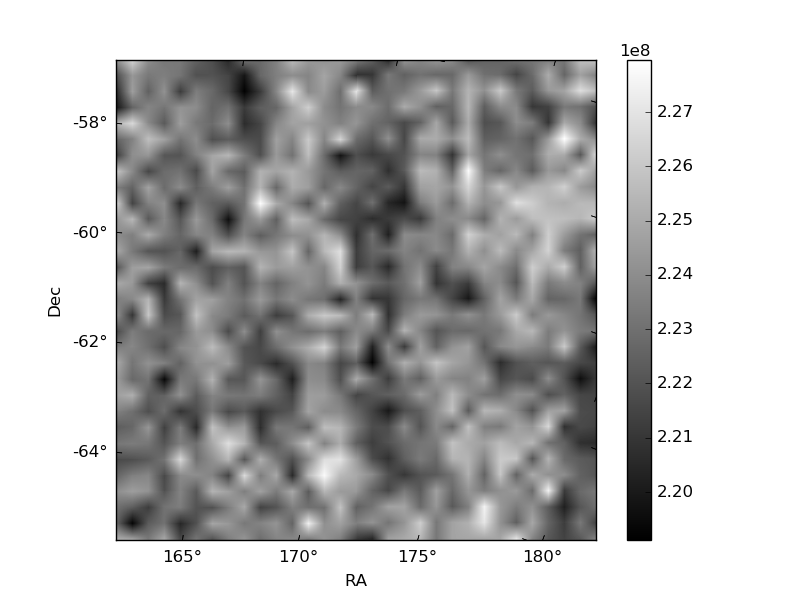
Histogram calculated using DETX and DETY for each event in the final _common_clean file
| Quadrant A | 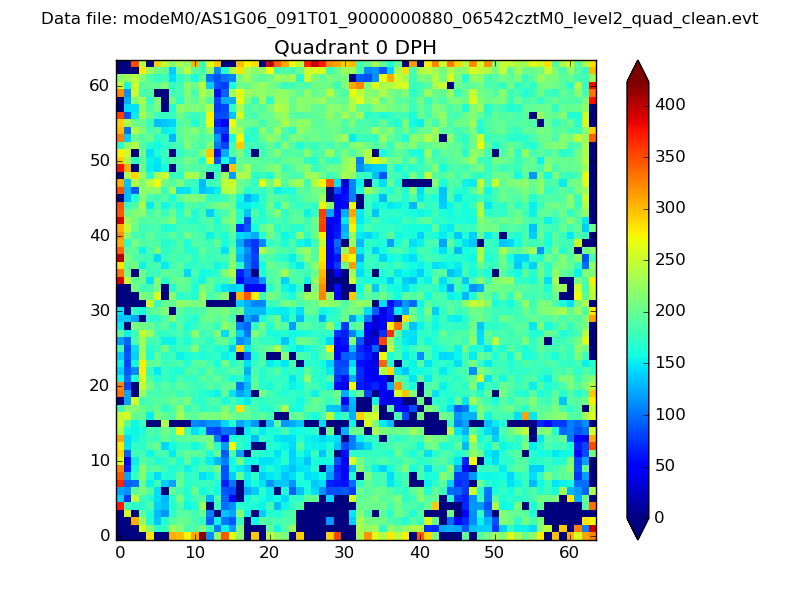 |
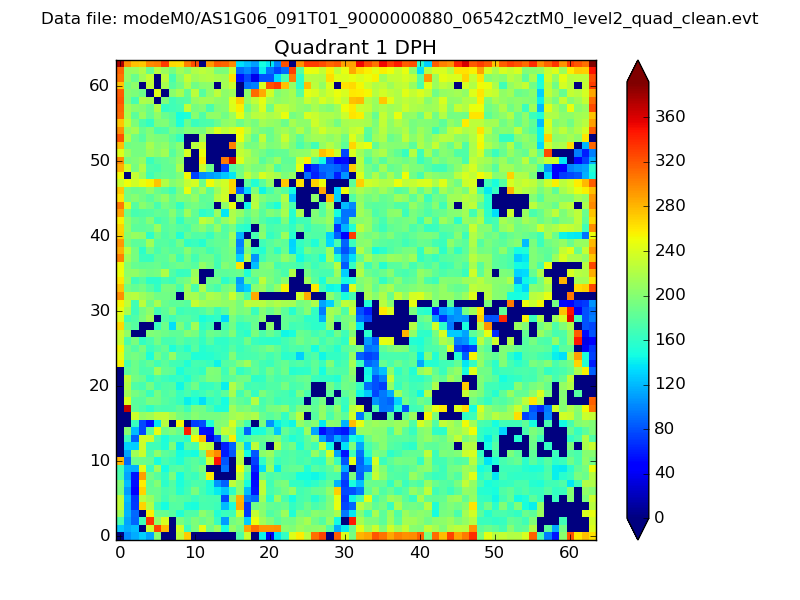 |
Quadrant B |
|---|---|---|---|
| Quadrant D | 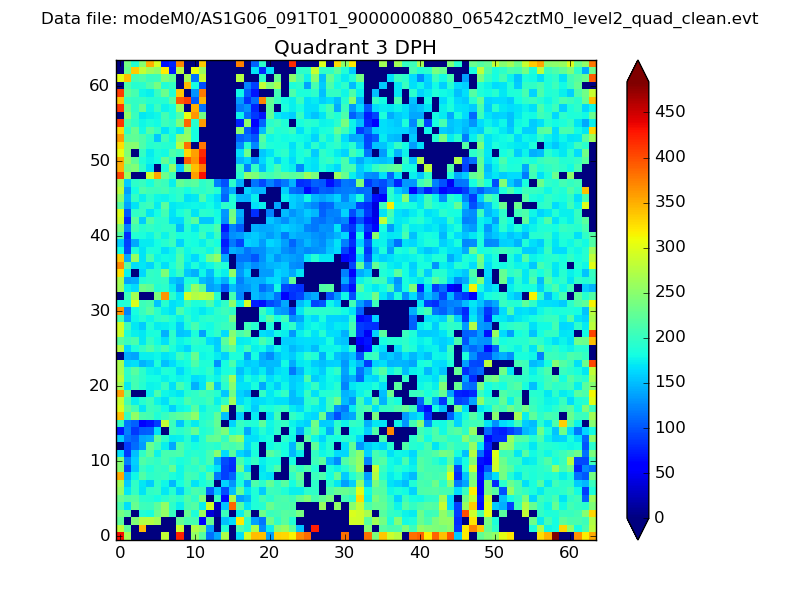 |
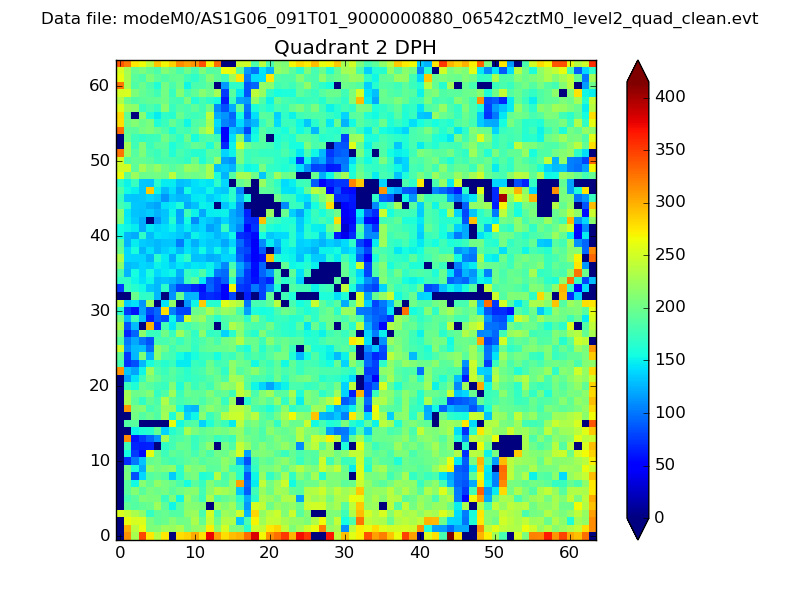 |
Quadrant C |
| Plot type | Count rate plots | Images |
|---|---|---|
| Comparison with Poisson distribution Blue bars denote a histogram of data divided into 1 sec bins. Red curve is a Poisson curve with rate = median count rate of data. |
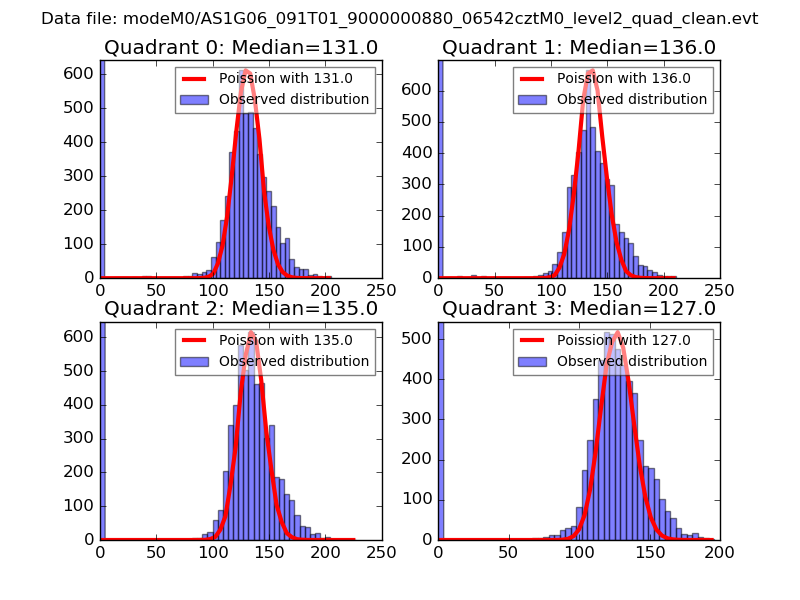 |
 |
| Quadrant-wise count rates Data is divided into 100 sec bins |
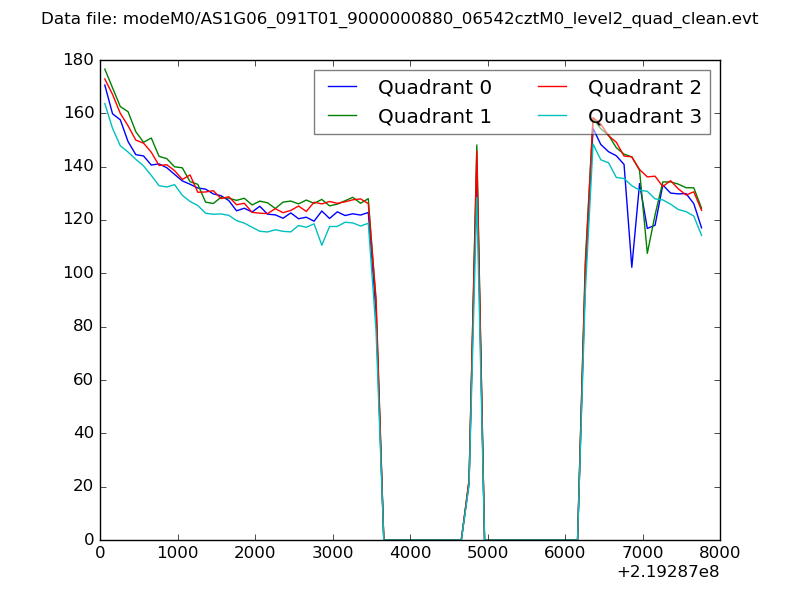 |
|
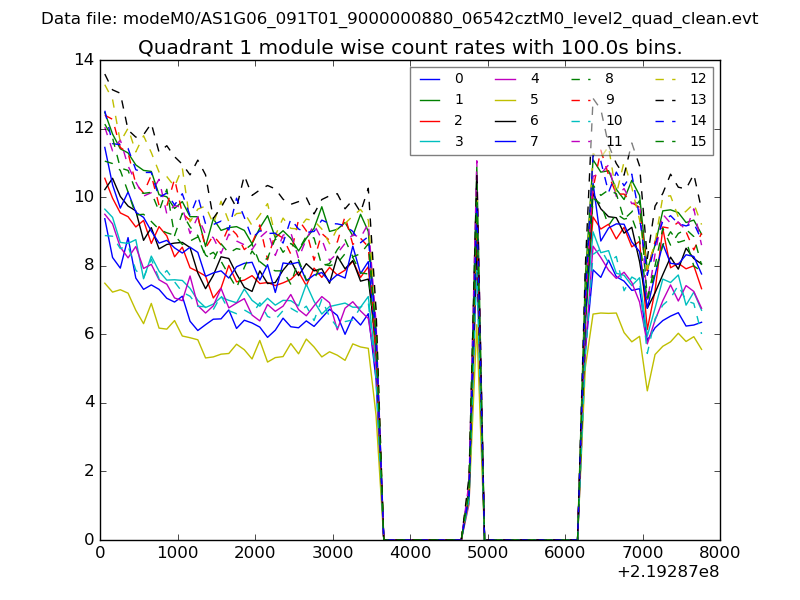
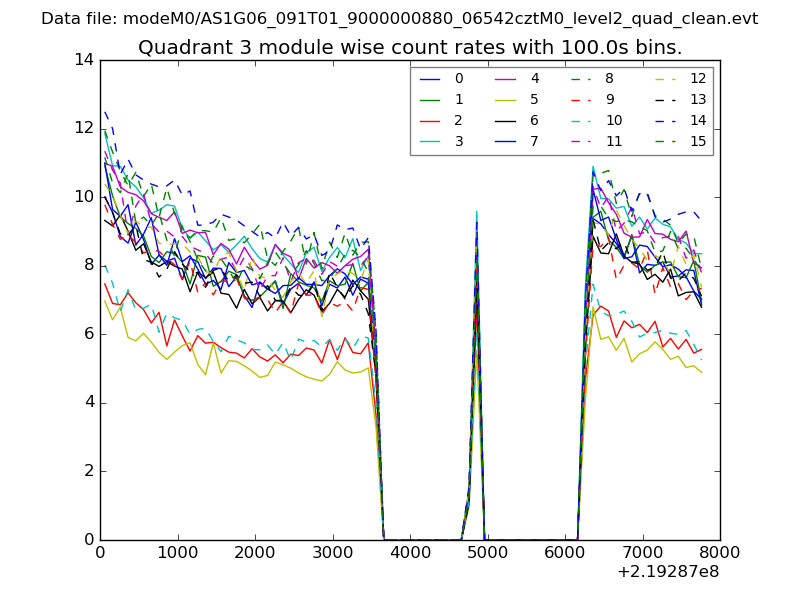
| Module-wise count rates for Quadrant A Data is divided into 100 sec bins |
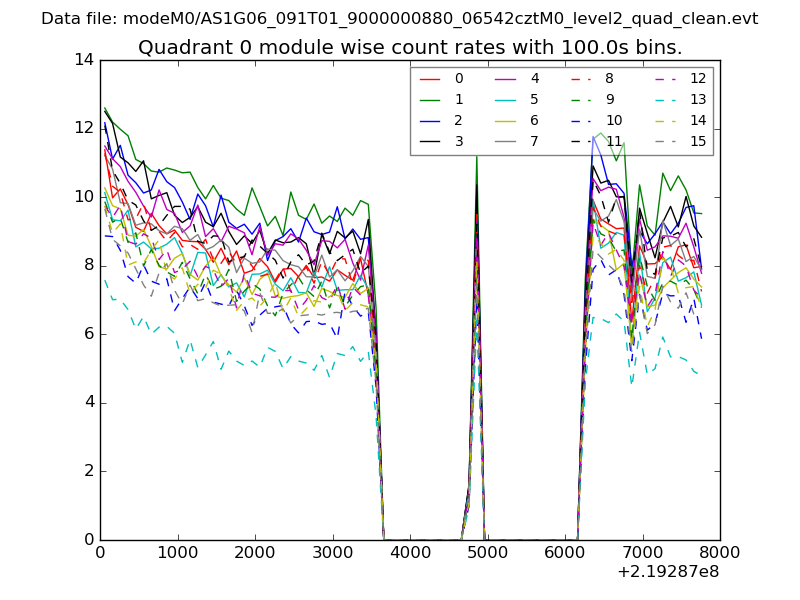 |
 |
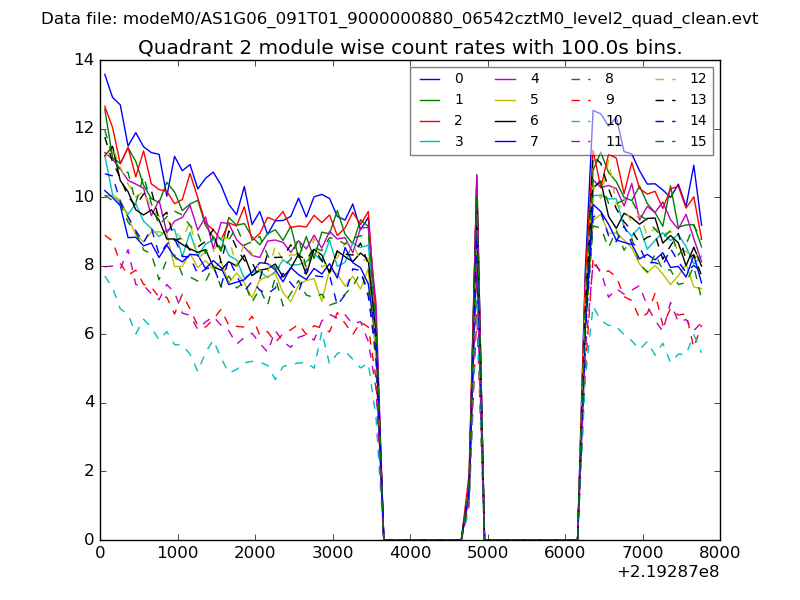
| Module-wise count rates for Quadrant B Data is divided into 100 sec bins |
 |
 |
| Module-wise count rates for Quadrant C Data is divided into 100 sec bins |
 |
 |
| Module-wise count rates for Quadrant D Data is divided into 100 sec bins |
 |
 |
| Parameter | Plot |
|---|---|
| CZT HV Monitor | 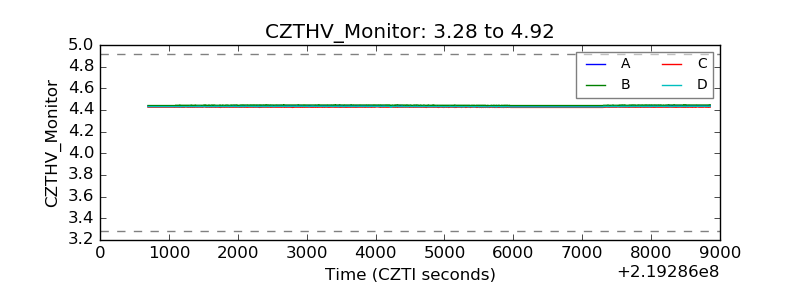 |
| D_VDD | 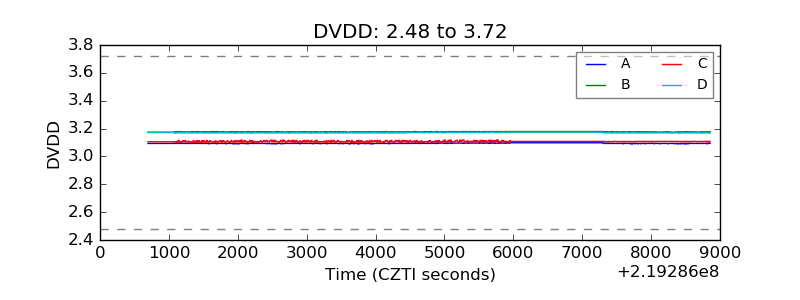 |
| Temperature 1 | 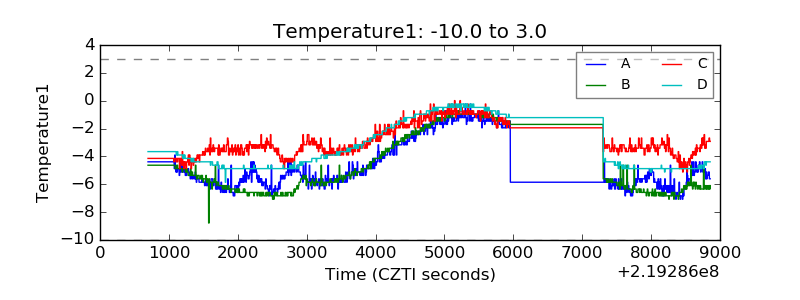 |
| Veto HV Monitor | 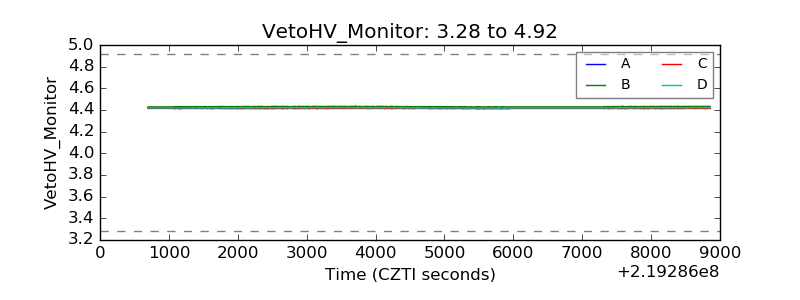 |
| Veto LLD | 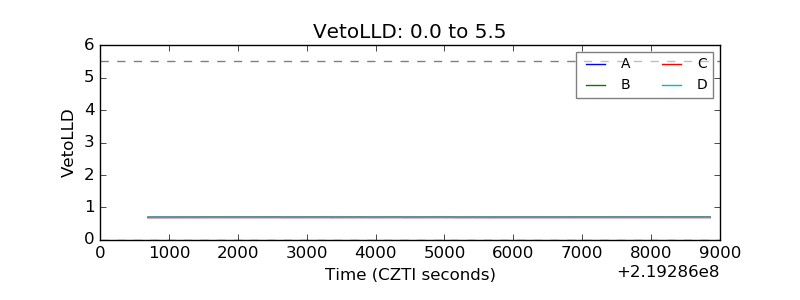 |
| Alpha Counter | 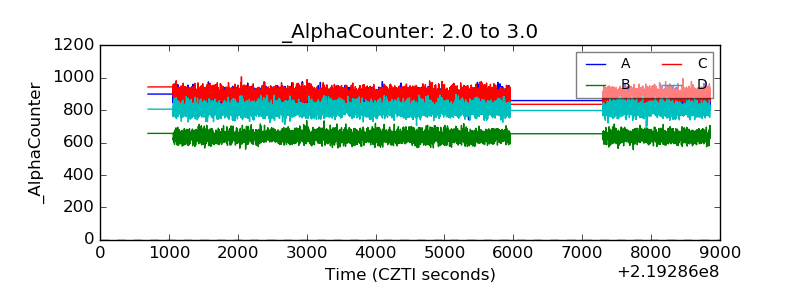 |
| _CPM_Rate | 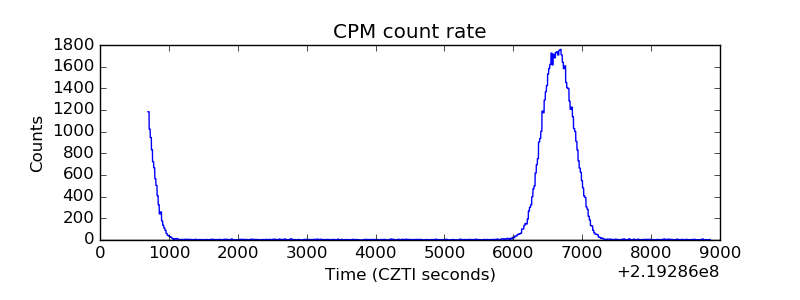 |
| CZT Counter | 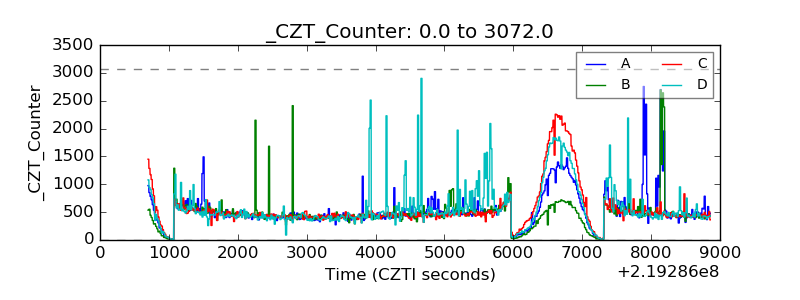 |
| +2.5 Volts monitor |  |
| +5 Volts monitor |  |
| _ROLL_ROT | 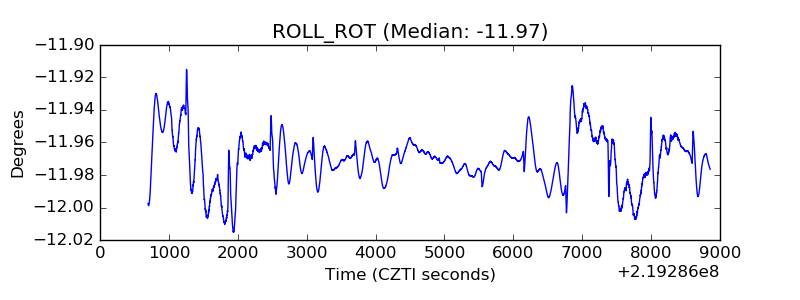 |
| _Roll_DEC | 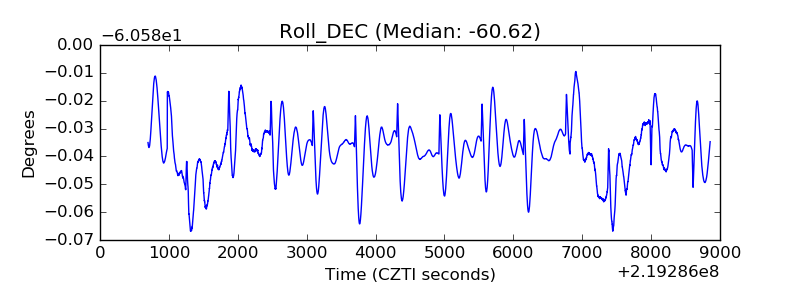 |
| _Roll_RA | 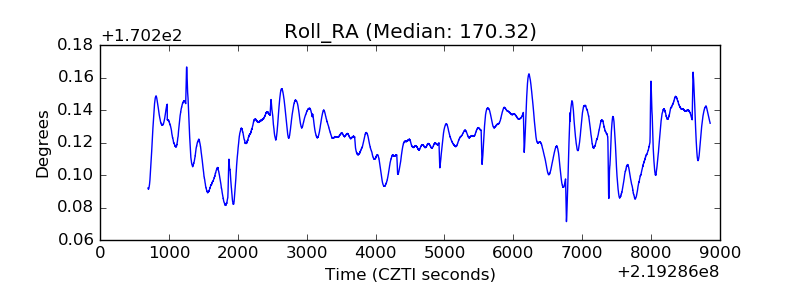 |
| Veto Counter | 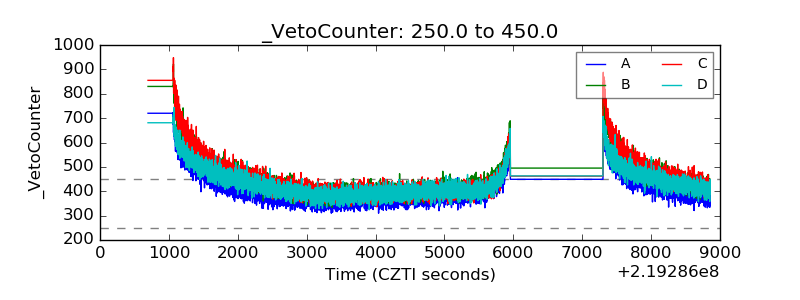 |