| Param | Original file | Final file |
|---|---|---|
| Filename | modeM0/AS1G06_091T01_9000000880_06544cztM0_level2.evt | modeM0/AS1G06_091T01_9000000880_06544cztM0_level2_quad_clean.evt |
| Size (bytes) | 433,036,800 | 97,038,720 |
| Size | 413.0 MB | 92.5 MB |
| Events in quadrant A | 3,081,967 | 628,286 |
| Events in quadrant B | 3,209,047 | 638,352 |
| Events in quadrant C | 2,820,863 | 638,501 |
| Events in quadrant D | 3,575,614 | 595,308 |
| Mode M0 | |||
|---|---|---|---|
| Quadrant | BADHDUFLAG | Total packets | Discarded packets |
| A | 0 | 13326 | 2 |
| B | 0 | 13862 | 1 |
| C | 0 | 12831 | 1 |
| D | 0 | 15055 | 1 |
| Mode M9 | |||
|---|---|---|---|
| Quadrant | BADHDUFLAG | Total packets | Discarded packets |
| A | 0 | 10 | 0 |
| B | 0 | 10 | 0 |
| C | 0 | 10 | 0 |
| D | 0 | 10 | 0 |
| Mode SS | |||
|---|---|---|---|
| Quadrant | BADHDUFLAG | Total packets | Discarded packets |
| A | 0 | 128 | 0 |
| B | 0 | 128 | 0 |
| C | 0 | 128 | 0 |
| D | 0 | 128 | 0 |
| Quadrant | Total seconds | Saturated seconds | Saturation percentage |
|---|---|---|---|
| A | 6275 | 79 | 1.258964% |
| B | 6275 | 158 | 2.517928% |
| C | 6275 | 75 | 1.195219% |
| D | 6275 | 243 | 3.872510% |
Noise dominated data is calculated using 1-second bins in cleaned event files. If a bin has >2000 counts, and if more than 50% of those come from <1% of pixels, then it is considered to be noise-dominated and hence unusable.
| Quadrant | # 1 sec bins | Bins with >0 counts | Bins with >2000 counts | High rate bins dominated by noise | Noise dominated (total time) | Noise dominated (detector-on time) | Marked lightcurve |
|---|---|---|---|---|---|---|---|
| A | 7260 | 6276 | 2 | 2 | 0.03% | 0.03% | 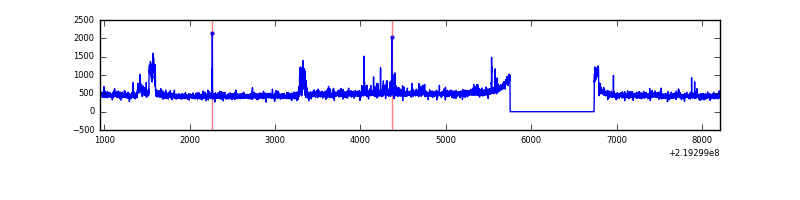 |
| B | 7260 | 6276 | 62 | 62 | 0.85% | 0.99% | 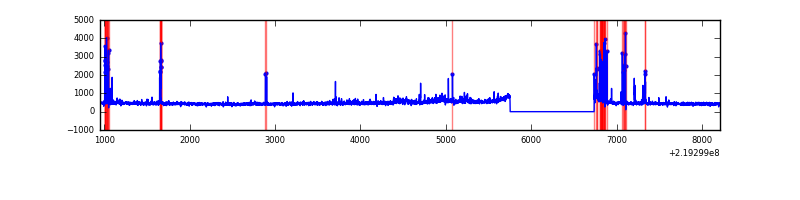 |
| C | 7260 | 6276 | 1 | 1 | 0.01% | 0.02% | 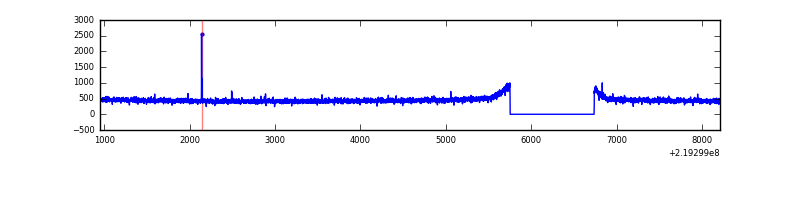 |
| D | 7260 | 6276 | 120 | 120 | 1.65% | 1.91% | 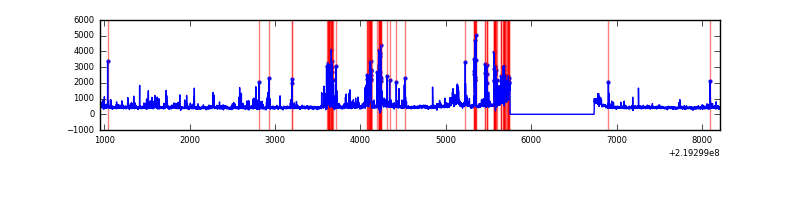 |
Top three noisy pixels from each quadrant. If the there are fewer than three noisy pixels in the level2.evt file, extra rows are filled as -1
| Pixel properties | Quadrant properties | ||||||
|---|---|---|---|---|---|---|---|
| Quadrant | DetID | PixID | Counts | Sigma | Mean | Median | Sigma |
| A | 15 | 236 | 136921 | 924.88 | 721 | 705 | 147.3 |
| A | 8 | 15 | 64339 | 432.06 | 721 | 705 | 147.3 |
| A | 13 | 14 | 37298 | 248.46 | 721 | 705 | 147.3 |
| B | 4 | 48 | 150967 | 1090.36 | 726 | 706 | 137.8 |
| B | 15 | 204 | 81574 | 586.81 | 726 | 706 | 137.8 |
| B | 0 | 219 | 75450 | 542.37 | 726 | 706 | 137.8 |
| C | 12 | 4 | 7431 | 40.36 | 721 | 724 | 166.2 |
| C | 13 | 61 | 5633 | 29.54 | 721 | 724 | 166.2 |
| C | 3 | 202 | 1898 | 7.06 | 721 | 724 | 166.2 |
| D | 2 | 33 | 530102 | 3082.21 | 701 | 680 | 171.8 |
| D | 2 | 152 | 103850 | 600.64 | 701 | 680 | 171.8 |
| D | 14 | 34 | 78710 | 454.28 | 701 | 680 | 171.8 |
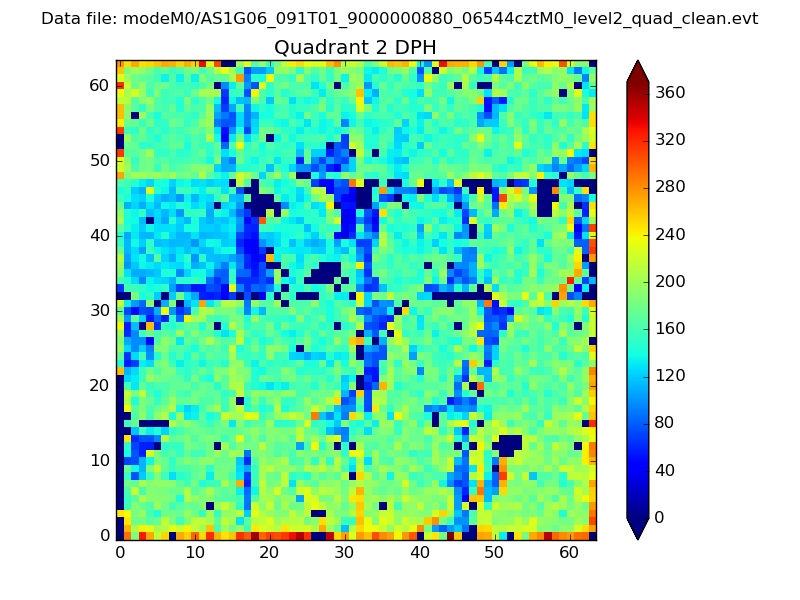
Histogram calculated using DETX and DETY for each event in the final _common_clean file
| Quadrant A | 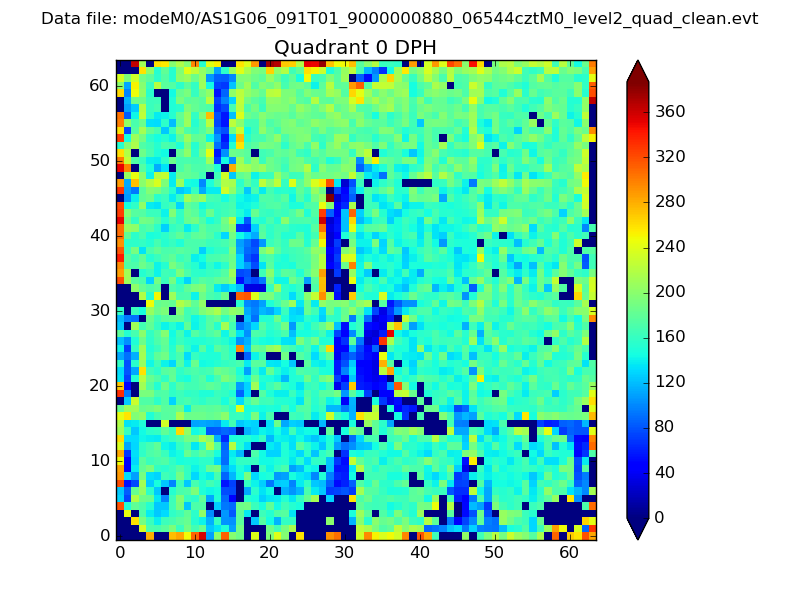 |
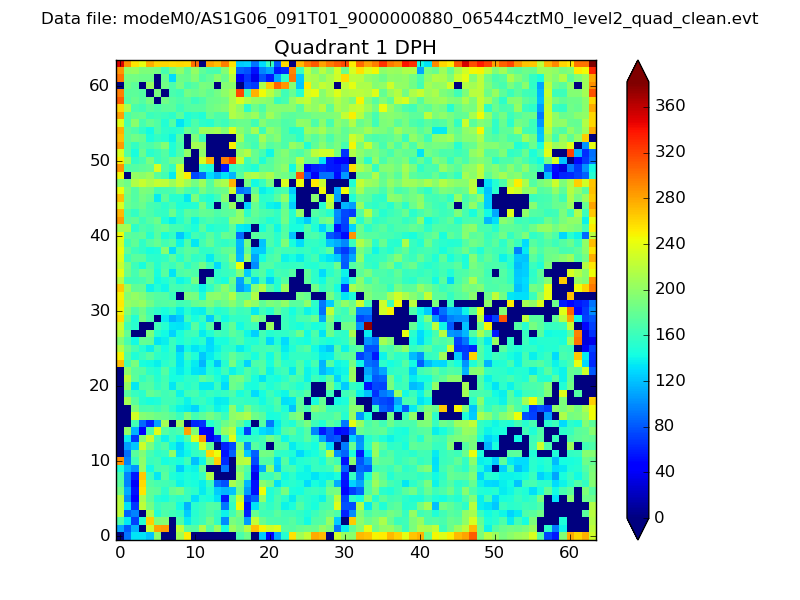 |
Quadrant B |
|---|---|---|---|
| Quadrant D | 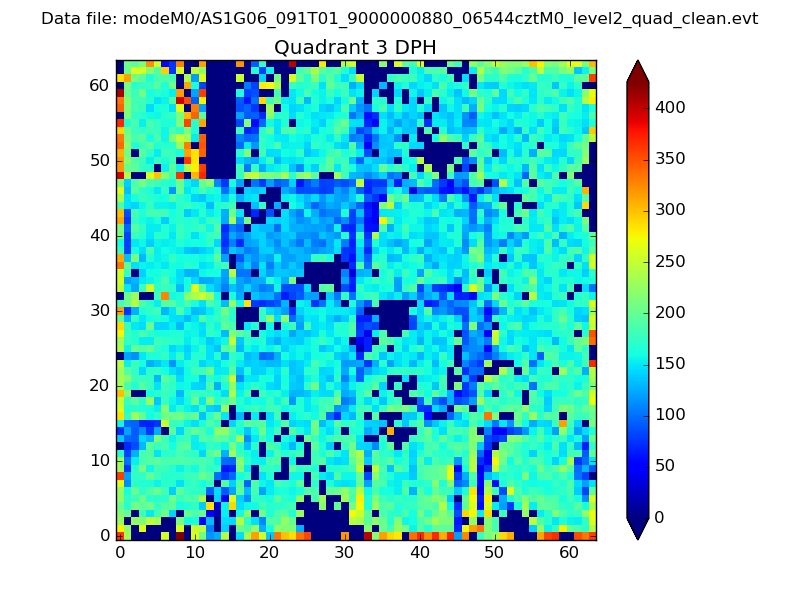 |
 |
Quadrant C |
| Plot type | Count rate plots | Images |
|---|---|---|
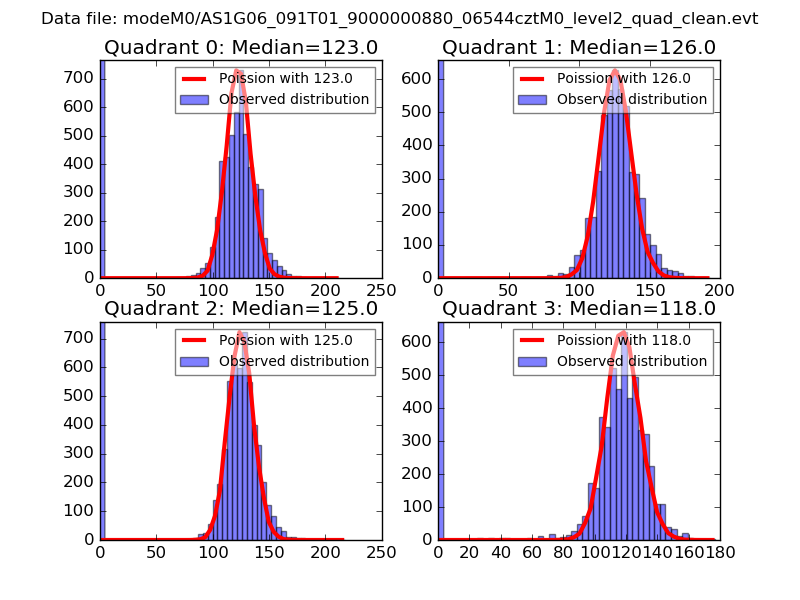
| Comparison with Poisson distribution Blue bars denote a histogram of data divided into 1 sec bins. Red curve is a Poisson curve with rate = median count rate of data. |
 |
 |
| Quadrant-wise count rates Data is divided into 100 sec bins |
 |
|
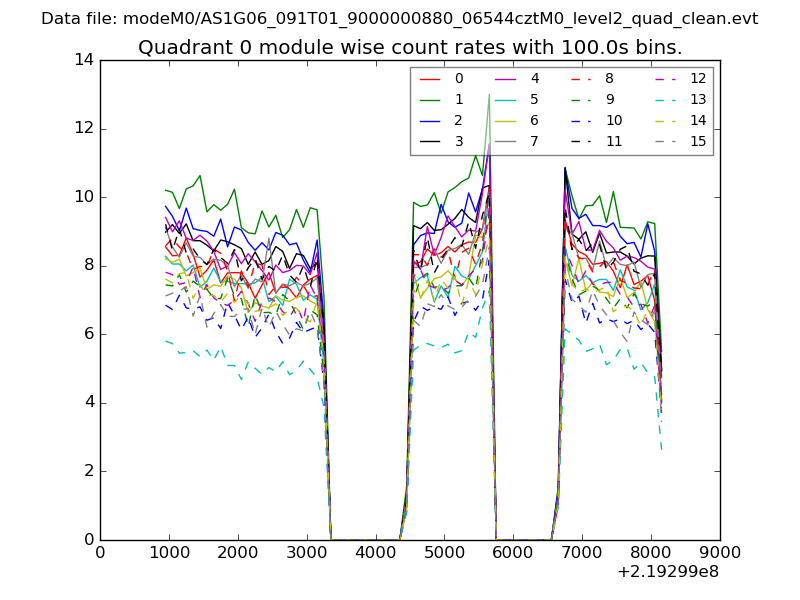
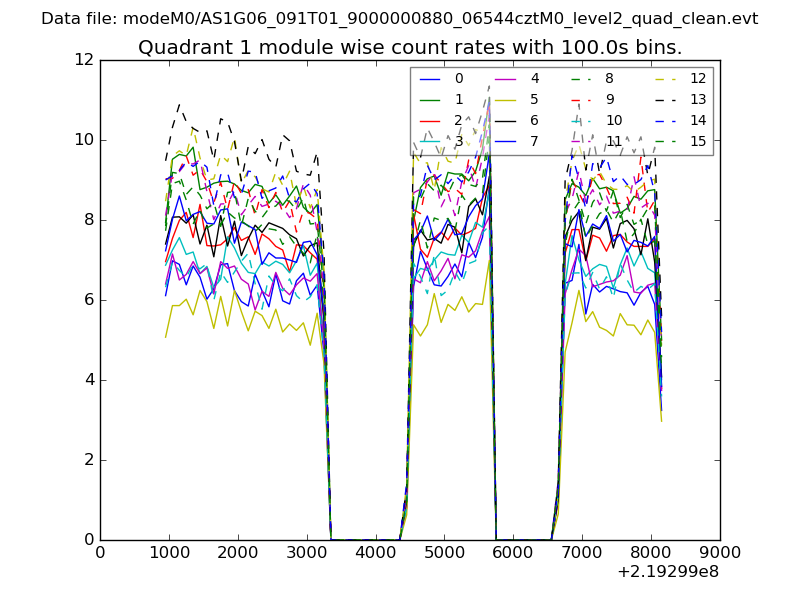
| Module-wise count rates for Quadrant A Data is divided into 100 sec bins |
 |
 |
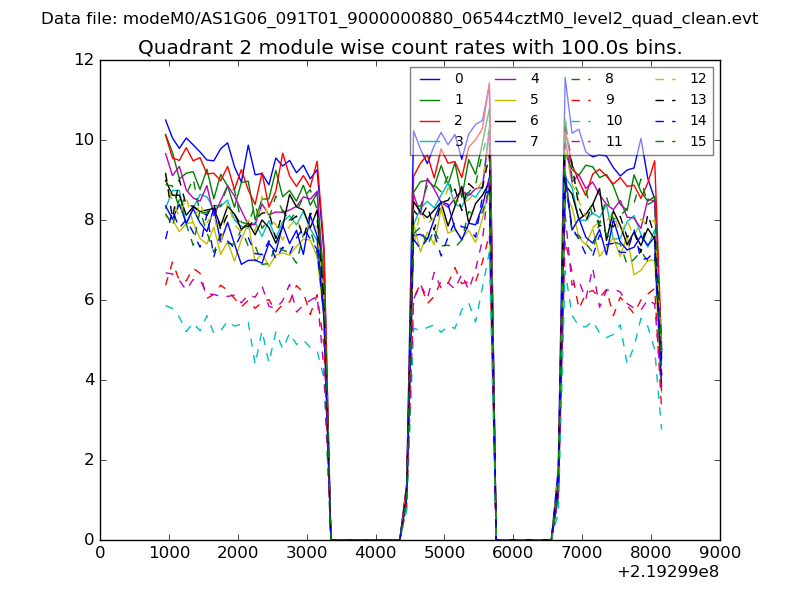
| Module-wise count rates for Quadrant B Data is divided into 100 sec bins |
 |
 |
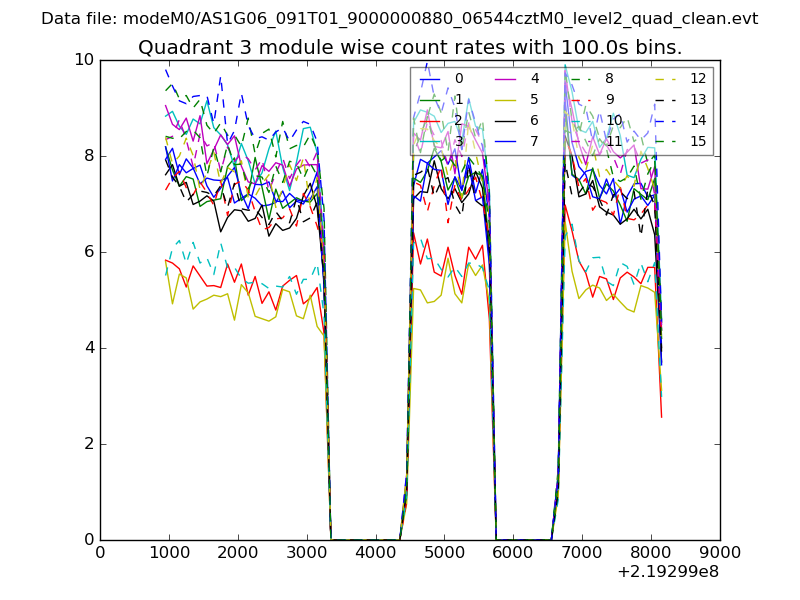
| Module-wise count rates for Quadrant C Data is divided into 100 sec bins |
 |
 |
| Module-wise count rates for Quadrant D Data is divided into 100 sec bins |
 |
 |
| Parameter | Plot |
|---|---|
| CZT HV Monitor | 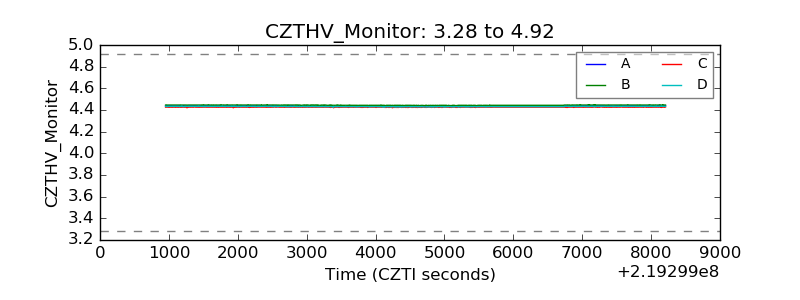 |
| D_VDD | 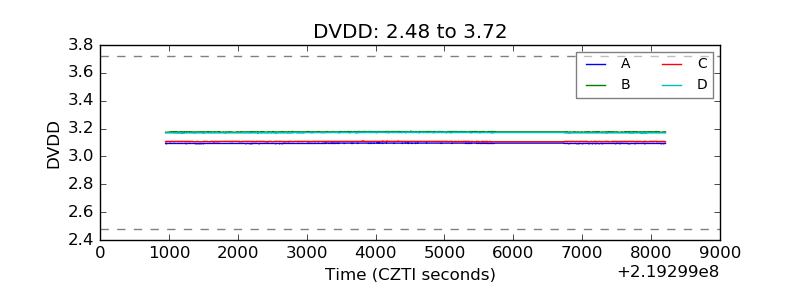 |
| Temperature 1 | 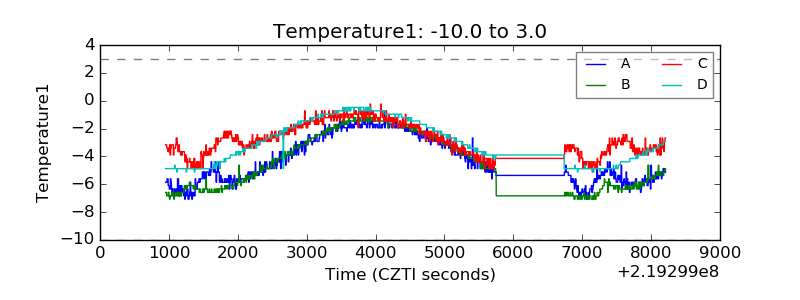 |
| Veto HV Monitor | 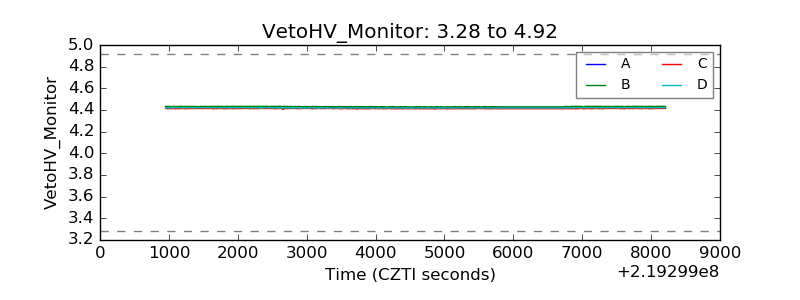 |
| Veto LLD | 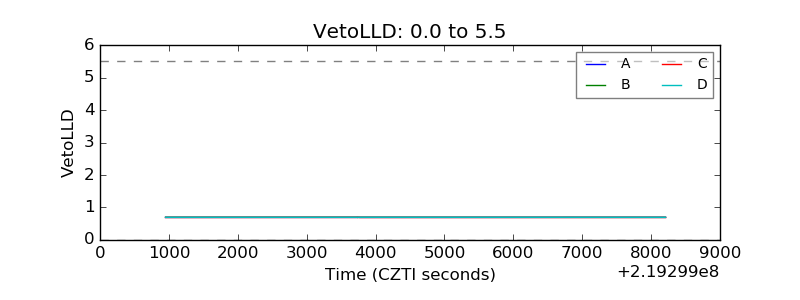 |
| Alpha Counter | 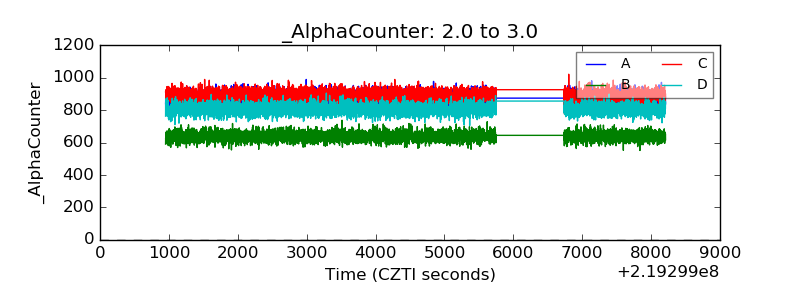 |
| _CPM_Rate | 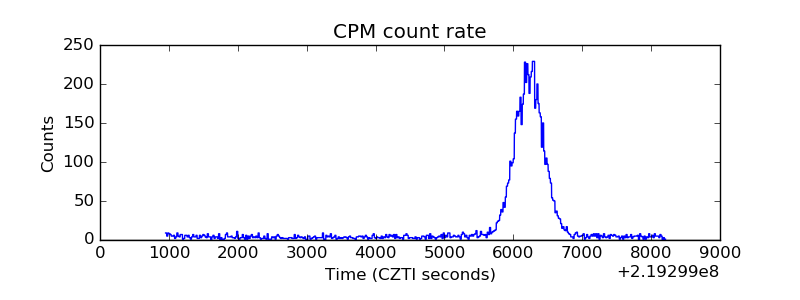 |
| CZT Counter | 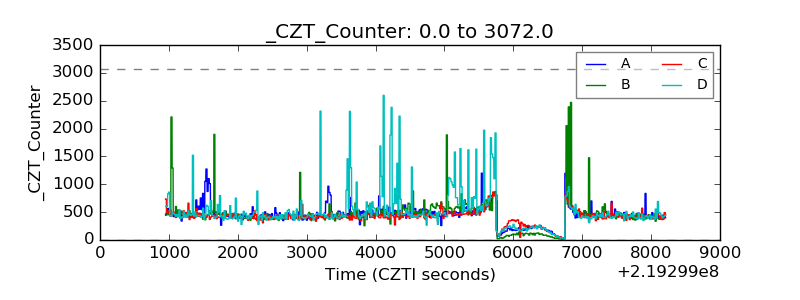 |
| +2.5 Volts monitor | 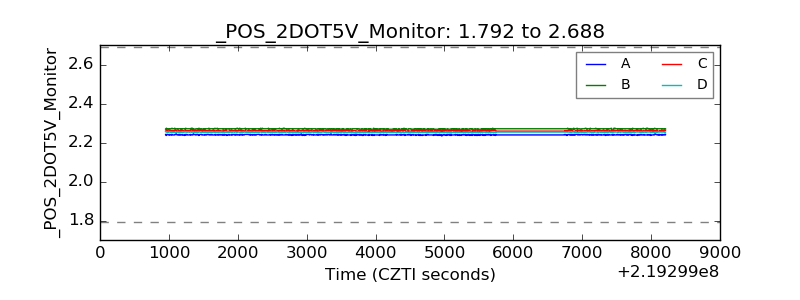 |
| +5 Volts monitor |  |
| _ROLL_ROT | 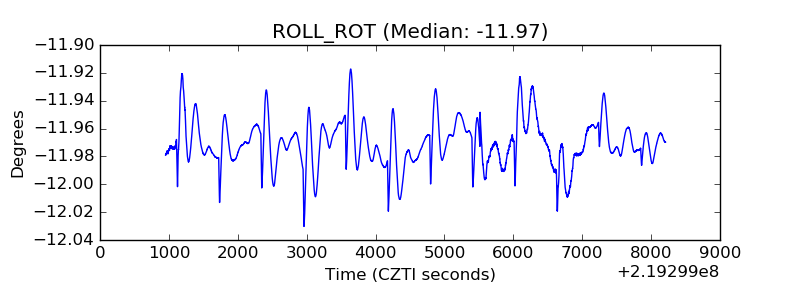 |
| _Roll_DEC | 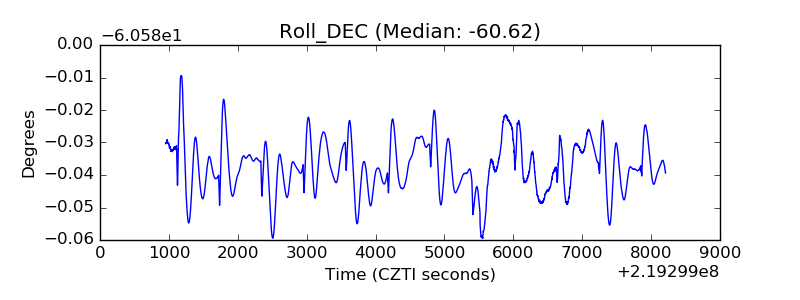 |
| _Roll_RA | 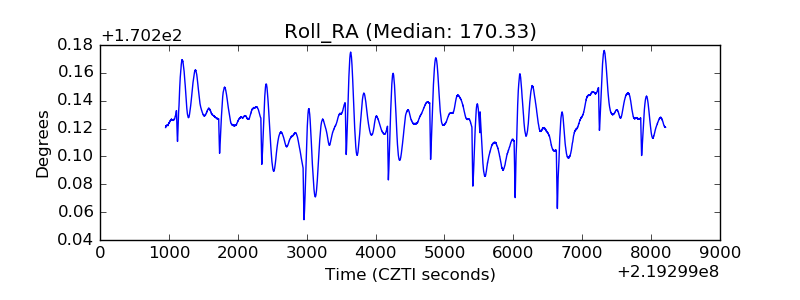 |
| Veto Counter | 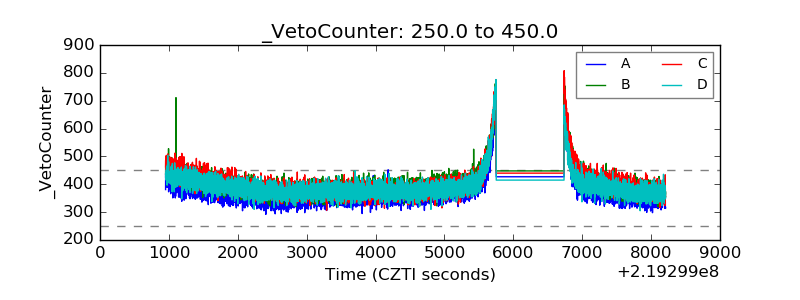 |