| Param | Original file | Final file |
|---|---|---|
| Filename | modeM0/AS1G06_091T01_9000000880_06545cztM0_level2.evt | modeM0/AS1G06_091T01_9000000880_06545cztM0_level2_quad_clean.evt |
| Size (bytes) | 479,908,800 | 99,239,040 |
| Size | 457.7 MB | 94.6 MB |
| Events in quadrant A | 3,865,410 | 636,394 |
| Events in quadrant B | 3,236,416 | 655,199 |
| Events in quadrant C | 2,867,436 | 646,833 |
| Events in quadrant D | 4,120,312 | 610,501 |
| Mode M0 | |||
|---|---|---|---|
| Quadrant | BADHDUFLAG | Total packets | Discarded packets |
| A | 0 | 15951 | 2 |
| B | 0 | 14040 | 1 |
| C | 0 | 13305 | 1 |
| D | 0 | 16886 | 1 |
| Mode M9 | |||
|---|---|---|---|
| Quadrant | BADHDUFLAG | Total packets | Discarded packets |
| A | 0 | 6 | 0 |
| B | 0 | 6 | 0 |
| C | 0 | 6 | 0 |
| D | 0 | 6 | 0 |
| Mode SS | |||
|---|---|---|---|
| Quadrant | BADHDUFLAG | Total packets | Discarded packets |
| A | 0 | 132 | 0 |
| B | 0 | 132 | 0 |
| C | 0 | 132 | 0 |
| D | 0 | 132 | 0 |
| Quadrant | Total seconds | Saturated seconds | Saturation percentage |
|---|---|---|---|
| A | 6547 | 109 | 1.664885% |
| B | 6547 | 106 | 1.619062% |
| C | 6547 | 84 | 1.283030% |
| D | 6547 | 389 | 5.941653% |
Noise dominated data is calculated using 1-second bins in cleaned event files. If a bin has >2000 counts, and if more than 50% of those come from <1% of pixels, then it is considered to be noise-dominated and hence unusable.
| Quadrant | # 1 sec bins | Bins with >0 counts | Bins with >2000 counts | High rate bins dominated by noise | Noise dominated (total time) | Noise dominated (detector-on time) | Marked lightcurve |
|---|---|---|---|---|---|---|---|
| A | 7127 | 6549 | 0 | 0 | 0.00% | 0.00% | 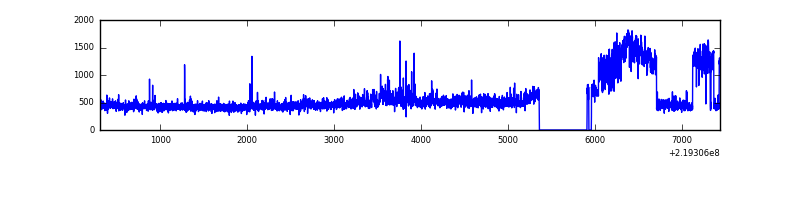 |
| B | 7127 | 6549 | 8 | 8 | 0.11% | 0.12% | 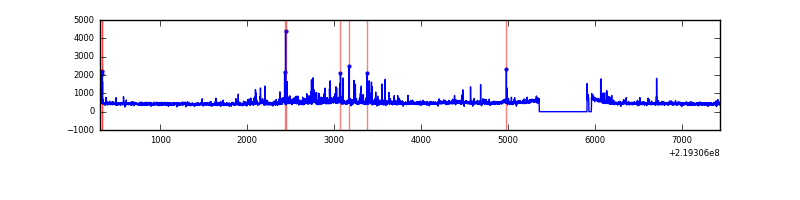 |
| C | 7127 | 6549 | 0 | 0 | 0.00% | 0.00% | 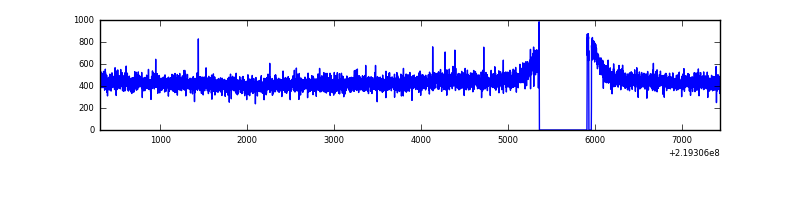 |
| D | 7127 | 6549 | 201 | 201 | 2.82% | 3.07% | 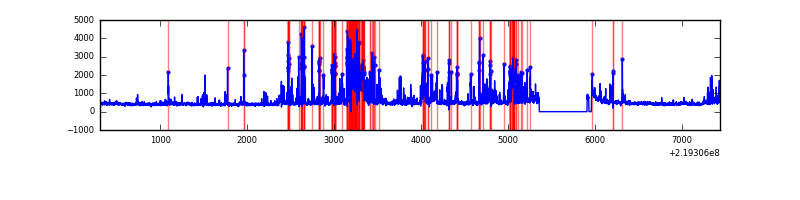 |
Top three noisy pixels from each quadrant. If the there are fewer than three noisy pixels in the level2.evt file, extra rows are filled as -1
| Pixel properties | Quadrant properties | ||||||
|---|---|---|---|---|---|---|---|
| Quadrant | DetID | PixID | Counts | Sigma | Mean | Median | Sigma |
| A | 15 | 236 | 783177 | 5199.04 | 739 | 722 | 150.5 |
| A | 8 | 15 | 191108 | 1265.02 | 739 | 722 | 150.5 |
| A | 14 | 111 | 32934 | 214.03 | 739 | 722 | 150.5 |
| B | 4 | 170 | 150652 | 1055.89 | 747 | 727 | 142.0 |
| B | 0 | 214 | 66299 | 461.81 | 747 | 727 | 142.0 |
| B | 0 | 219 | 34664 | 239.01 | 747 | 727 | 142.0 |
| C | 13 | 61 | 5749 | 29.38 | 732 | 733 | 170.8 |
| C | 8 | 128 | 5339 | 26.97 | 732 | 733 | 170.8 |
| C | 8 | 112 | 2636 | 11.14 | 732 | 733 | 170.8 |
| D | 2 | 33 | 798547 | 4560.18 | 714 | 691 | 175.0 |
| D | 2 | 152 | 266352 | 1518.39 | 714 | 691 | 175.0 |
| D | 14 | 34 | 67504 | 381.87 | 714 | 691 | 175.0 |
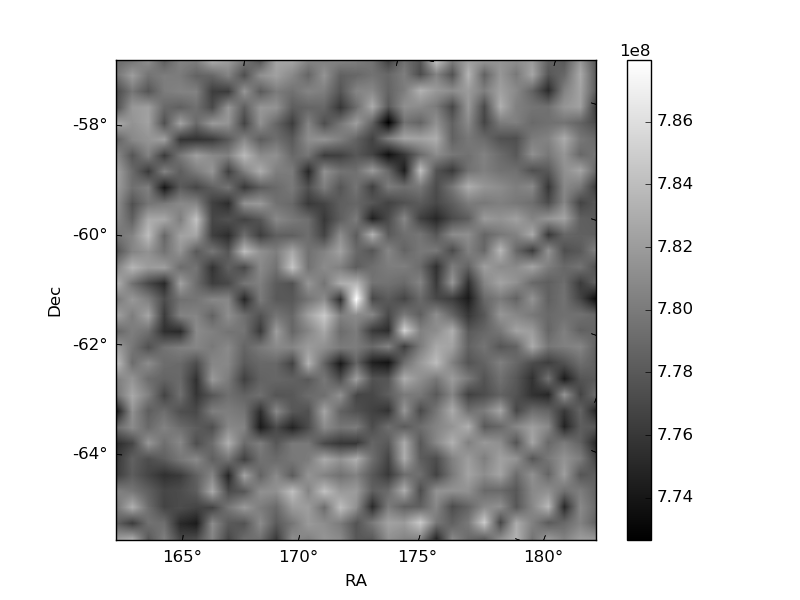
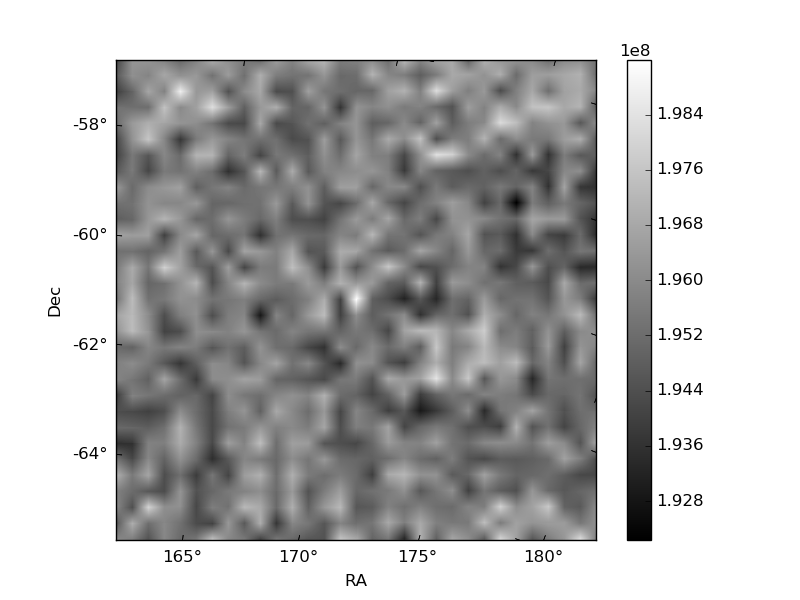
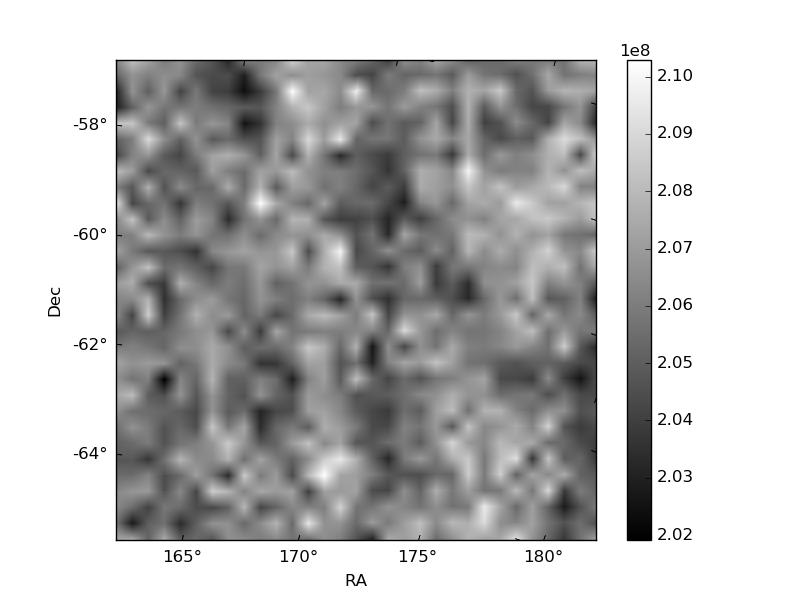
Histogram calculated using DETX and DETY for each event in the final _common_clean file
| Quadrant A | 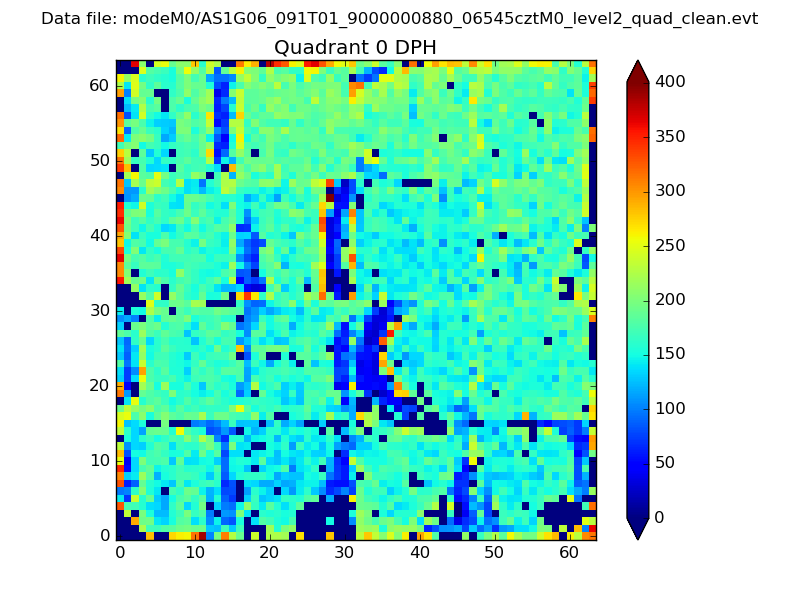 |
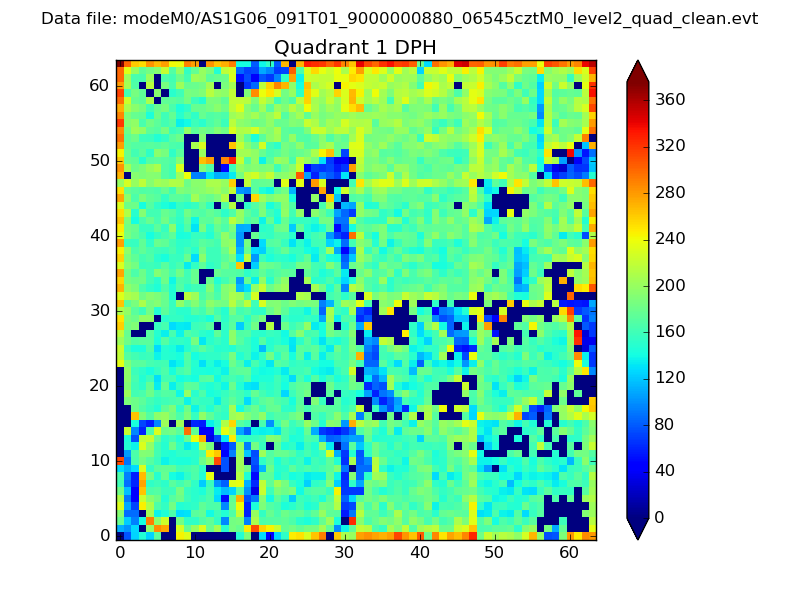 |
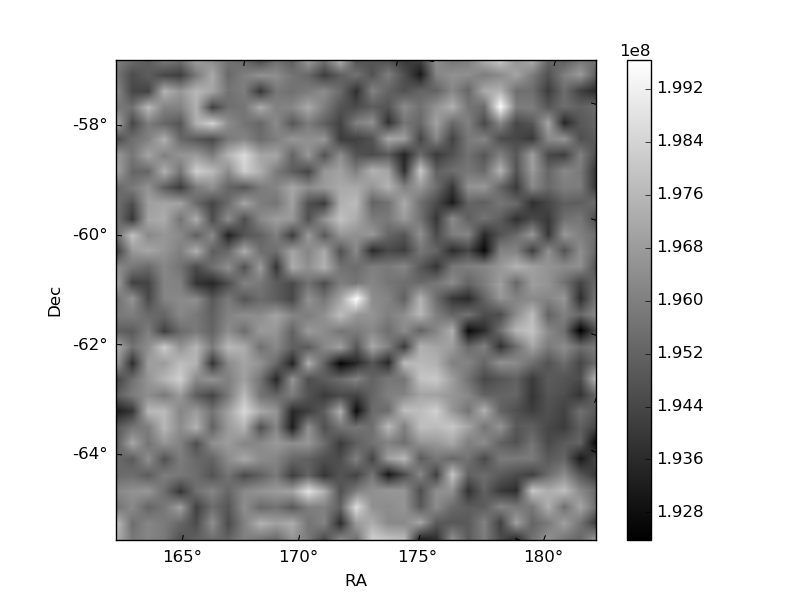
Quadrant B |
|---|---|---|---|
| Quadrant D | 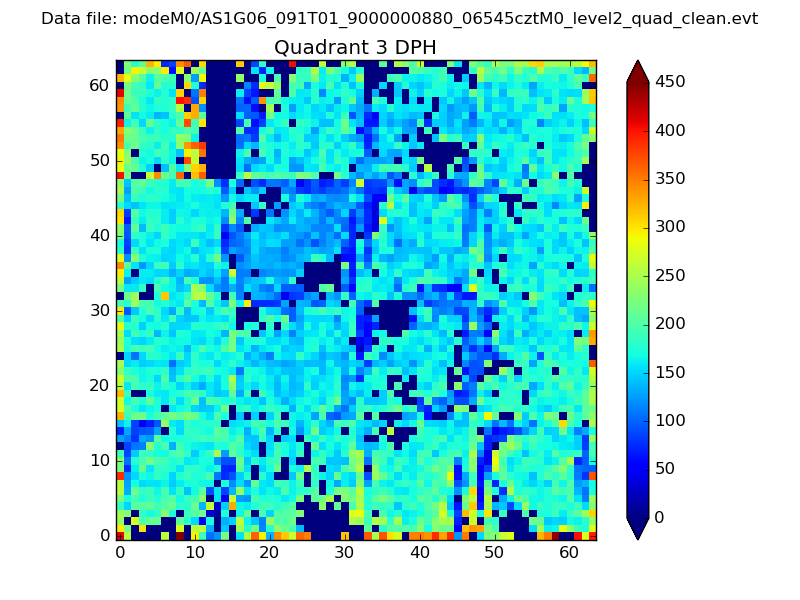 |
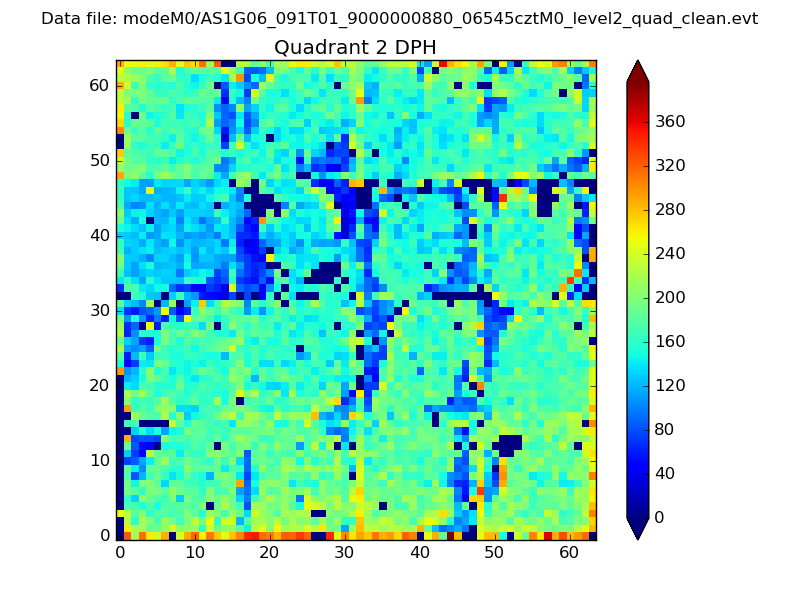 |
Quadrant C |
| Plot type | Count rate plots | Images |
|---|---|---|
| Comparison with Poisson distribution Blue bars denote a histogram of data divided into 1 sec bins. Red curve is a Poisson curve with rate = median count rate of data. |
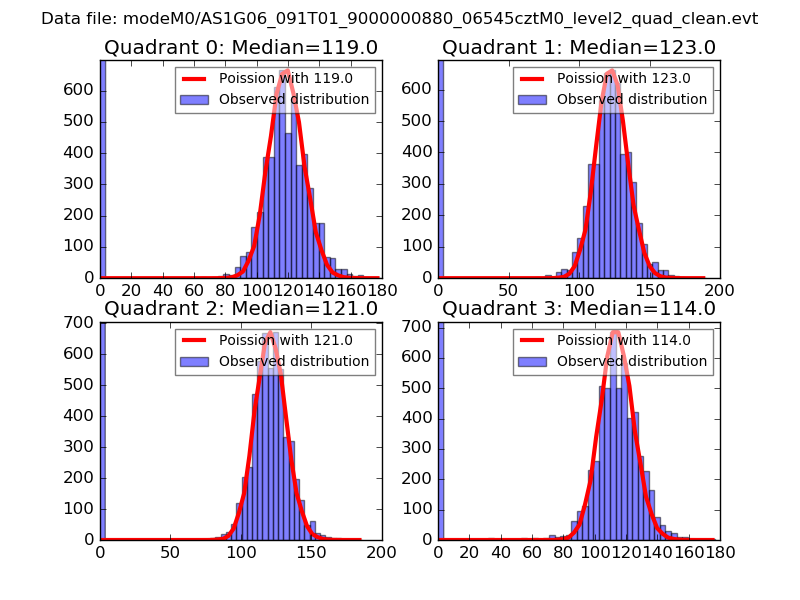 |
 |
| Quadrant-wise count rates Data is divided into 100 sec bins |
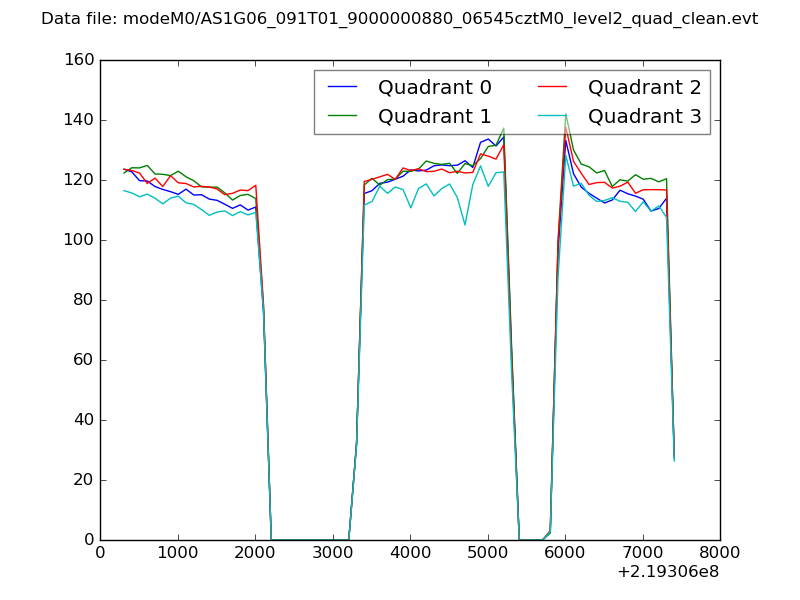 |
|
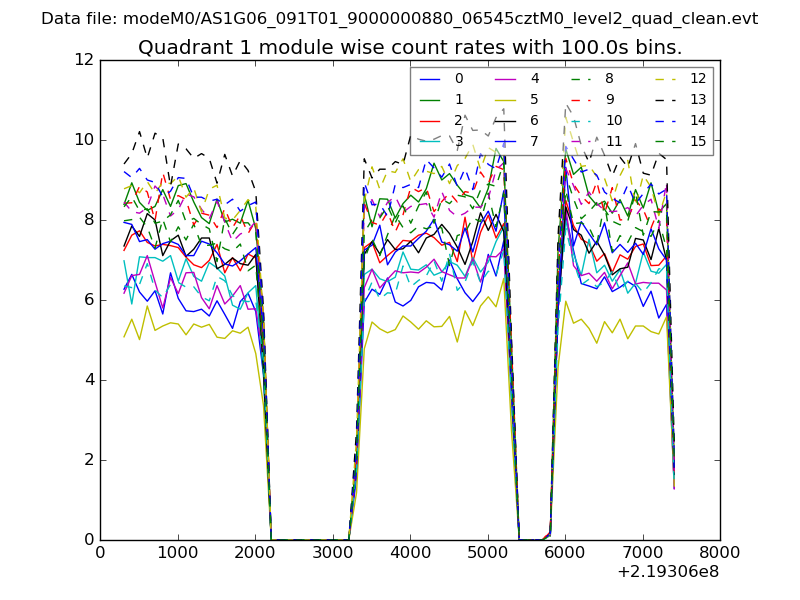
| Module-wise count rates for Quadrant A Data is divided into 100 sec bins |
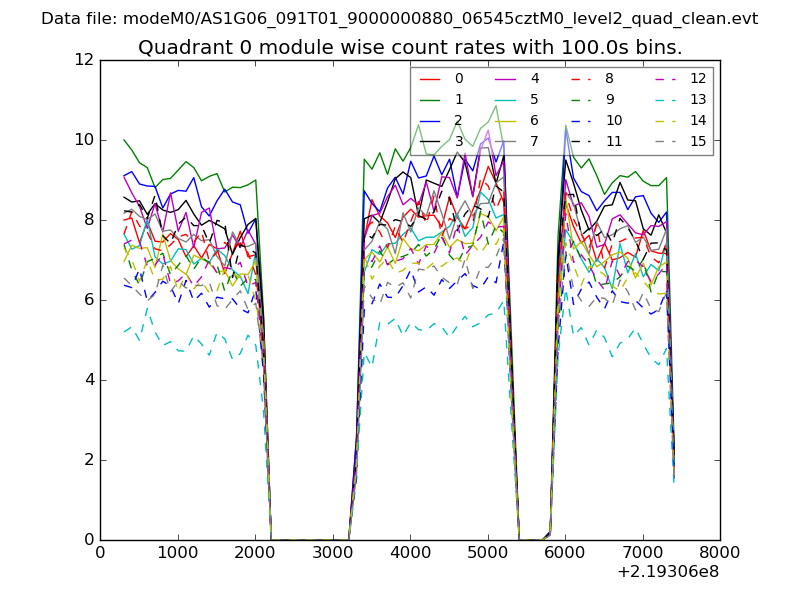 |
 |
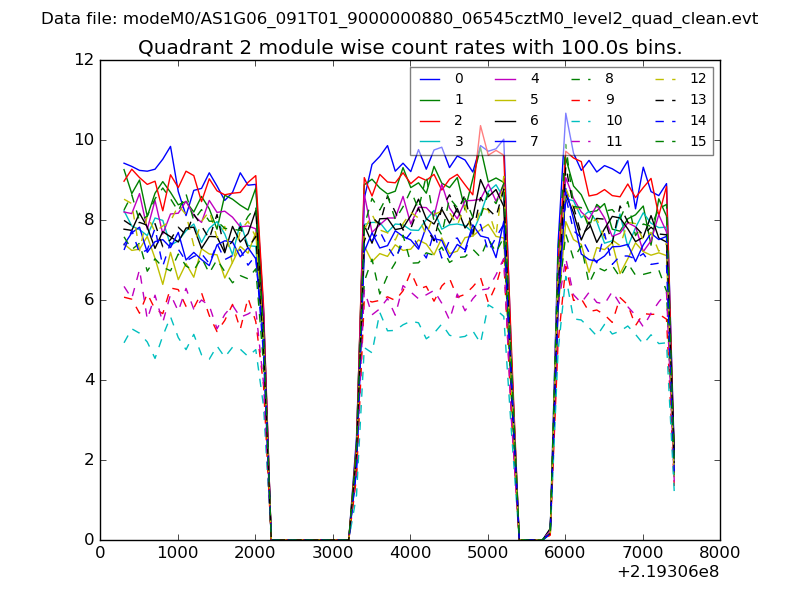
| Module-wise count rates for Quadrant B Data is divided into 100 sec bins |
 |
 |
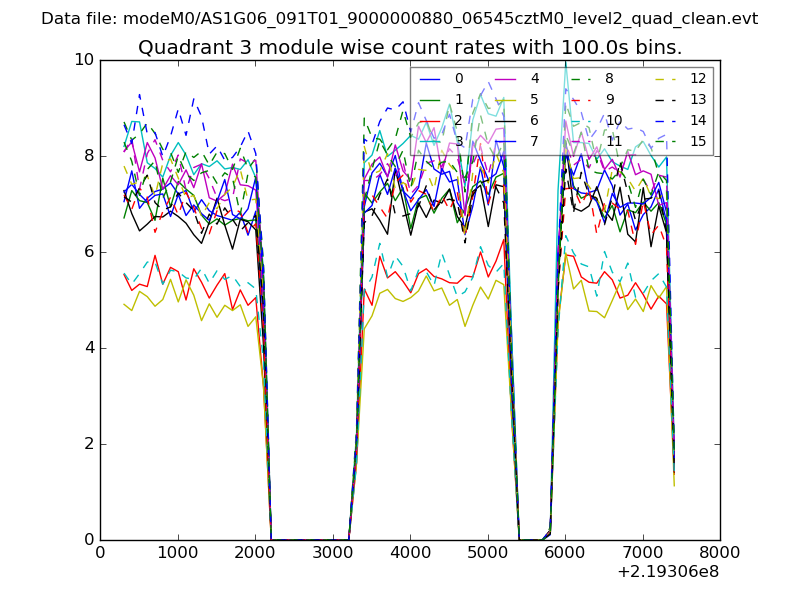
| Module-wise count rates for Quadrant C Data is divided into 100 sec bins |
 |
 |
| Module-wise count rates for Quadrant D Data is divided into 100 sec bins |
 |
 |
| Parameter | Plot |
|---|---|
| CZT HV Monitor | 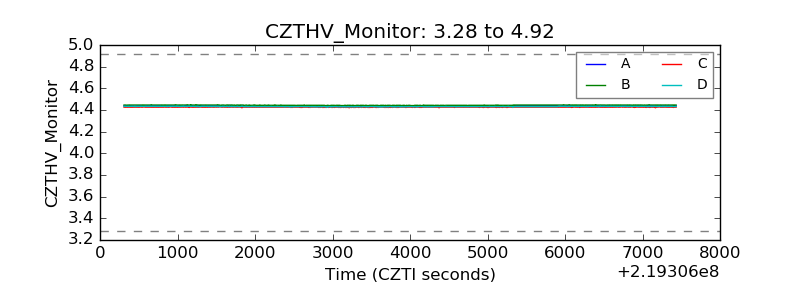 |
| D_VDD | 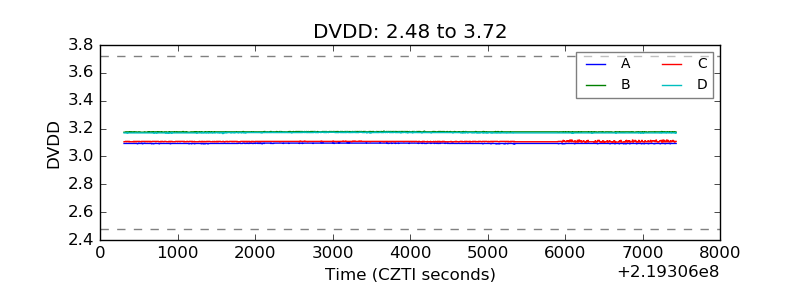 |
| Temperature 1 | 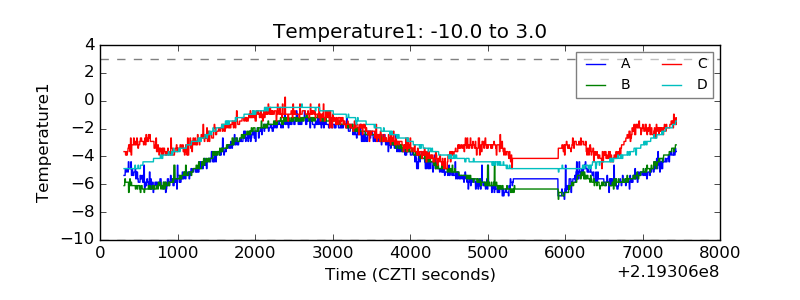 |
| Veto HV Monitor | 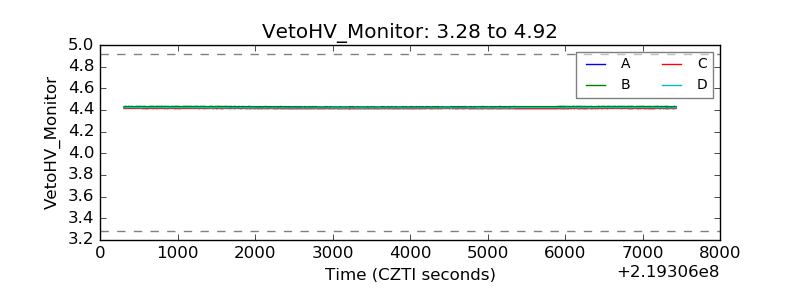 |
| Veto LLD | 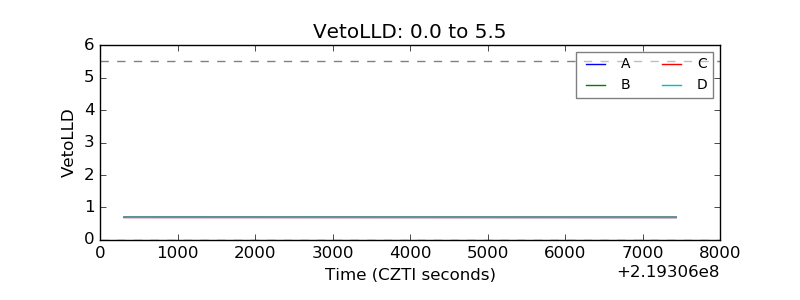 |
| Alpha Counter | 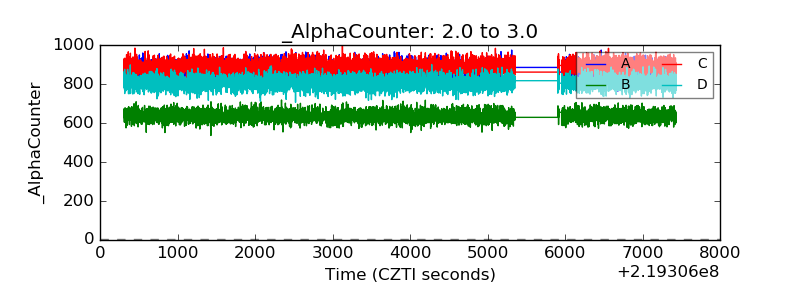 |
| _CPM_Rate | 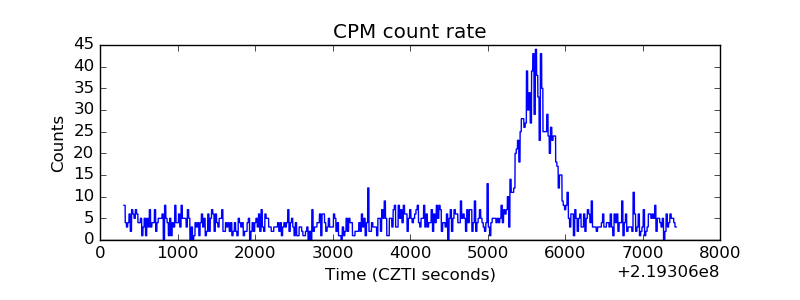 |
| CZT Counter | 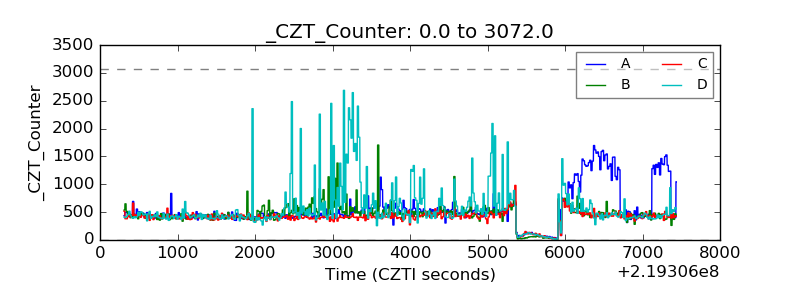 |
| +2.5 Volts monitor |  |
| +5 Volts monitor |  |
| _ROLL_ROT | 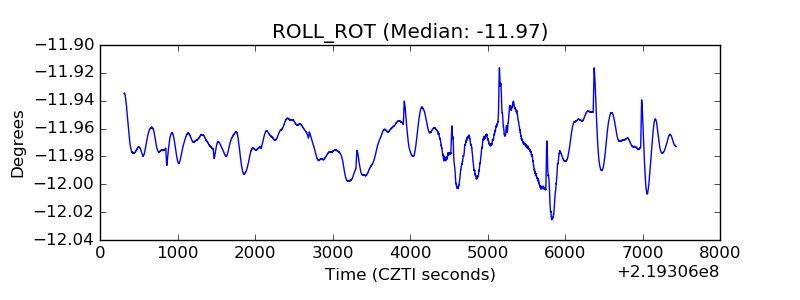 |
| _Roll_DEC | 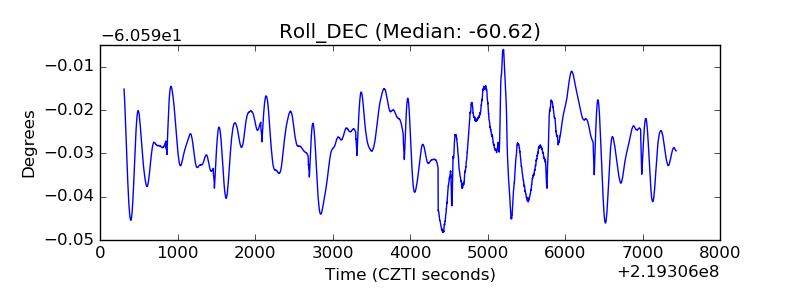 |
| _Roll_RA | 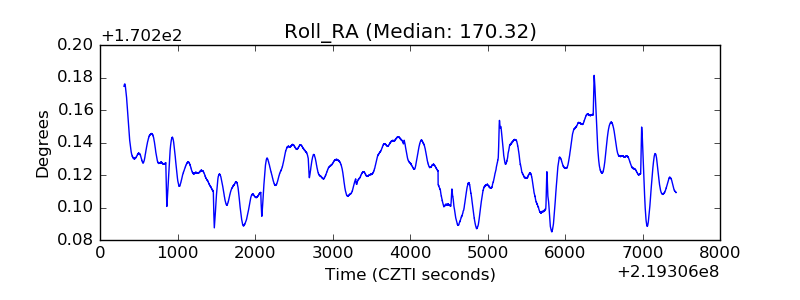 |
| Veto Counter | 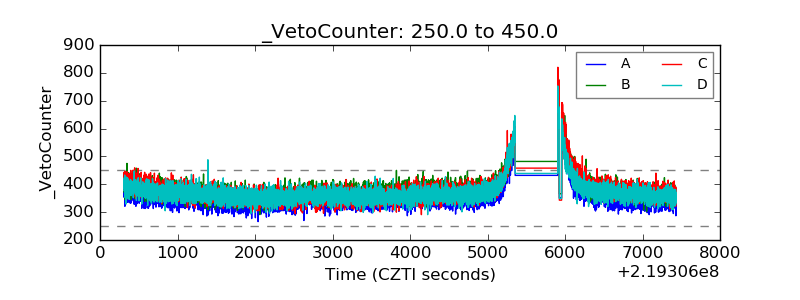 |