| Param | Original file | Final file |
|---|---|---|
| Filename | modeM0/AS1G06_091T01_9000000880_06547cztM0_level2.evt | modeM0/AS1G06_091T01_9000000880_06547cztM0_level2_quad_clean.evt |
| Size (bytes) | 509,889,600 | 105,284,160 |
| Size | 486.3 MB | 100.4 MB |
| Events in quadrant A | 4,024,396 | 675,590 |
| Events in quadrant B | 3,776,191 | 688,587 |
| Events in quadrant C | 3,137,438 | 689,551 |
| Events in quadrant D | 4,031,708 | 650,094 |
| Mode M0 | |||
|---|---|---|---|
| Quadrant | BADHDUFLAG | Total packets | Discarded packets |
| A | 0 | 16692 | 91 |
| B | 0 | 15997 | 57 |
| C | 0 | 14462 | 47 |
| D | 0 | 16923 | 100 |
| Mode SS | |||
|---|---|---|---|
| Quadrant | BADHDUFLAG | Total packets | Discarded packets |
| A | 0 | 140 | 0 |
| B | 0 | 140 | 0 |
| C | 0 | 140 | 0 |
| D | 0 | 140 | 0 |
| Quadrant | Total seconds | Saturated seconds | Saturation percentage |
|---|---|---|---|
| A | 6943 | 345 | 4.969034% |
| B | 6950 | 464 | 6.676259% |
| C | 6949 | 260 | 3.741546% |
| D | 6941 | 428 | 6.166258% |
Noise dominated data is calculated using 1-second bins in cleaned event files. If a bin has >2000 counts, and if more than 50% of those come from <1% of pixels, then it is considered to be noise-dominated and hence unusable.
| Quadrant | # 1 sec bins | Bins with >0 counts | Bins with >2000 counts | High rate bins dominated by noise | Noise dominated (total time) | Noise dominated (detector-on time) | Marked lightcurve |
|---|---|---|---|---|---|---|---|
| A | 6973 | 6972 | 5 | 5 | 0.07% | 0.07% | 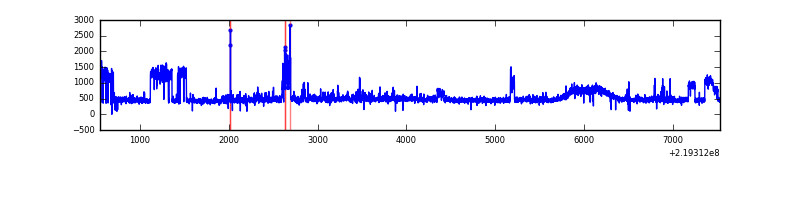 |
| B | 6973 | 6972 | 84 | 84 | 1.20% | 1.20% |  |
| C | 6973 | 6973 | 0 | 0 | 0.00% | 0.00% | 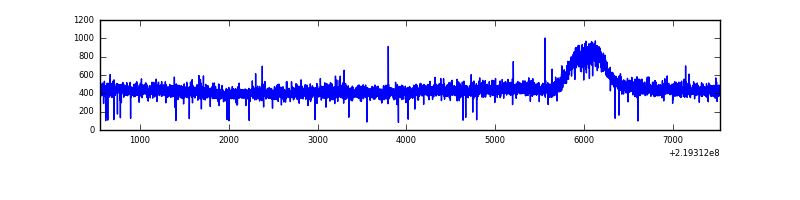 |
| D | 6973 | 6972 | 114 | 114 | 1.63% | 1.64% | 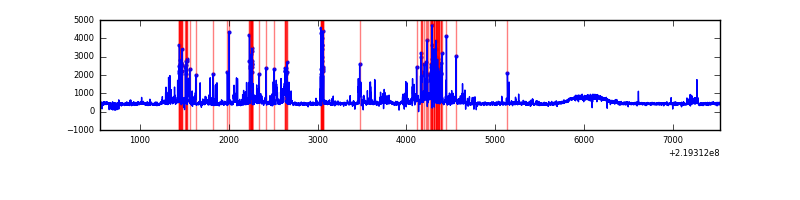 |
Top three noisy pixels from each quadrant. If the there are fewer than three noisy pixels in the level2.evt file, extra rows are filled as -1
| Pixel properties | Quadrant properties | ||||||
|---|---|---|---|---|---|---|---|
| Quadrant | DetID | PixID | Counts | Sigma | Mean | Median | Sigma |
| A | 15 | 236 | 636339 | 3818.13 | 804 | 784 | 166.5 |
| A | 8 | 15 | 244039 | 1461.37 | 804 | 784 | 166.5 |
| A | 9 | 1 | 18179 | 104.5 | 804 | 784 | 166.5 |
| B | 10 | 245 | 182325 | 1158.01 | 810 | 786 | 156.8 |
| B | 4 | 48 | 157212 | 997.82 | 810 | 786 | 156.8 |
| B | 0 | 214 | 86295 | 545.45 | 810 | 786 | 156.8 |
| C | 8 | 128 | 12670 | 64.37 | 797 | 798 | 184.4 |
| C | 8 | 112 | 7792 | 37.92 | 797 | 798 | 184.4 |
| C | 13 | 61 | 6283 | 29.74 | 797 | 798 | 184.4 |
| D | 2 | 33 | 477902 | 2455.72 | 789 | 761 | 194.3 |
| D | 2 | 152 | 159862 | 818.85 | 789 | 761 | 194.3 |
| D | 2 | 63 | 126629 | 647.81 | 789 | 761 | 194.3 |
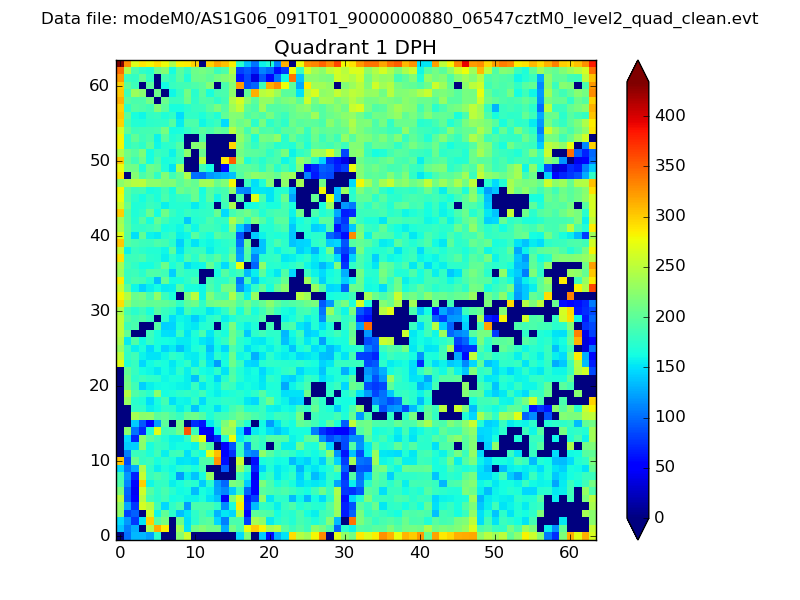
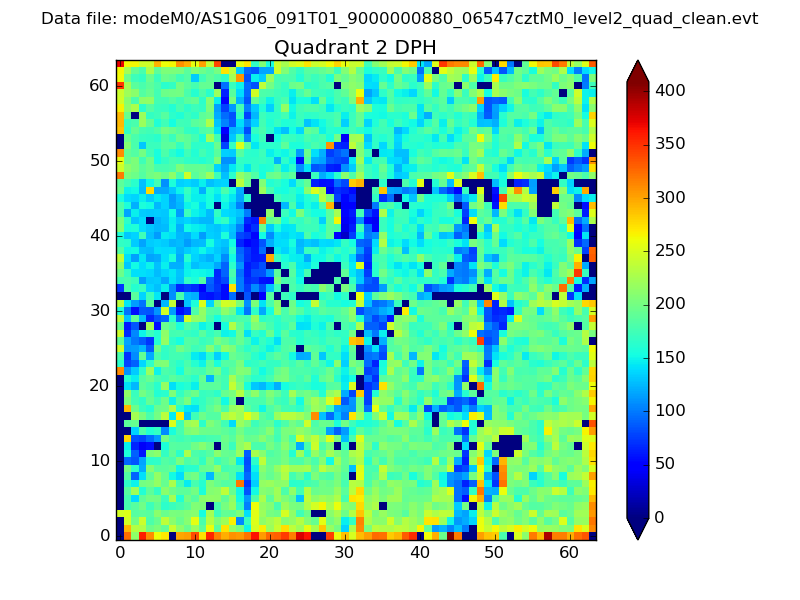
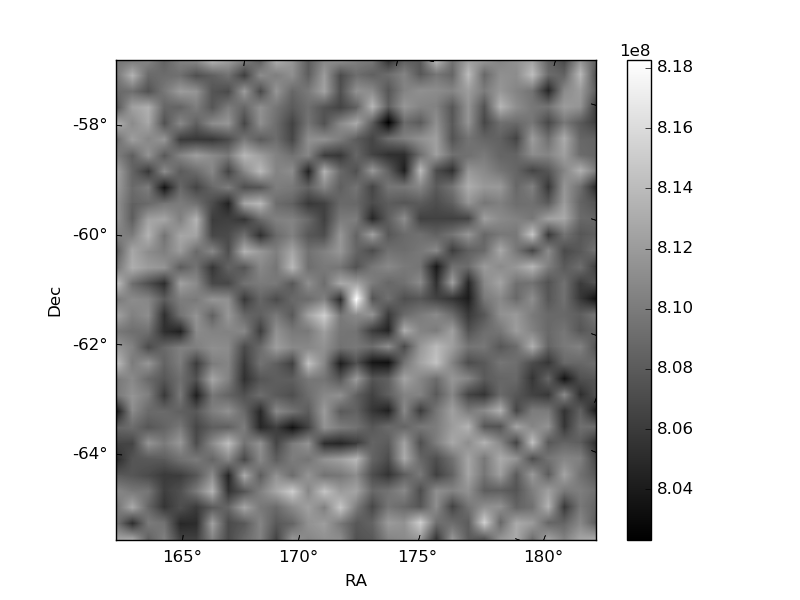
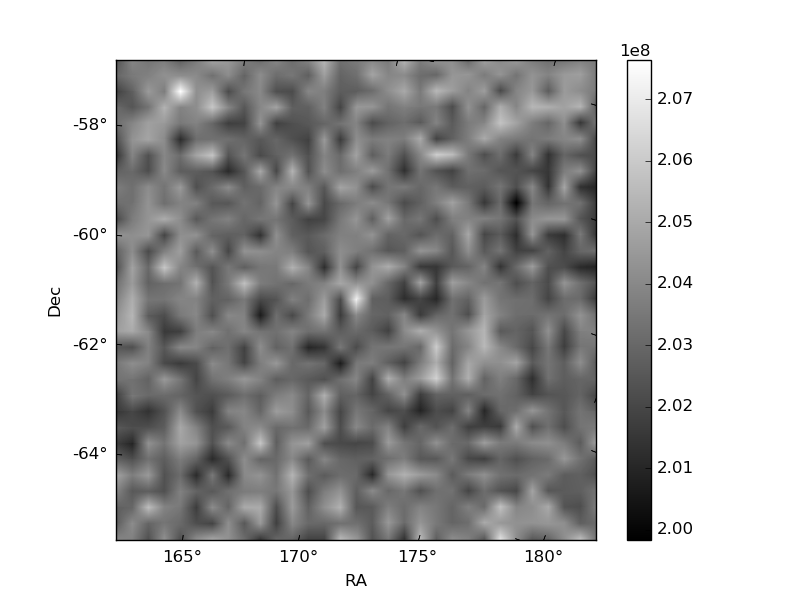
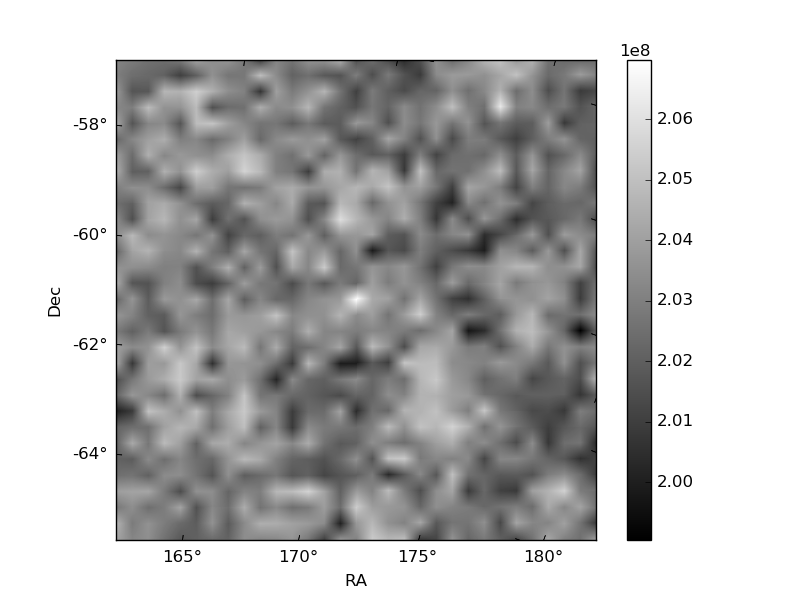
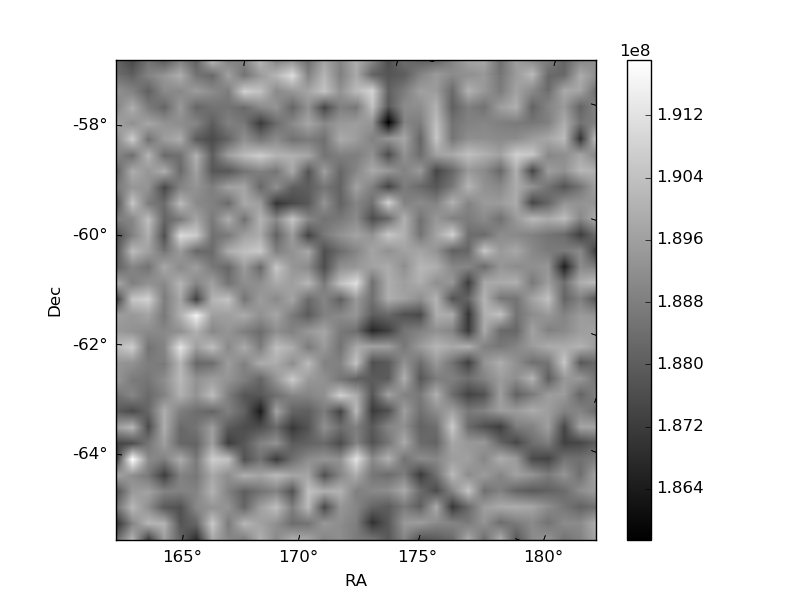
Histogram calculated using DETX and DETY for each event in the final _common_clean file
| Quadrant A | 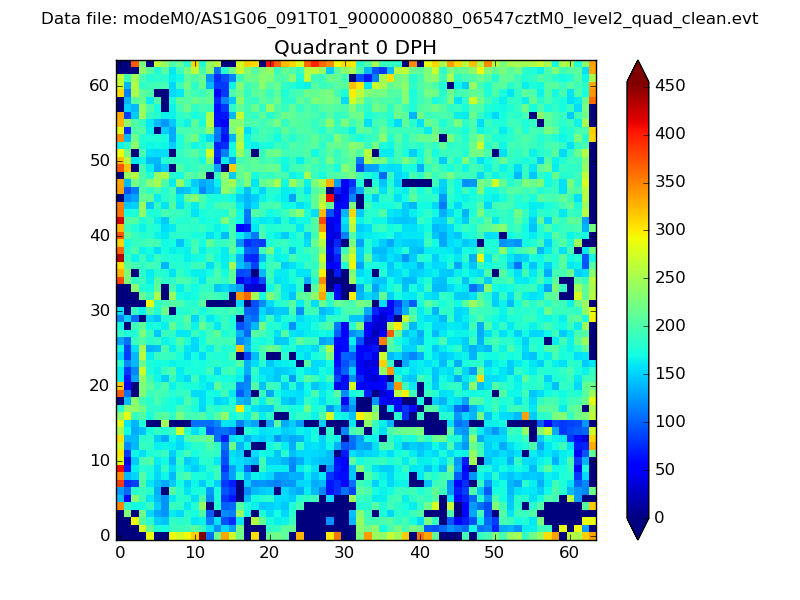 |
 |
Quadrant B |
|---|---|---|---|
| Quadrant D | 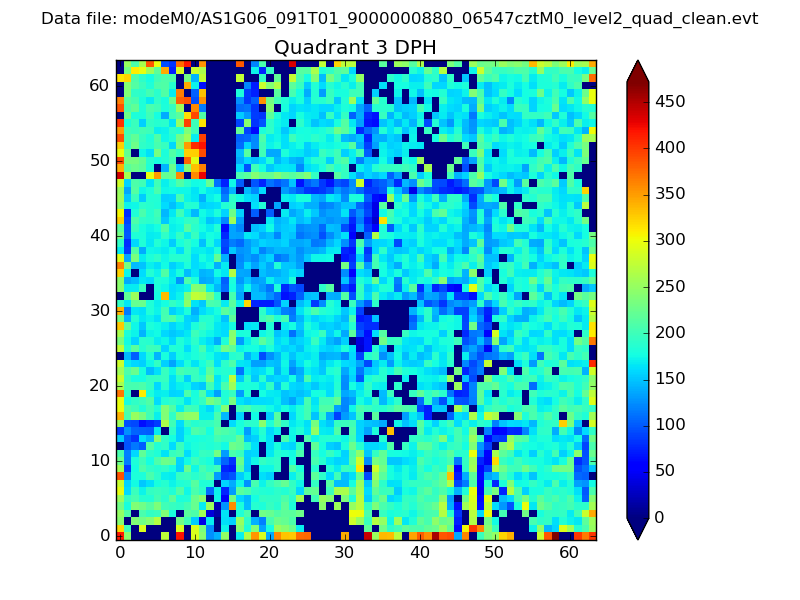 |
 |
Quadrant C |
| Plot type | Count rate plots | Images |
|---|---|---|
| Comparison with Poisson distribution Blue bars denote a histogram of data divided into 1 sec bins. Red curve is a Poisson curve with rate = median count rate of data. |
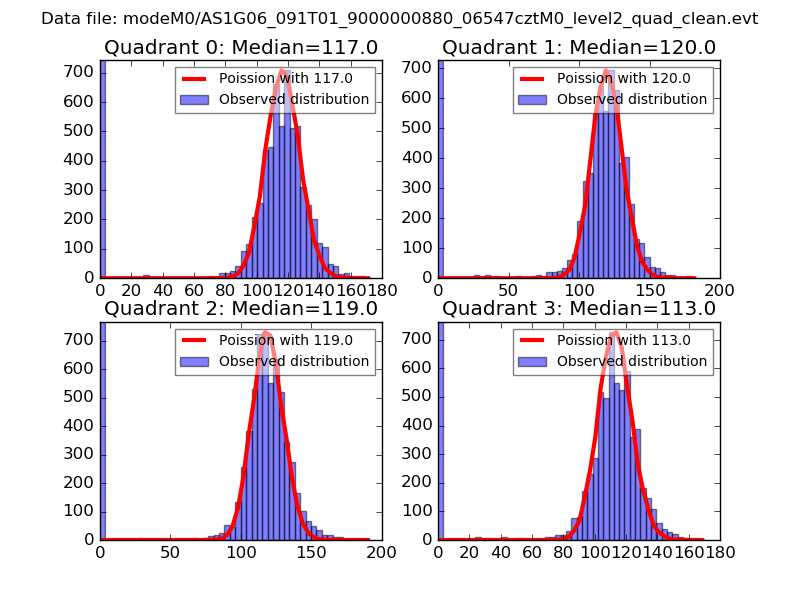 |
 |
| Quadrant-wise count rates Data is divided into 100 sec bins |
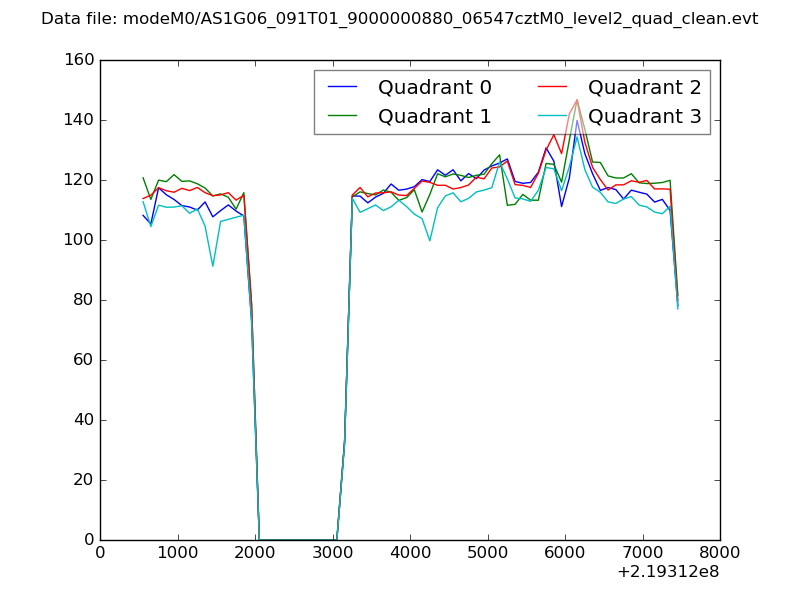 |
|
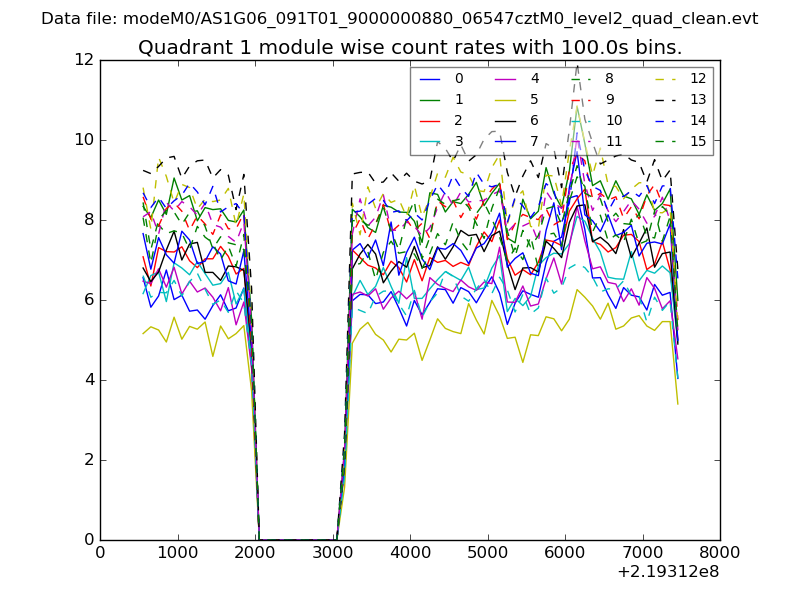
| Module-wise count rates for Quadrant A Data is divided into 100 sec bins |
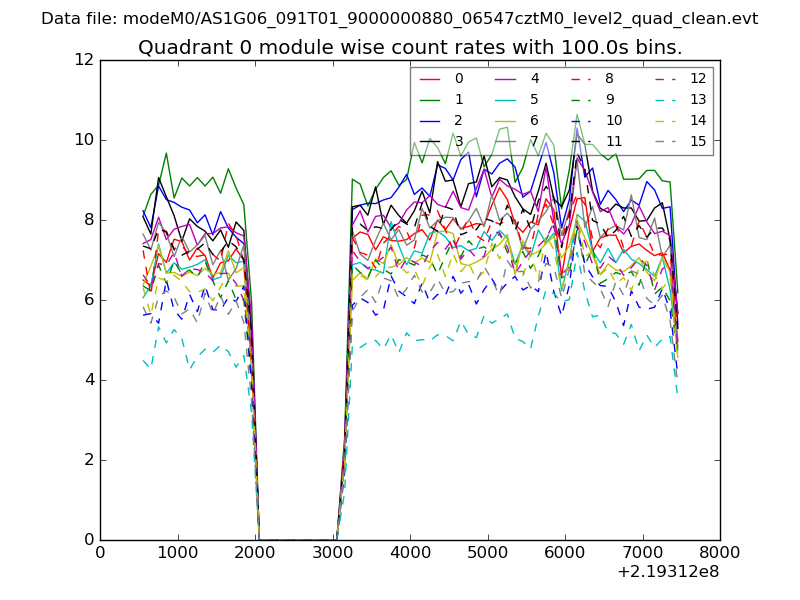 |
 |
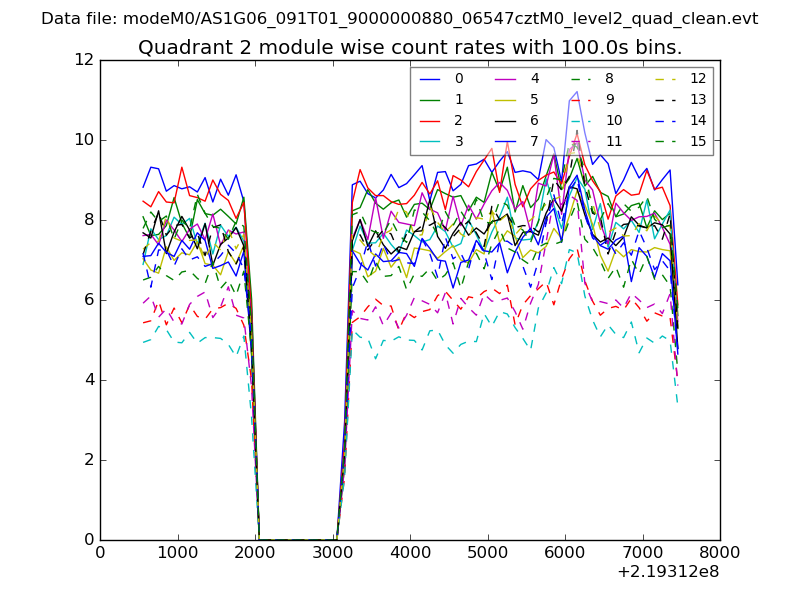
| Module-wise count rates for Quadrant B Data is divided into 100 sec bins |
 |
 |
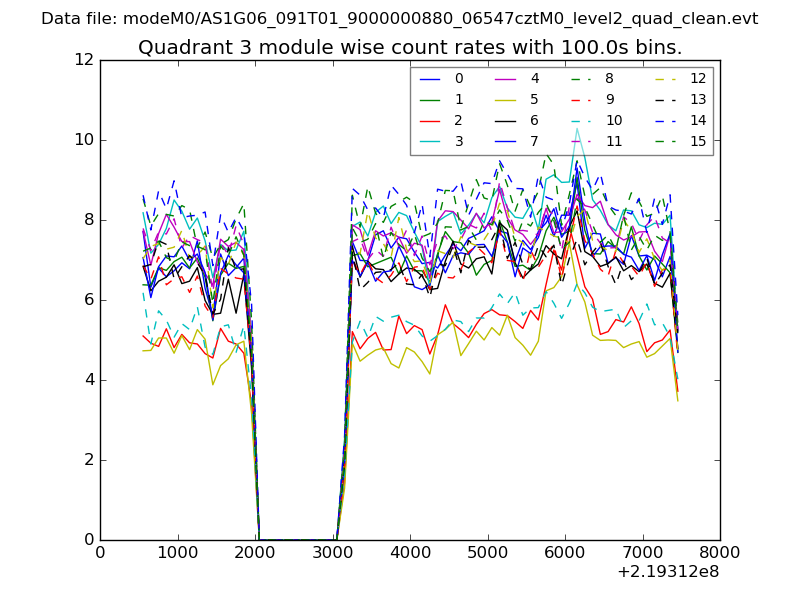
| Module-wise count rates for Quadrant C Data is divided into 100 sec bins |
 |
 |
| Module-wise count rates for Quadrant D Data is divided into 100 sec bins |
 |
 |
| Parameter | Plot |
|---|---|
| CZT HV Monitor | 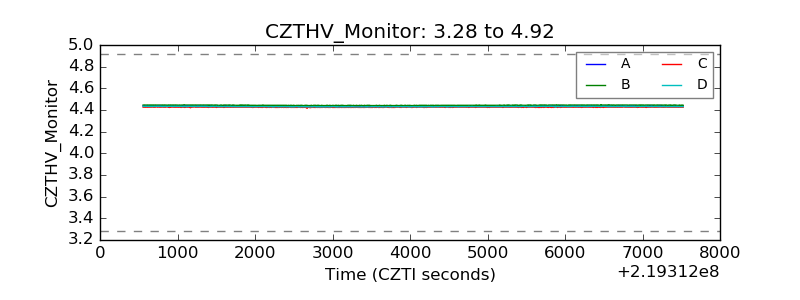 |
| D_VDD | 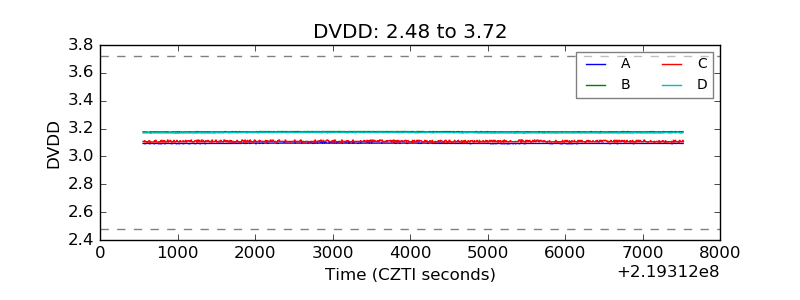 |
| Temperature 1 | 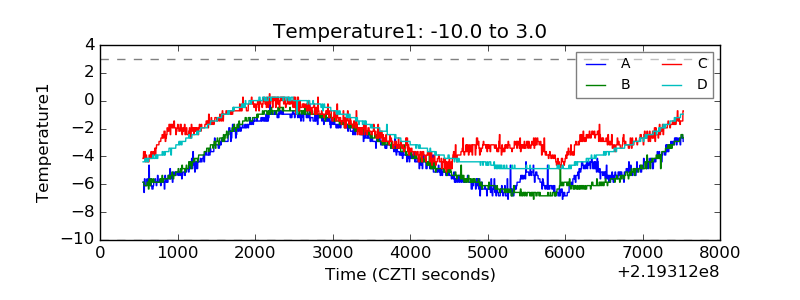 |
| Veto HV Monitor | 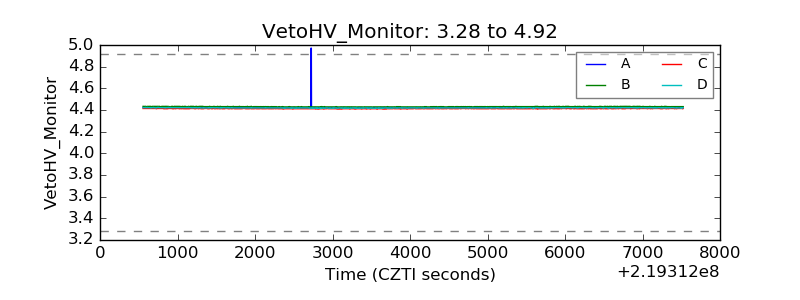 |
| Veto LLD | 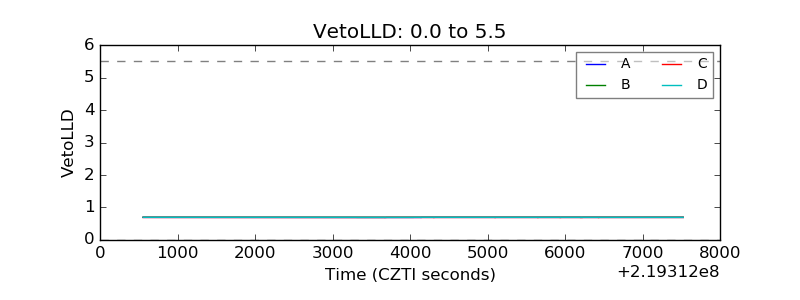 |
| Alpha Counter | 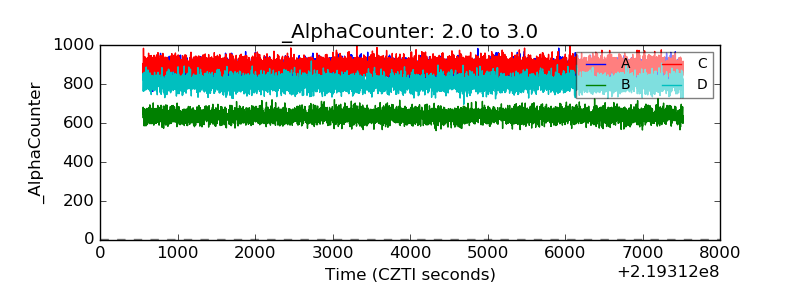 |
| _CPM_Rate | 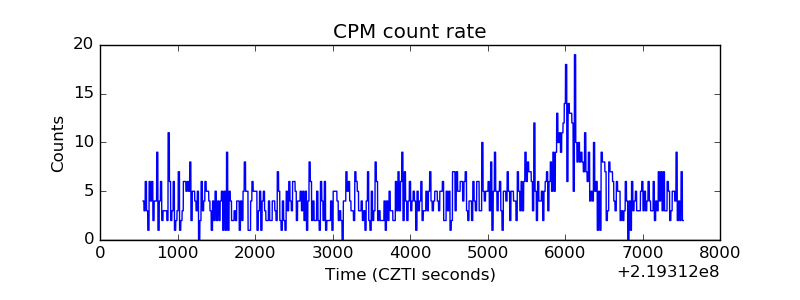 |
| CZT Counter | 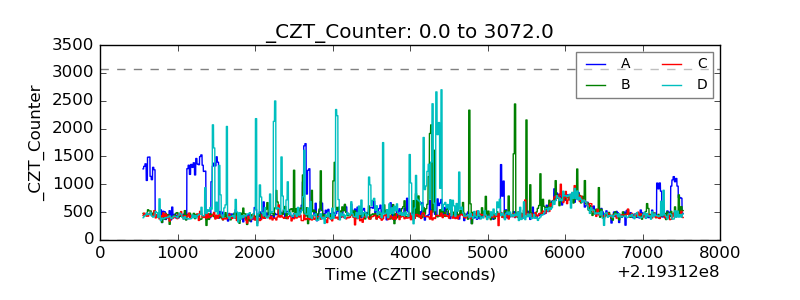 |
| +2.5 Volts monitor |  |
| +5 Volts monitor | 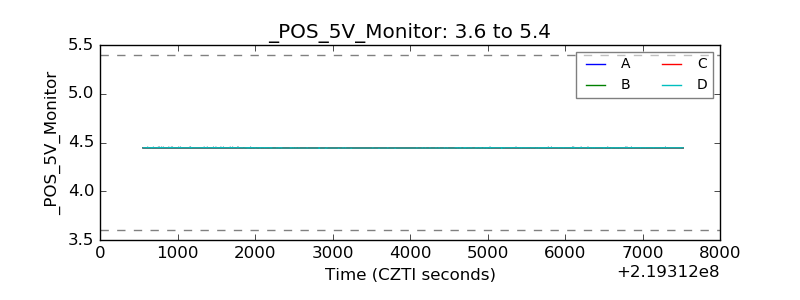 |
| _ROLL_ROT | 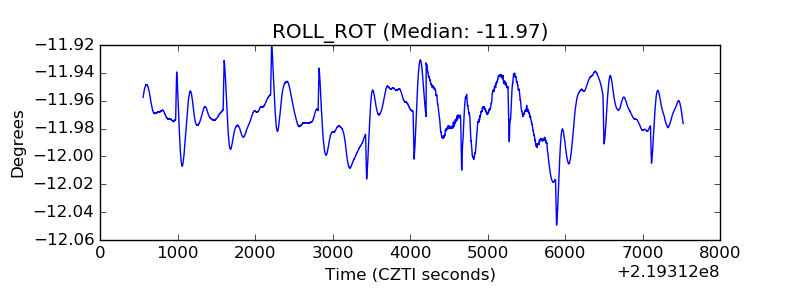 |
| _Roll_DEC | 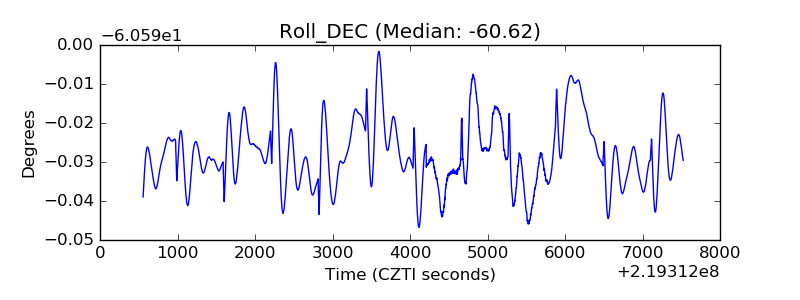 |
| _Roll_RA | 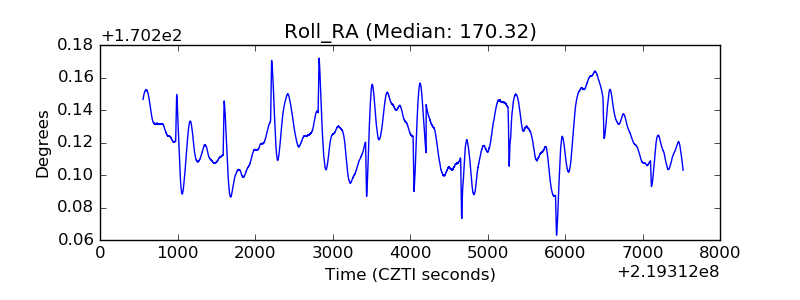 |
| Veto Counter | 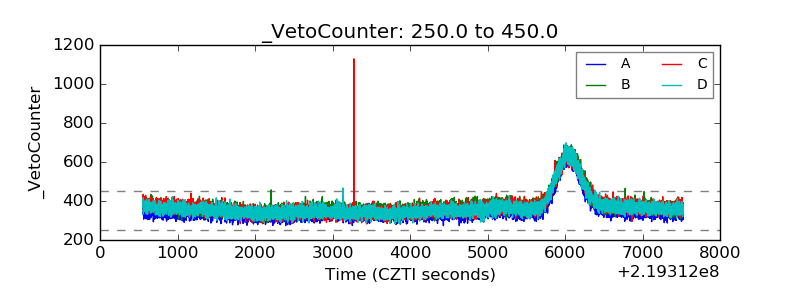 |