| Param | Original file | Final file |
|---|---|---|
| Filename | modeM0/AS1G06_134T06_9000000878cztM0_level2.fits | modeM0/AS1G06_134T06_9000000878cztM0_level2_quad_clean.evt |
| Size (bytes) | 90,216,000 | 86,149,440 |
| Size | 86.0 MB | 82.2 MB |
| Events in quadrant A | 531,114 | 500,740 |
| Events in quadrant B | 515,898 | 492,745 |
| Events in quadrant C | 532,204 | 477,103 |
| Events in quadrant D | 447,824 | 433,073 |
| Mode M9 | |||
|---|---|---|---|
| Quadrant | BADHDUFLAG | Total packets | Discarded packets |
| A | 0 | 2 | 0 |
| B | 0 | 2 | 0 |
| C | 0 | 2 | 0 |
| D | 0 | 2 | 0 |
| Mode M0 | |||
|---|---|---|---|
| Quadrant | BADHDUFLAG | Total packets | Discarded packets |
| A | 0 | 22293 | 0 |
| B | 0 | 21953 | 0 |
| C | 0 | 20980 | 0 |
| D | 0 | 27634 | 0 |
| Mode SS | |||
|---|---|---|---|
| Quadrant | BADHDUFLAG | Total packets | Discarded packets |
| A | 0 | 200 | 0 |
| B | 0 | 202 | 0 |
| C | 0 | 200 | 0 |
| D | 0 | 202 | 0 |
| Quadrant | Total seconds | Saturated seconds | Saturation percentage |
|---|---|---|---|
| A | 10173 | 318 | 3.125922% |
| B | 10188 | 346 | 3.396152% |
| C | 10169 | 140 | 1.376733% |
| D | 10179 | 929 | 9.126633% |
Noise dominated data is calculated using 1-second bins in cleaned event files. If a bin has >2000 counts, and if more than 50% of those come from <1% of pixels, then it is considered to be noise-dominated and hence unusable.
| Quadrant | # 1 sec bins | Bins with >0 counts | Bins with >2000 counts | High rate bins dominated by noise | Noise dominated (total time) | Noise dominated (detector-on time) | Marked lightcurve |
|---|---|---|---|---|---|---|---|
| A | 10281 | 10246 | 0 | 0 | 0.00% | 0.00% |  |
| B | 10280 | 10253 | 0 | 0 | 0.00% | 0.00% |  |
| C | 10280 | 10250 | 0 | 0 | 0.00% | 0.00% |  |
| D | 10280 | 10252 | 0 | 0 | 0.00% | 0.00% |  |
Top three noisy pixels from each quadrant. If the there are fewer than three noisy pixels in the level2.evt file, extra rows are filled as -1
| Pixel properties | Quadrant properties | ||||||
|---|---|---|---|---|---|---|---|
| Quadrant | DetID | PixID | Counts | Sigma | Mean | Median | Sigma |
| A | 0 | 29 | 558 | 11.33 | 138 | 128 | 38.0 |
| A | 7 | 110 | 468 | 8.96 | 138 | 128 | 38.0 |
| A | 0 | 30 | 435 | 8.09 | 138 | 128 | 38.0 |
| B | 2 | 9 | 453 | 10.67 | 136 | 129 | 30.4 |
| B | 12 | 226 | 403 | 9.02 | 136 | 129 | 30.4 |
| B | 14 | 254 | 394 | 8.73 | 136 | 129 | 30.4 |
| C | 12 | 241 | 390 | 6.73 | 140 | 129 | 38.8 |
| C | 1 | 81 | 374 | 6.32 | 140 | 129 | 38.8 |
| C | 9 | 188 | 373 | 6.29 | 140 | 129 | 38.8 |
| D | 4 | 246 | 358 | 6.77 | 127 | 115 | 35.9 |
| D | 3 | 14 | 350 | 6.54 | 127 | 115 | 35.9 |
| D | 11 | 82 | 319 | 5.68 | 127 | 115 | 35.9 |
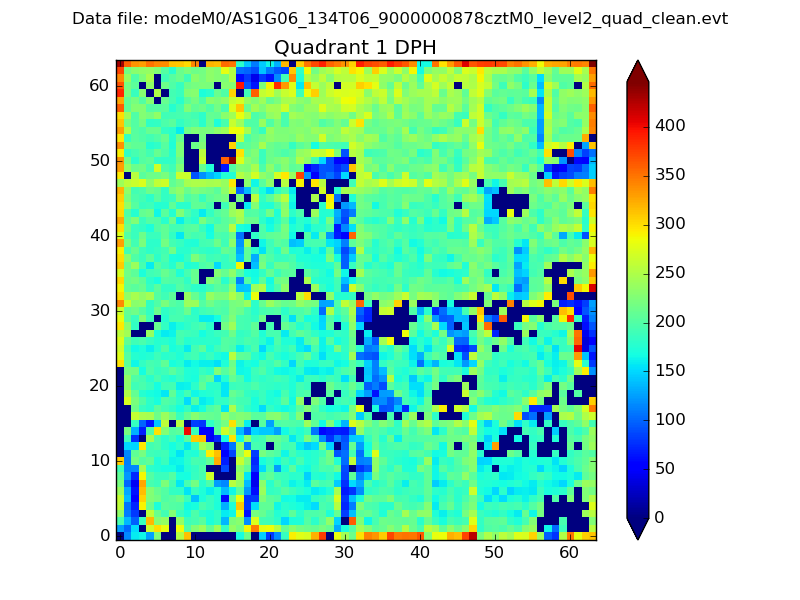
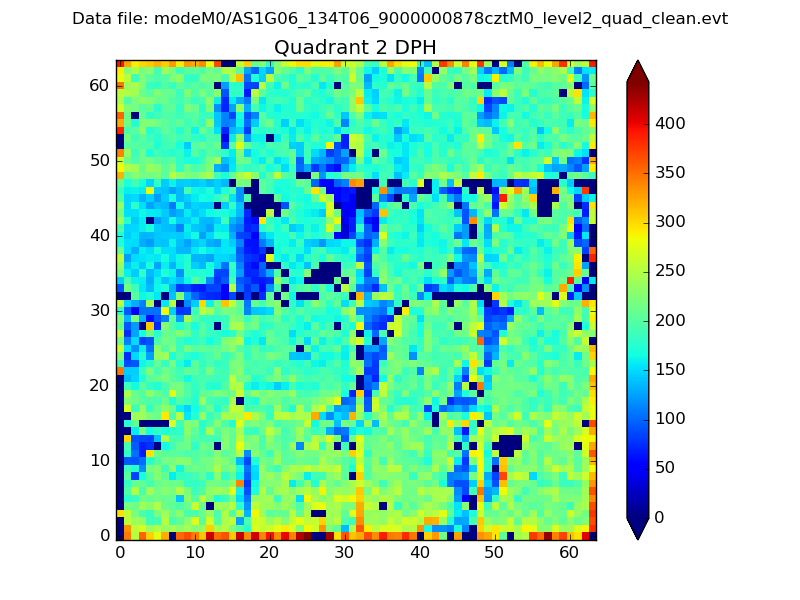
Histogram calculated using DETX and DETY for each event in the final _common_clean file
| Quadrant A |  |
 |
Quadrant B |
|---|---|---|---|
| Quadrant D |  |
 |
Quadrant C |
| Plot type | Count rate plots | Images |
|---|---|---|
| Comparison with Poisson distribution Blue bars denote a histogram of data divided into 1 sec bins. Red curve is a Poisson curve with rate = median count rate of data. |
 |
 |
| Quadrant-wise count rates Data is divided into 100 sec bins |
 |
|
| Module-wise count rates for Quadrant A Data is divided into 100 sec bins |
 |
 |
| Module-wise count rates for Quadrant B Data is divided into 100 sec bins |
 |
 |
| Module-wise count rates for Quadrant C Data is divided into 100 sec bins |
 |
 |
| Module-wise count rates for Quadrant D Data is divided into 100 sec bins |
 |
 |
| Parameter | Plot |
|---|---|
| CZT HV Monitor |  |
| D_VDD | 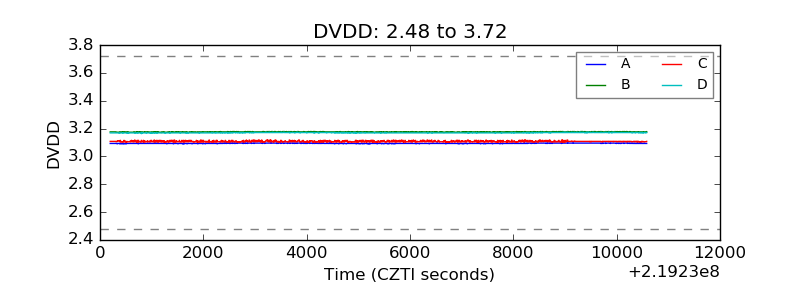 |
| Temperature 1 |  |
| Veto HV Monitor |  |
| Veto LLD | 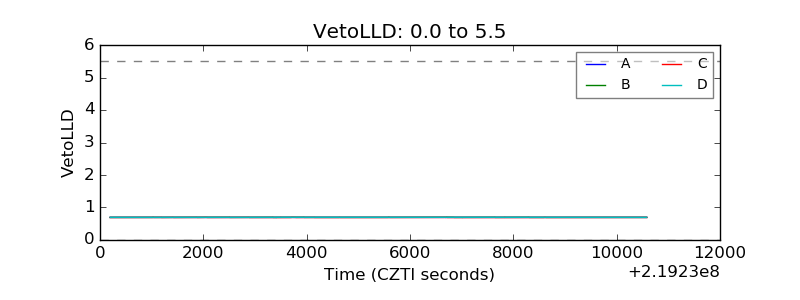 |
| Alpha Counter |  |
| _CPM_Rate |  |
| CZT Counter |  |
| +2.5 Volts monitor |  |
| +5 Volts monitor |  |
| _ROLL_ROT |  |
| _Roll_DEC |  |
| _Roll_RA |  |
| Veto Counter |  |