| Param | Original file | Final file |
|---|---|---|
| Filename | modeM0/AS1G06_134T06_9000000878_06532cztM0_level2.evt | modeM0/AS1G06_134T06_9000000878_06532cztM0_level2_quad_clean.evt |
| Size (bytes) | 594,792,000 | 84,893,760 |
| Size | 567.2 MB | 81.0 MB |
| Events in quadrant A | 3,982,145 | 511,696 |
| Events in quadrant B | 4,070,238 | 510,186 |
| Events in quadrant C | 3,649,835 | 510,418 |
| Events in quadrant D | 5,771,142 | 485,643 |
| Mode M9 | |||
|---|---|---|---|
| Quadrant | BADHDUFLAG | Total packets | Discarded packets |
| A | 0 | 2 | 0 |
| B | 0 | 2 | 0 |
| C | 0 | 2 | 0 |
| D | 0 | 2 | 0 |
| Mode M0 | |||
|---|---|---|---|
| Quadrant | BADHDUFLAG | Total packets | Discarded packets |
| A | 0 | 17144 | 2 |
| B | 0 | 17398 | 1 |
| C | 0 | 16543 | 1 |
| D | 0 | 22698 | 1 |
| Mode SS | |||
|---|---|---|---|
| Quadrant | BADHDUFLAG | Total packets | Discarded packets |
| A | 0 | 158 | 0 |
| B | 0 | 158 | 0 |
| C | 0 | 158 | 0 |
| D | 0 | 158 | 0 |
| Quadrant | Total seconds | Saturated seconds | Saturation percentage |
|---|---|---|---|
| A | 7954 | 301 | 3.784259% |
| B | 7954 | 345 | 4.337440% |
| C | 7954 | 140 | 1.760121% |
| D | 7954 | 907 | 11.403068% |
Noise dominated data is calculated using 1-second bins in cleaned event files. If a bin has >2000 counts, and if more than 50% of those come from <1% of pixels, then it is considered to be noise-dominated and hence unusable.
| Quadrant | # 1 sec bins | Bins with >0 counts | Bins with >2000 counts | High rate bins dominated by noise | Noise dominated (total time) | Noise dominated (detector-on time) | Marked lightcurve |
|---|---|---|---|---|---|---|---|
| A | 7979 | 7955 | 9 | 9 | 0.11% | 0.11% | 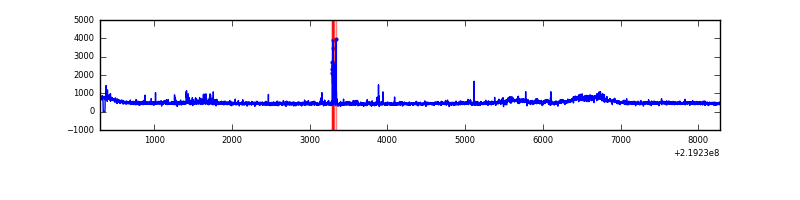 |
| B | 7979 | 7955 | 36 | 36 | 0.45% | 0.45% | 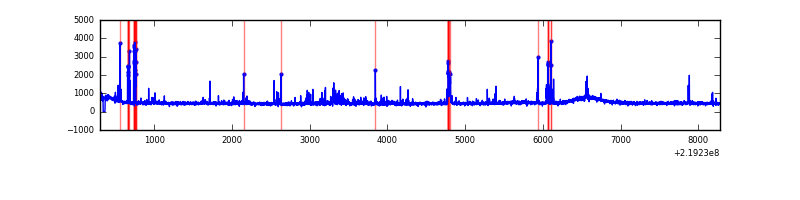 |
| C | 7979 | 7955 | 0 | 0 | 0.00% | 0.00% | 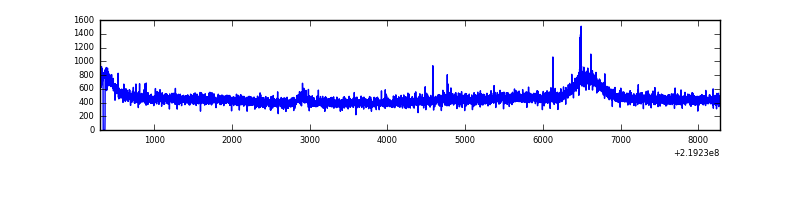 |
| D | 7979 | 7955 | 703 | 703 | 8.81% | 8.84% | 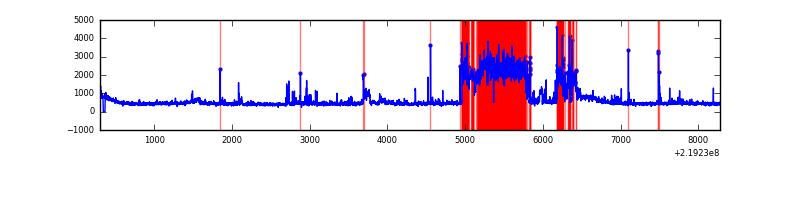 |
Top three noisy pixels from each quadrant. If the there are fewer than three noisy pixels in the level2.evt file, extra rows are filled as -1
| Pixel properties | Quadrant properties | ||||||
|---|---|---|---|---|---|---|---|
| Quadrant | DetID | PixID | Counts | Sigma | Mean | Median | Sigma |
| A | 8 | 15 | 142734 | 729.76 | 943 | 919 | 194.3 |
| A | 15 | 236 | 94543 | 481.77 | 943 | 919 | 194.3 |
| A | 14 | 111 | 92287 | 470.17 | 943 | 919 | 194.3 |
| B | 0 | 219 | 126359 | 687.12 | 945 | 921 | 182.6 |
| B | 15 | 85 | 68326 | 369.23 | 945 | 921 | 182.6 |
| B | 4 | 81 | 40209 | 215.21 | 945 | 921 | 182.6 |
| C | 8 | 128 | 19757 | 87.7 | 920 | 923 | 214.8 |
| C | 9 | 54 | 11403 | 48.8 | 920 | 923 | 214.8 |
| C | 1 | 16 | 9738 | 41.05 | 920 | 923 | 214.8 |
| D | 13 | 169 | 1896274 | 8536.62 | 899 | 870 | 222.0 |
| D | 12 | 233 | 126928 | 567.75 | 899 | 870 | 222.0 |
| D | 2 | 152 | 80139 | 357.02 | 899 | 870 | 222.0 |
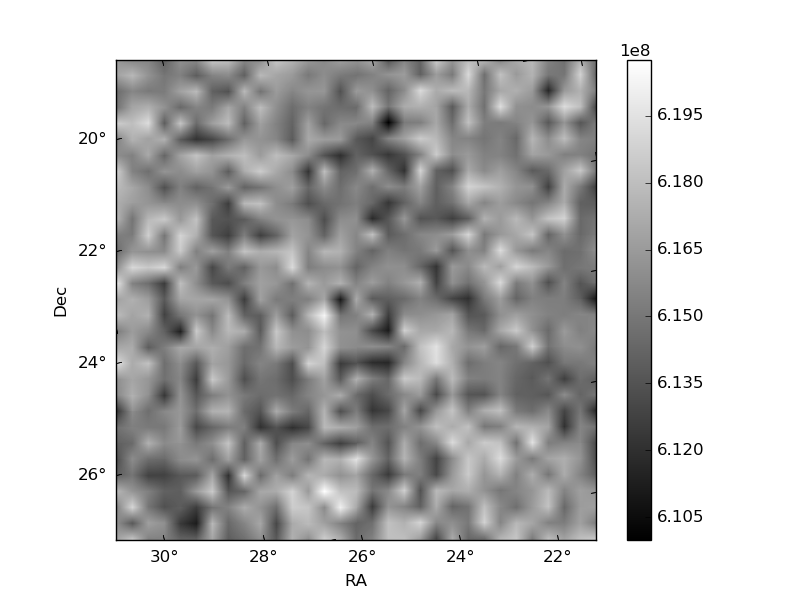
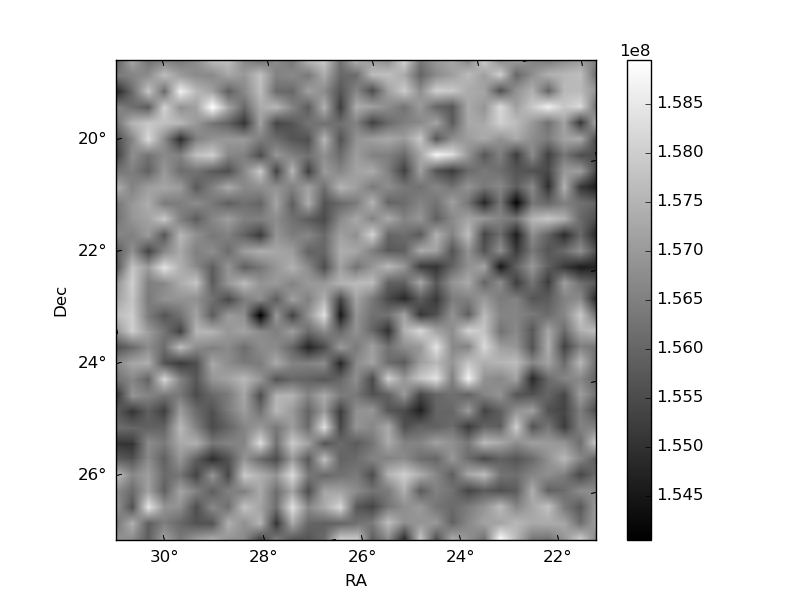
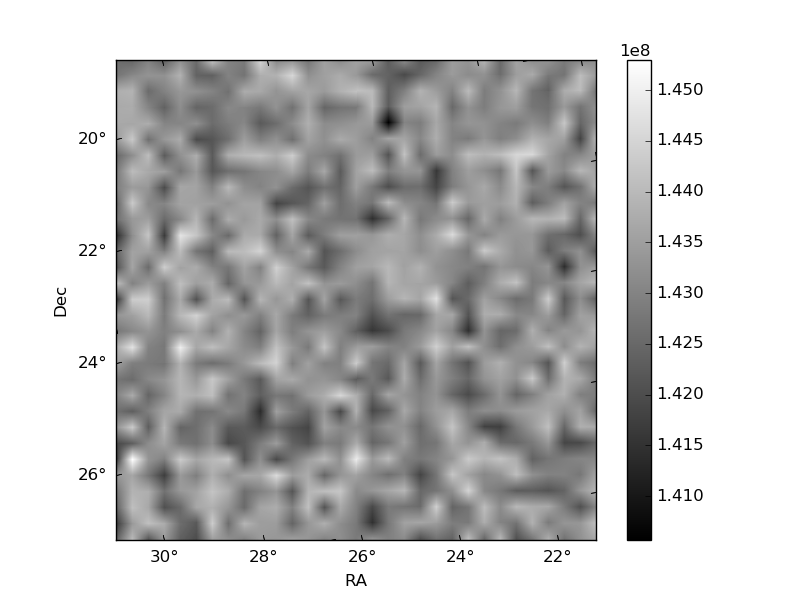
Histogram calculated using DETX and DETY for each event in the final _common_clean file
| Quadrant A | 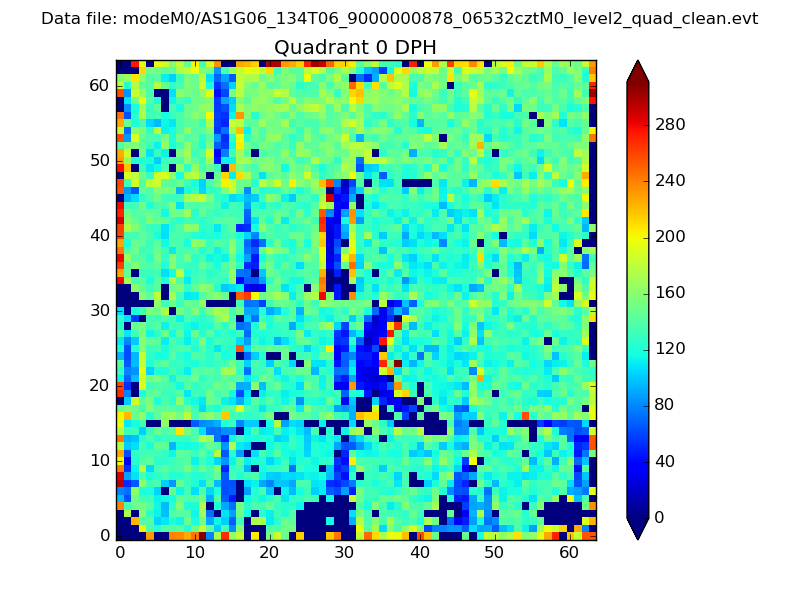 |
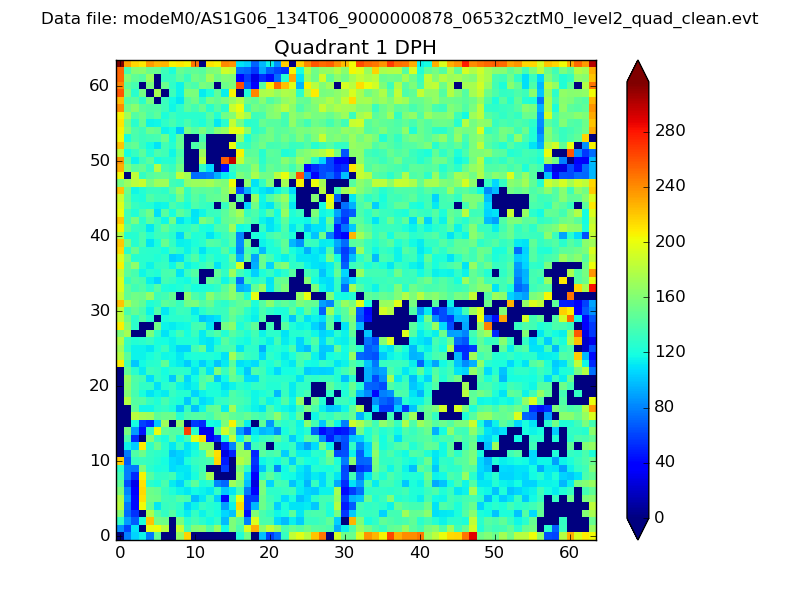 |
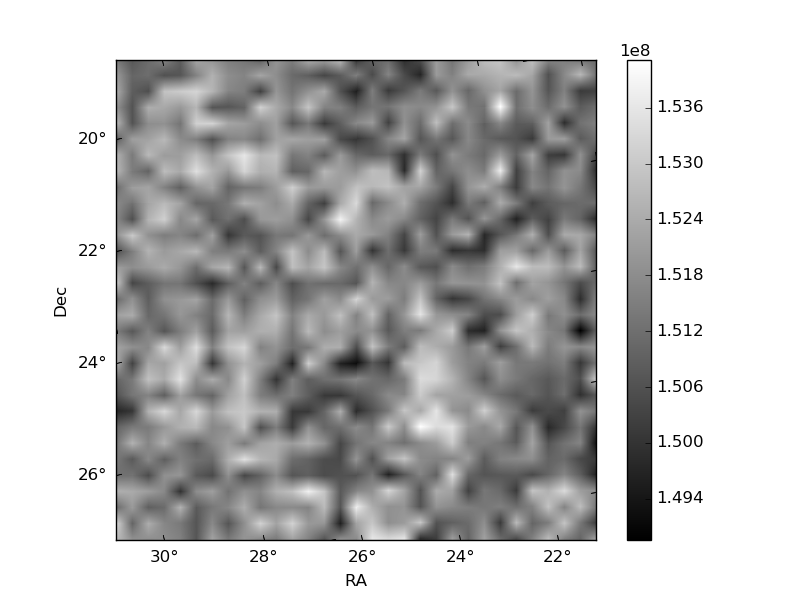
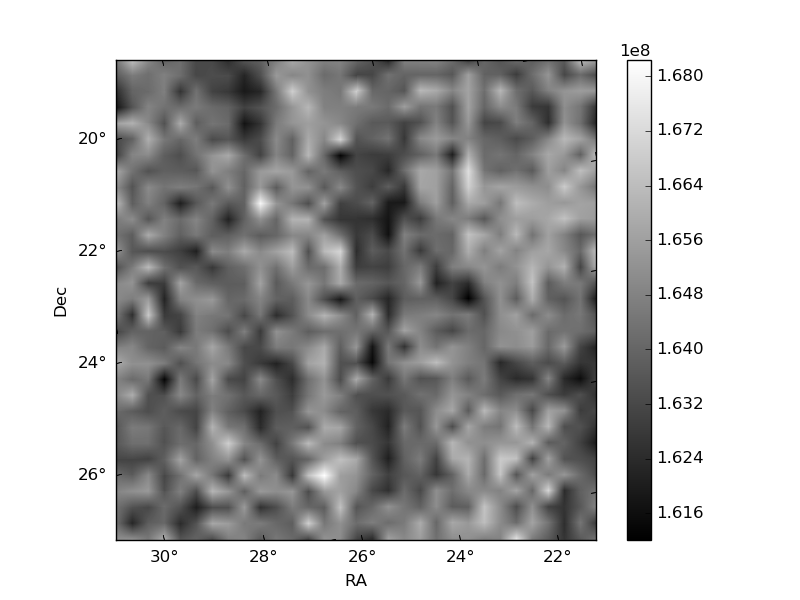
Quadrant B |
|---|---|---|---|
| Quadrant D | 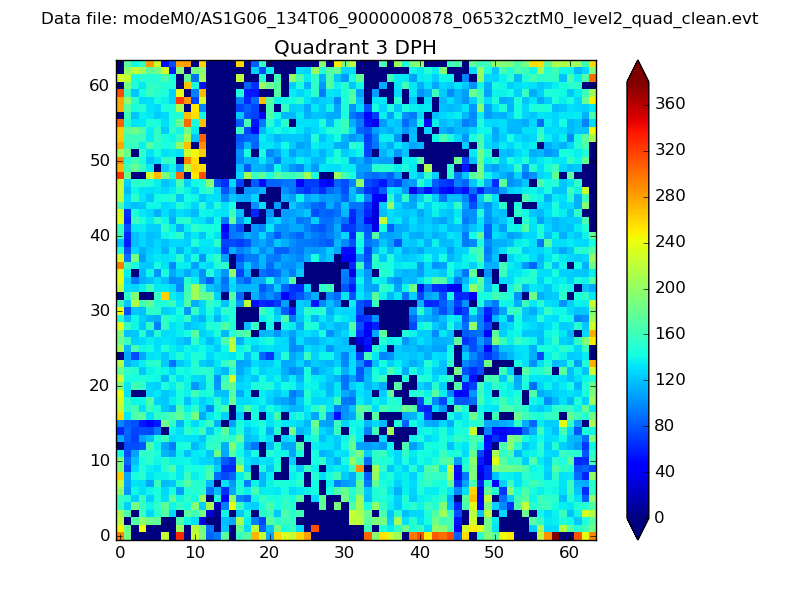 |
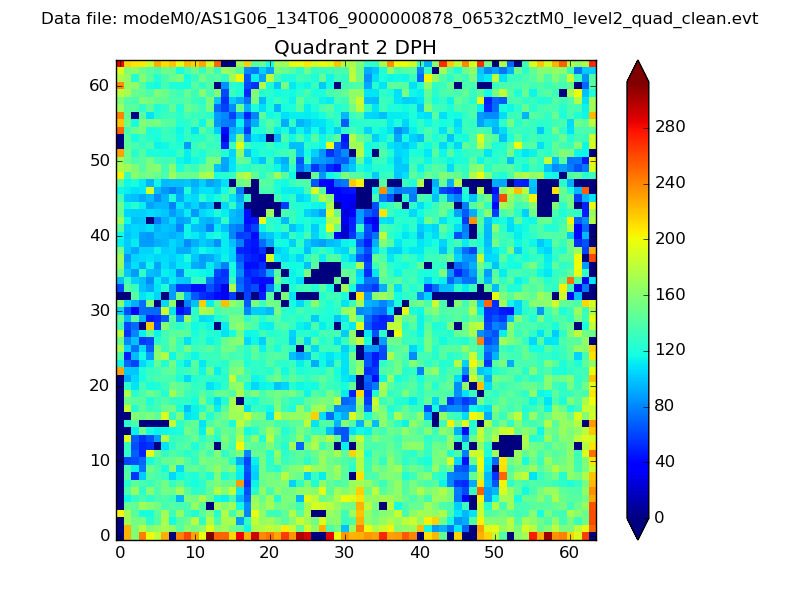 |
Quadrant C |
| Plot type | Count rate plots | Images |
|---|---|---|
| Comparison with Poisson distribution Blue bars denote a histogram of data divided into 1 sec bins. Red curve is a Poisson curve with rate = median count rate of data. |
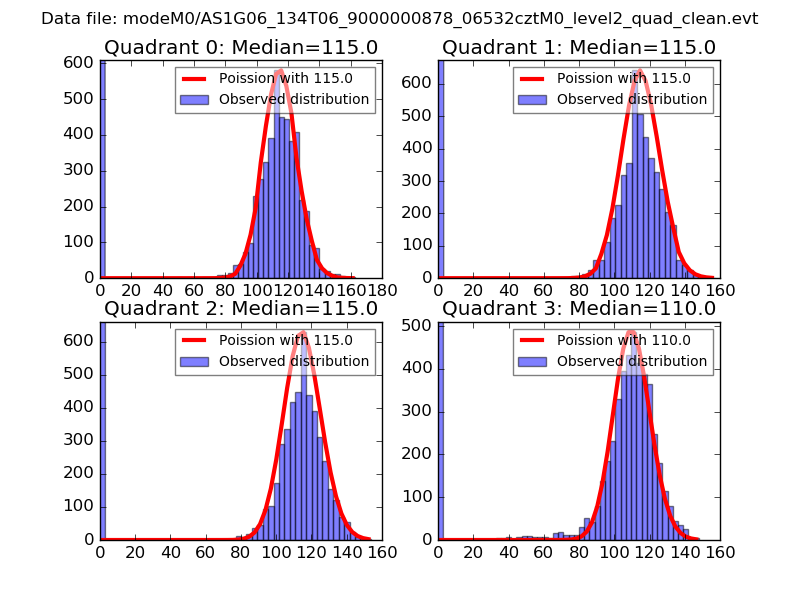 |
 |
| Quadrant-wise count rates Data is divided into 100 sec bins |
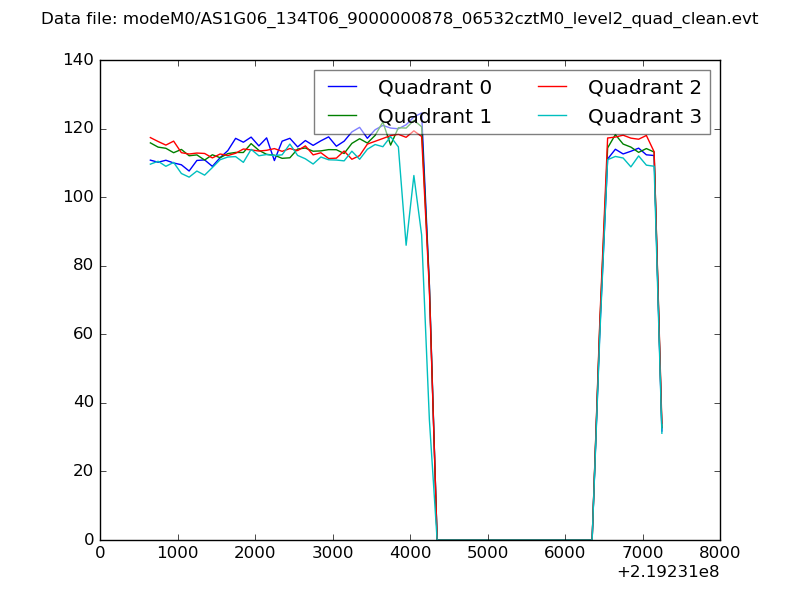 |
|
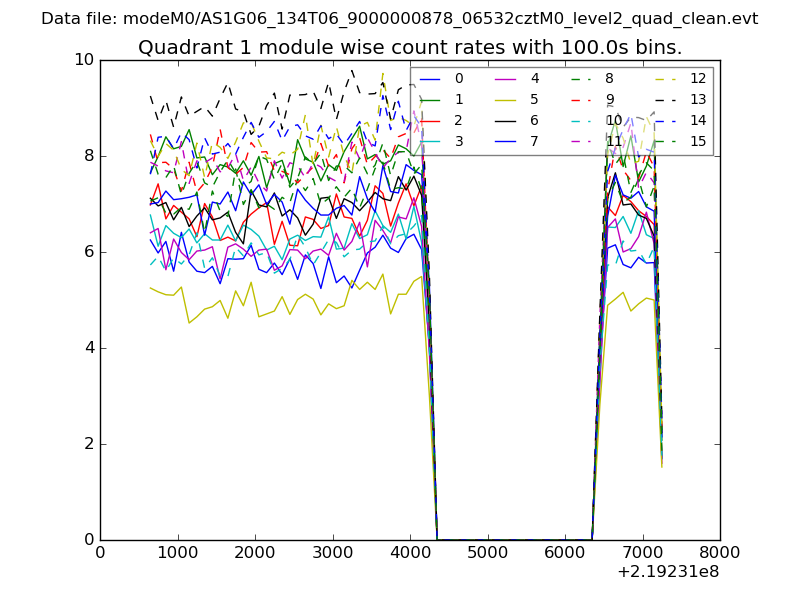
| Module-wise count rates for Quadrant A Data is divided into 100 sec bins |
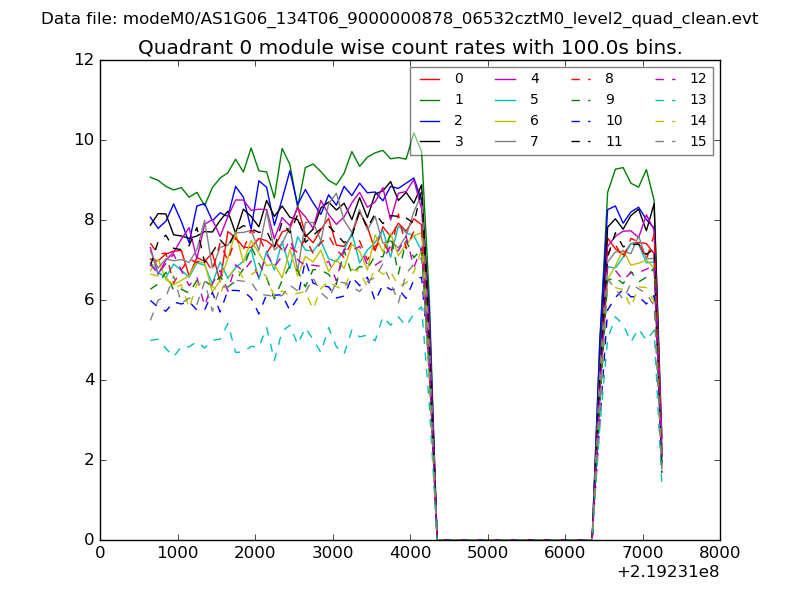 |
 |
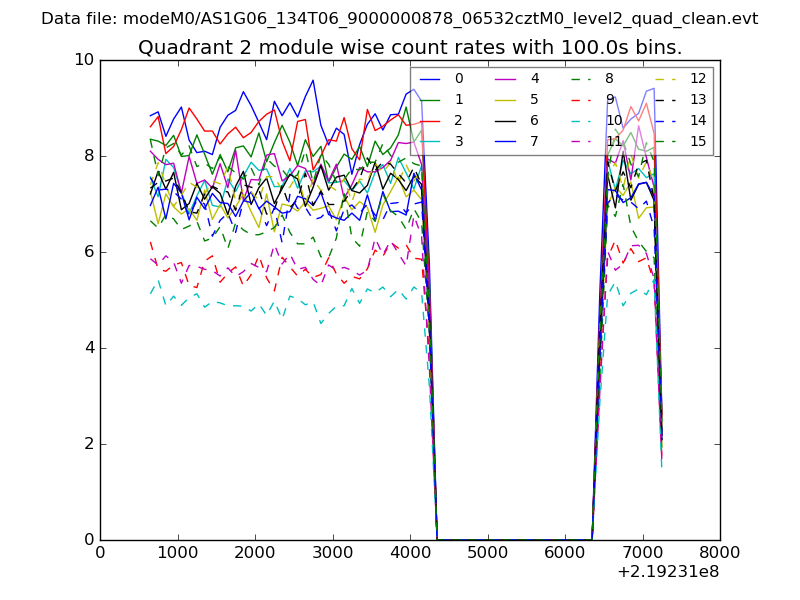
| Module-wise count rates for Quadrant B Data is divided into 100 sec bins |
 |
 |
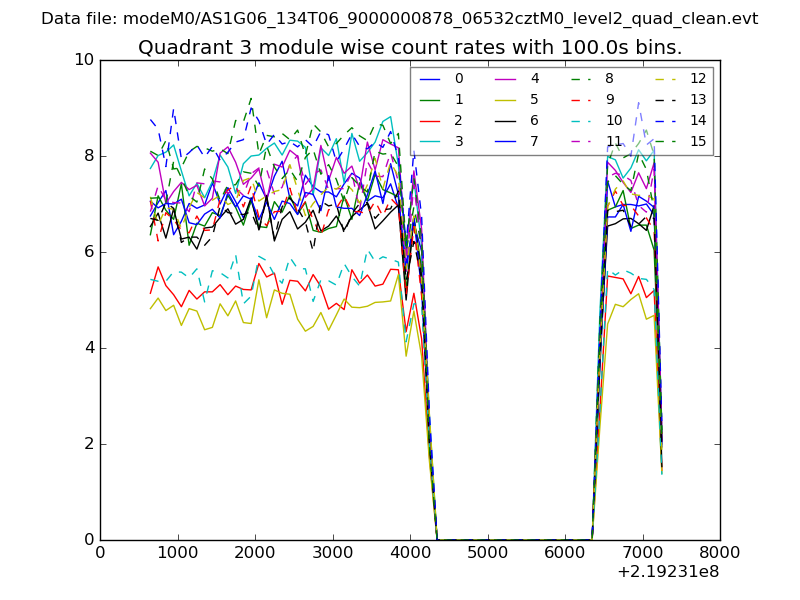
| Module-wise count rates for Quadrant C Data is divided into 100 sec bins |
 |
 |
| Module-wise count rates for Quadrant D Data is divided into 100 sec bins |
 |
 |
| Parameter | Plot |
|---|---|
| CZT HV Monitor | 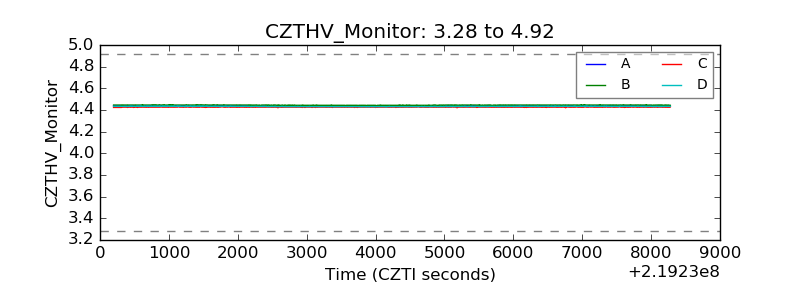 |
| D_VDD | 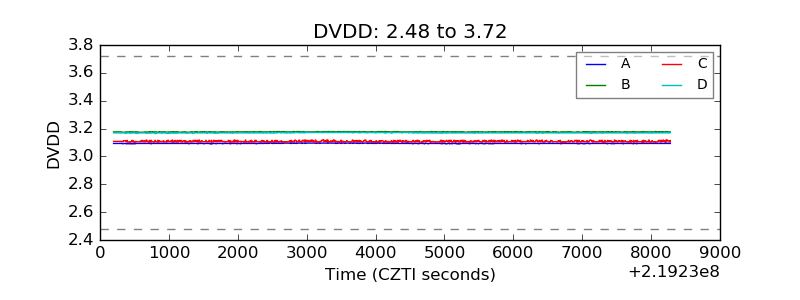 |
| Temperature 1 | 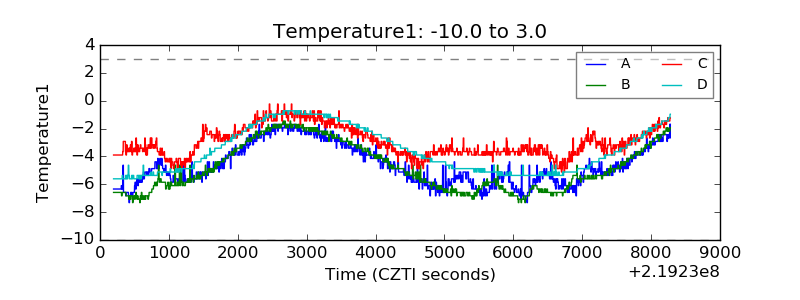 |
| Veto HV Monitor | 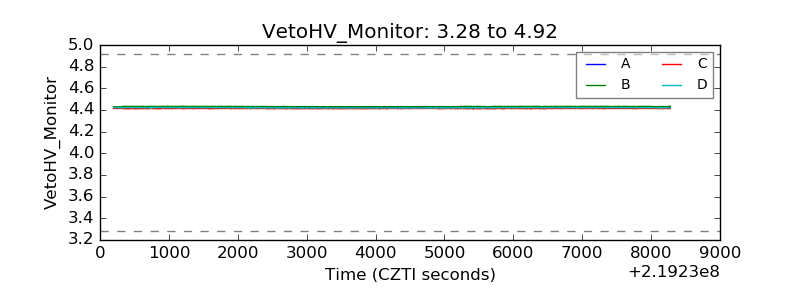 |
| Veto LLD | 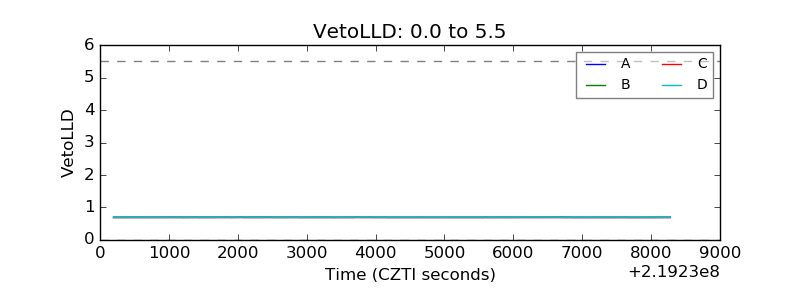 |
| Alpha Counter | 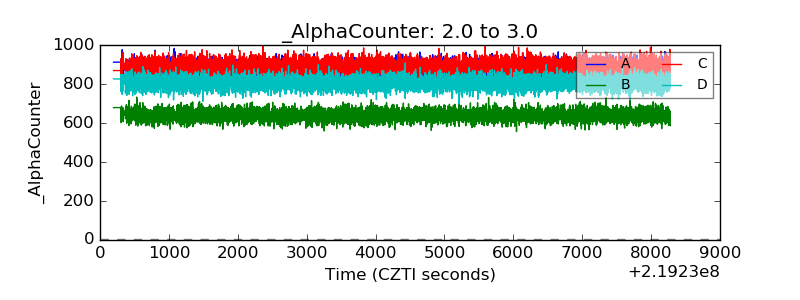 |
| _CPM_Rate | 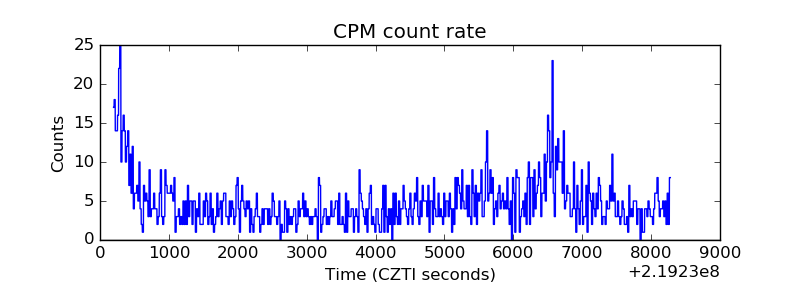 |
| CZT Counter | 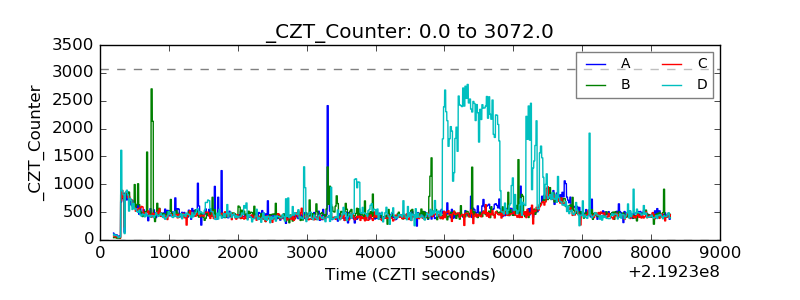 |
| +2.5 Volts monitor | 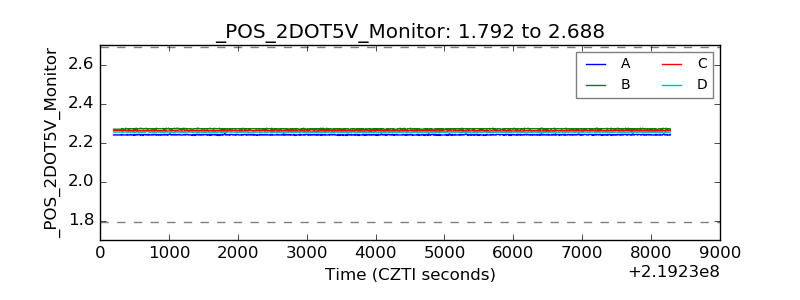 |
| +5 Volts monitor | 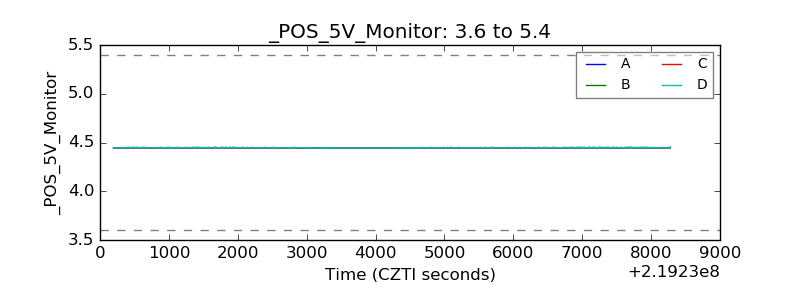 |
| _ROLL_ROT | 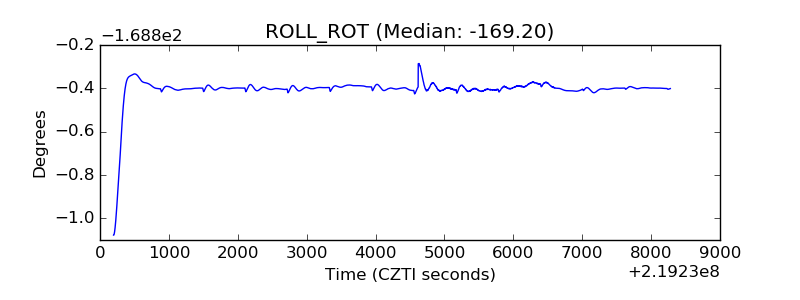 |
| _Roll_DEC | 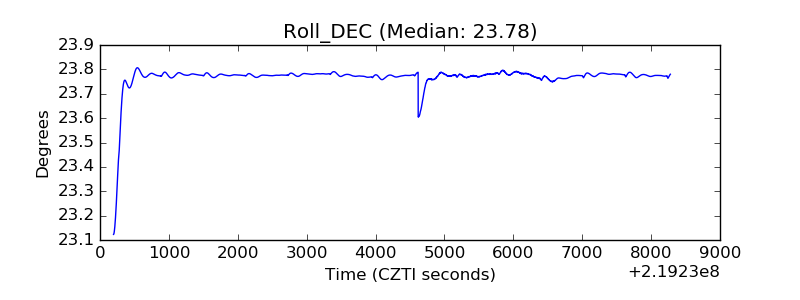 |
| _Roll_RA | 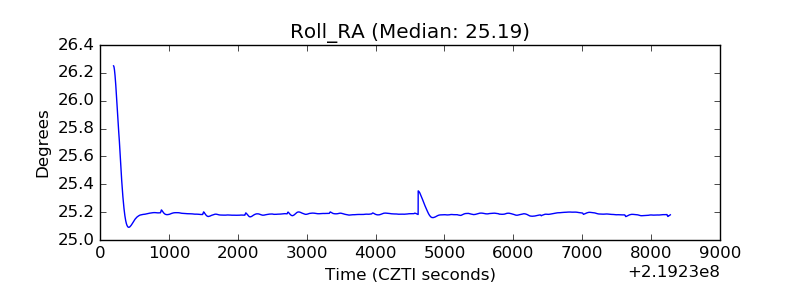 |
| Veto Counter | 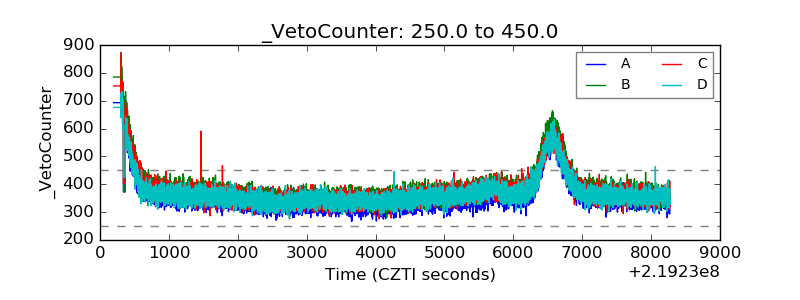 |