| Param | Original file | Final file |
|---|---|---|
| Filename | modeM0/AS1G06_134T06_9000000878_06536cztM0_level2.evt | modeM0/AS1G06_134T06_9000000878_06536cztM0_level2_quad_clean.evt |
| Size (bytes) | 191,404,800 | 51,212,160 |
| Size | 182.5 MB | 48.8 MB |
| Events in quadrant A | 1,564,544 | 335,159 |
| Events in quadrant B | 1,334,624 | 338,126 |
| Events in quadrant C | 1,209,944 | 337,401 |
| Events in quadrant D | 1,482,867 | 327,746 |
| Mode M0 | |||
|---|---|---|---|
| Quadrant | BADHDUFLAG | Total packets | Discarded packets |
| A | 0 | 6926 | 265 |
| B | 0 | 6291 | 209 |
| C | 0 | 6181 | 227 |
| D | 0 | 6733 | 243 |
| Mode SS | |||
|---|---|---|---|
| Quadrant | BADHDUFLAG | Total packets | Discarded packets |
| A | 0 | 62 | 6 |
| B | 0 | 62 | 2 |
| C | 0 | 62 | 4 |
| D | 0 | 62 | 2 |
| Quadrant | Total seconds | Saturated seconds | Saturation percentage |
|---|---|---|---|
| A | 2973 | 17 | 0.571813% |
| B | 2986 | 2 | 0.066979% |
| C | 2973 | 1 | 0.033636% |
| D | 2980 | 22 | 0.738255% |
Noise dominated data is calculated using 1-second bins in cleaned event files. If a bin has >2000 counts, and if more than 50% of those come from <1% of pixels, then it is considered to be noise-dominated and hence unusable.
| Quadrant | # 1 sec bins | Bins with >0 counts | Bins with >2000 counts | High rate bins dominated by noise | Noise dominated (total time) | Noise dominated (detector-on time) | Marked lightcurve |
|---|---|---|---|---|---|---|---|
| A | 3086 | 3073 | 9 | 9 | 0.29% | 0.29% |  |
| B | 3086 | 3083 | 0 | 0 | 0.00% | 0.00% |  |
| C | 3086 | 3080 | 0 | 0 | 0.00% | 0.00% | 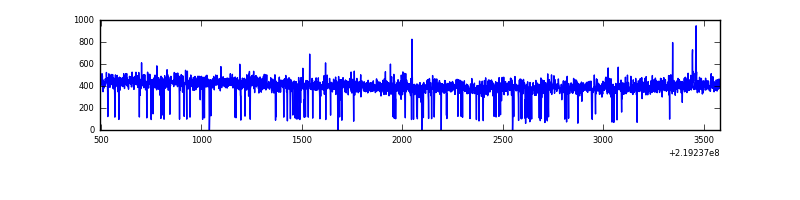 |
| D | 3086 | 3080 | 10 | 10 | 0.32% | 0.32% | 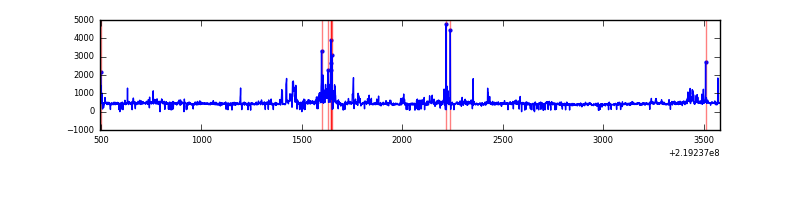 |
Top three noisy pixels from each quadrant. If the there are fewer than three noisy pixels in the level2.evt file, extra rows are filled as -1
| Pixel properties | Quadrant properties | ||||||
|---|---|---|---|---|---|---|---|
| Quadrant | DetID | PixID | Counts | Sigma | Mean | Median | Sigma |
| A | 15 | 236 | 280648 | 4153.43 | 320 | 313 | 67.5 |
| A | 8 | 15 | 34441 | 505.63 | 320 | 313 | 67.5 |
| A | 8 | 4 | 6940 | 98.18 | 320 | 313 | 67.5 |
| B | 0 | 214 | 26651 | 422.16 | 318 | 312 | 62.4 |
| B | 4 | 170 | 23423 | 370.42 | 318 | 312 | 62.4 |
| B | 0 | 219 | 14009 | 219.53 | 318 | 312 | 62.4 |
| C | 8 | 128 | 3735 | 47.12 | 307 | 309 | 72.7 |
| C | 12 | 4 | 3075 | 38.04 | 307 | 309 | 72.7 |
| C | 13 | 61 | 2374 | 28.4 | 307 | 309 | 72.7 |
| D | 2 | 152 | 101712 | 1312.08 | 312 | 303 | 77.3 |
| D | 12 | 233 | 69112 | 890.28 | 312 | 303 | 77.3 |
| D | 14 | 173 | 58807 | 756.95 | 312 | 303 | 77.3 |
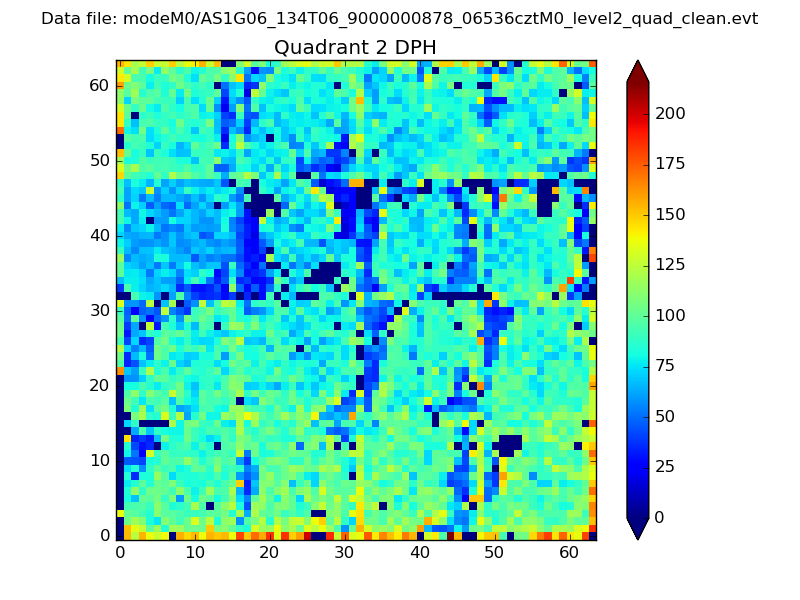
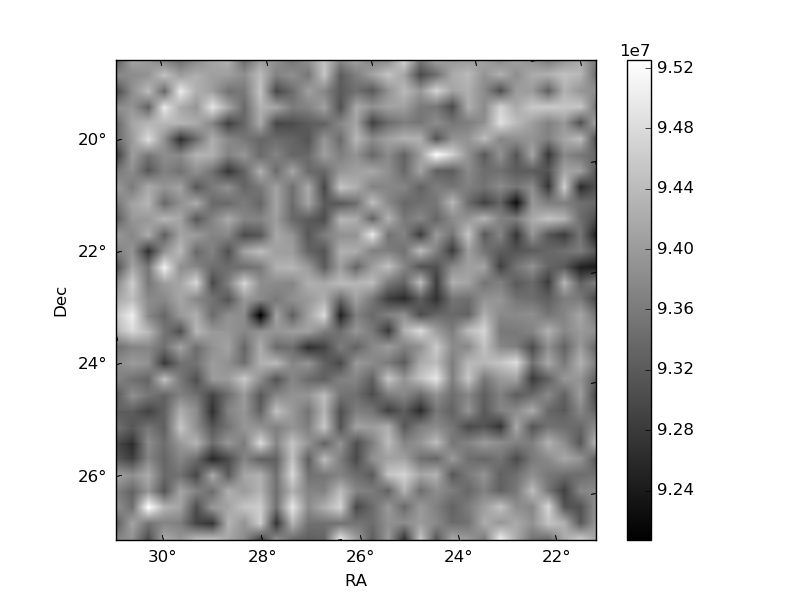
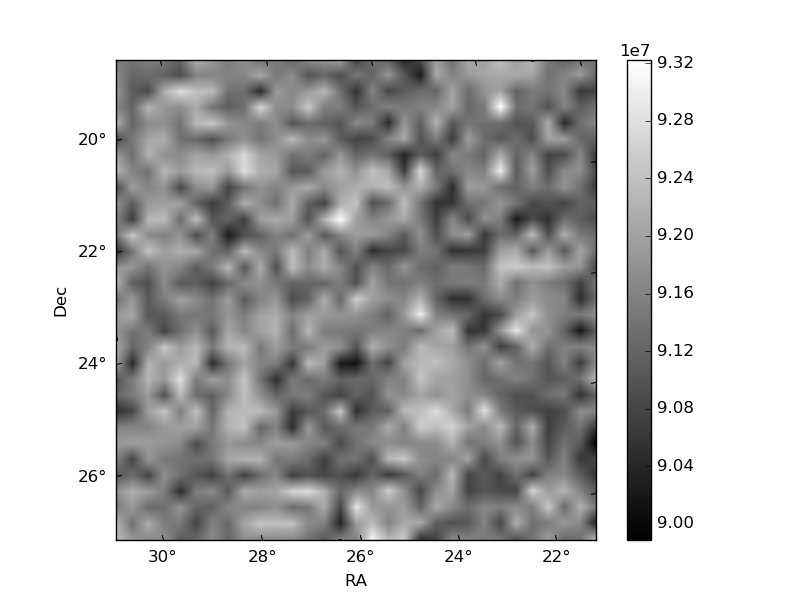
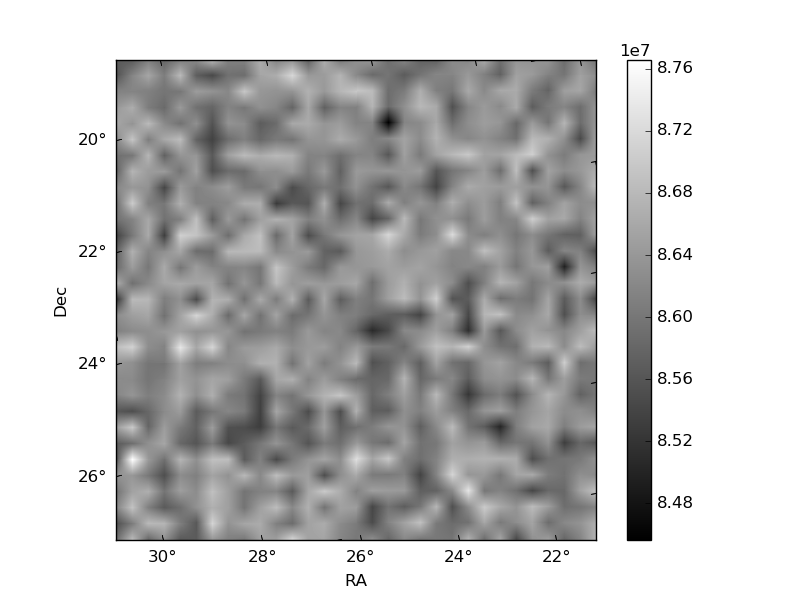
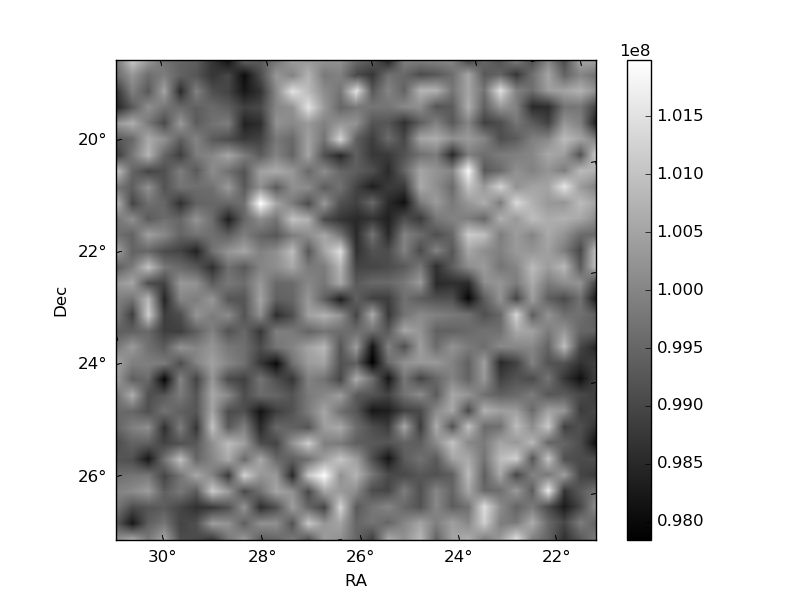
Histogram calculated using DETX and DETY for each event in the final _common_clean file
| Quadrant A | 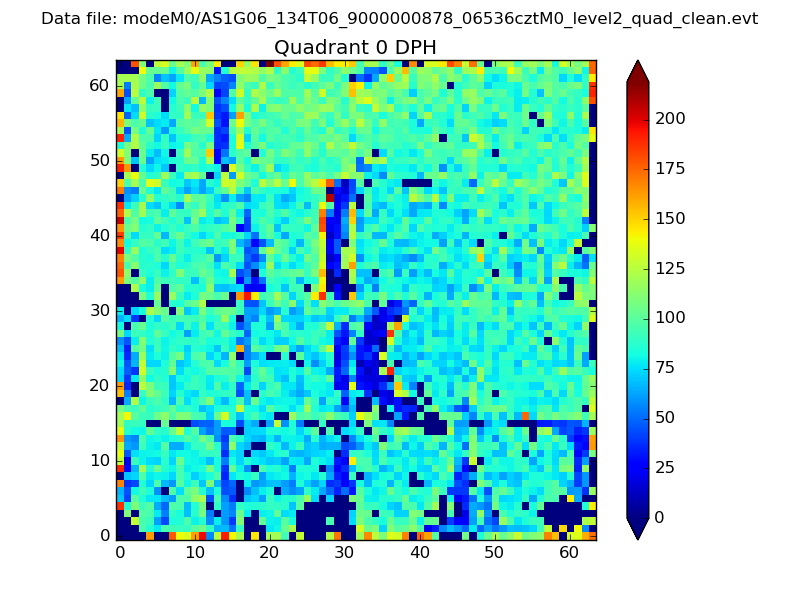 |
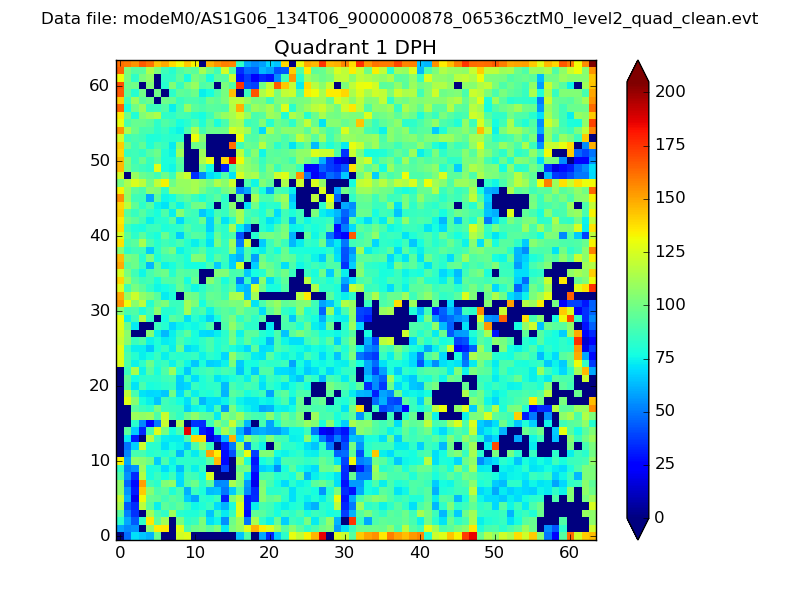 |
Quadrant B |
|---|---|---|---|
| Quadrant D | 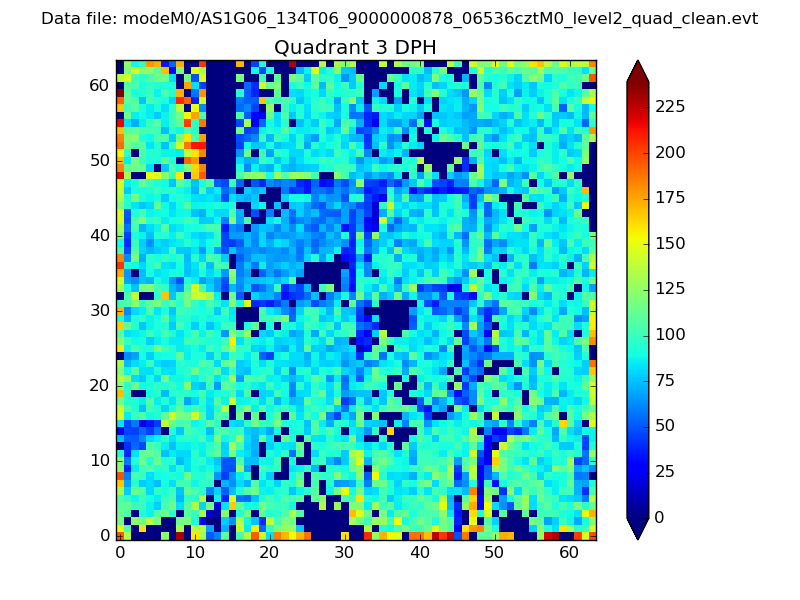 |
 |
Quadrant C |
| Plot type | Count rate plots | Images |
|---|---|---|
| Comparison with Poisson distribution Blue bars denote a histogram of data divided into 1 sec bins. Red curve is a Poisson curve with rate = median count rate of data. |
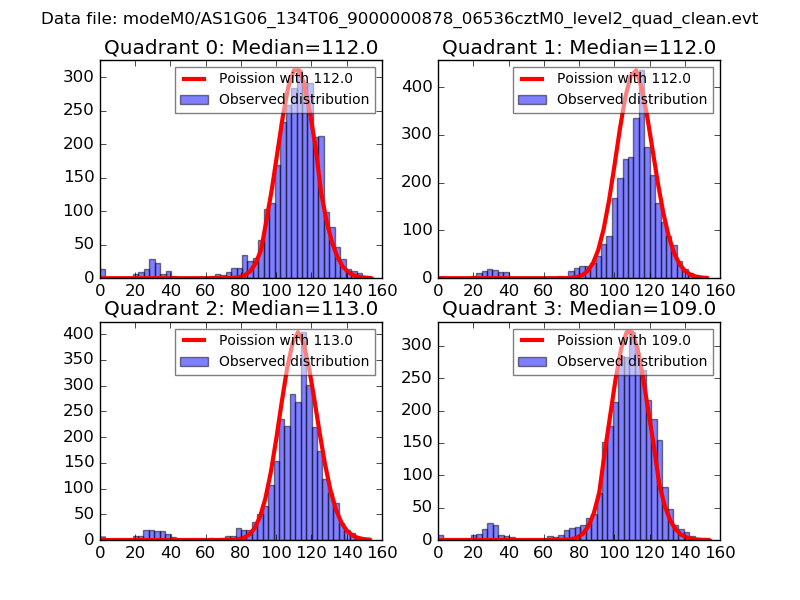 |
 |
| Quadrant-wise count rates Data is divided into 100 sec bins |
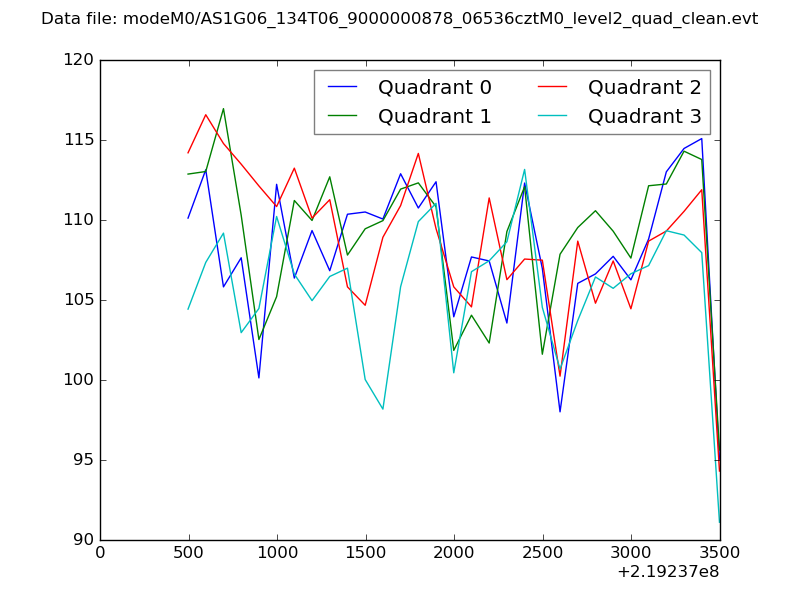 |
|
| Module-wise count rates for Quadrant A Data is divided into 100 sec bins |
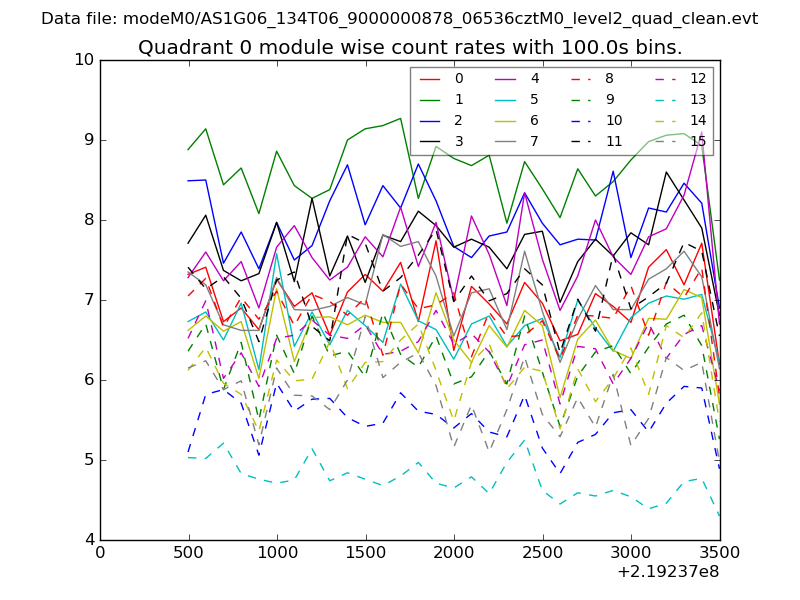 |
 |
| Module-wise count rates for Quadrant B Data is divided into 100 sec bins |
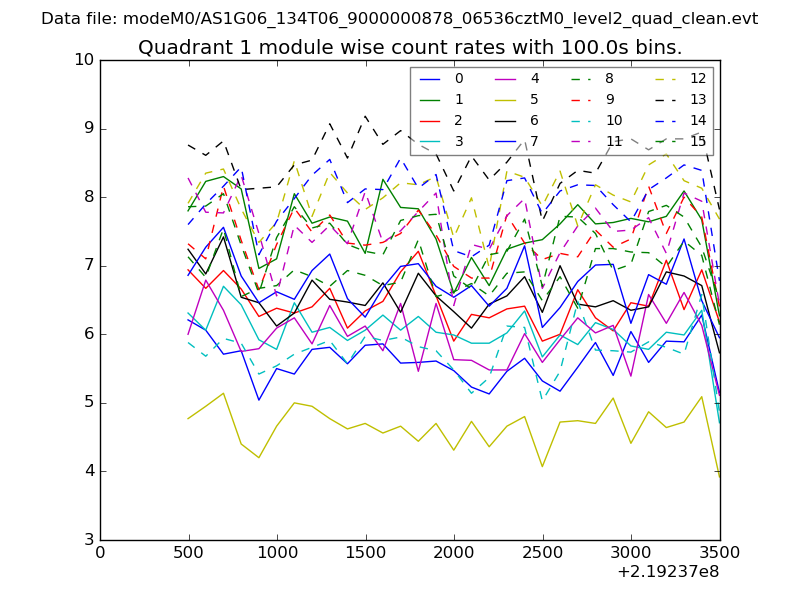 |
 |
| Module-wise count rates for Quadrant C Data is divided into 100 sec bins |
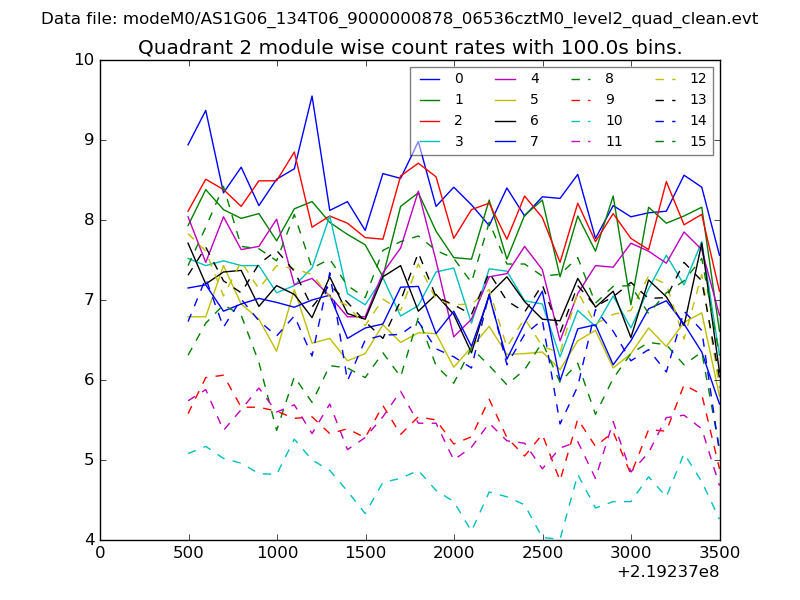 |
 |
| Module-wise count rates for Quadrant D Data is divided into 100 sec bins |
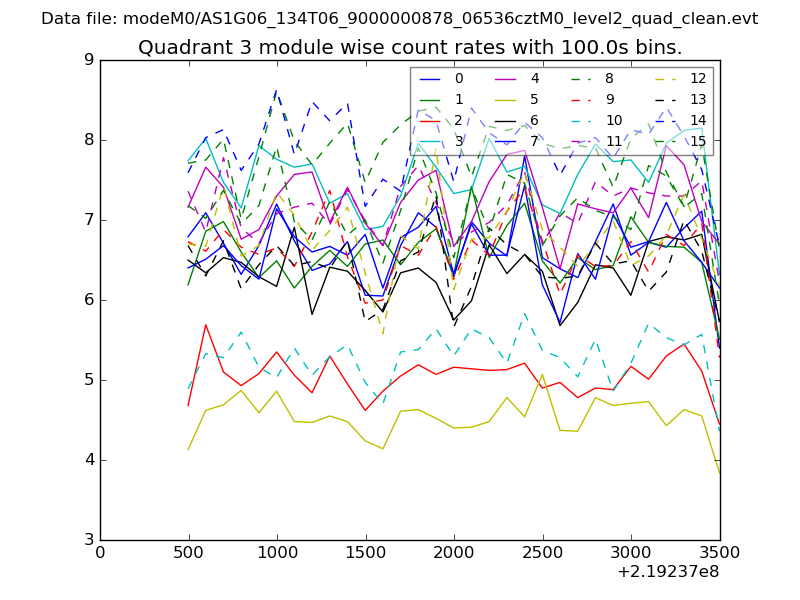 |
 |
| Parameter | Plot |
|---|---|
| CZT HV Monitor | 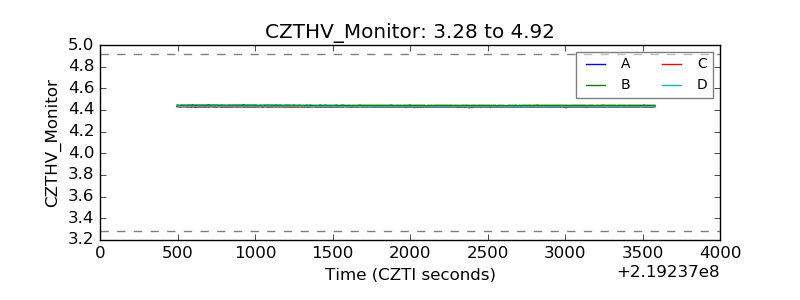 |
| D_VDD | 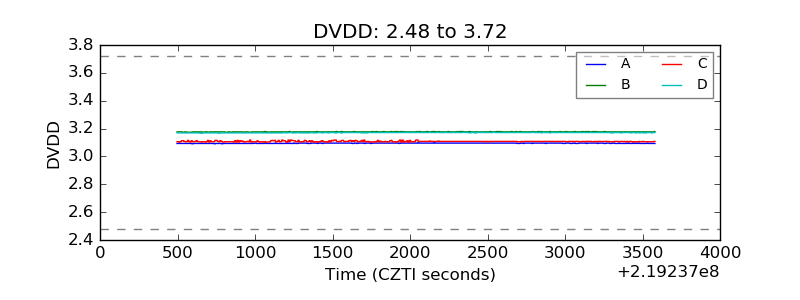 |
| Temperature 1 | 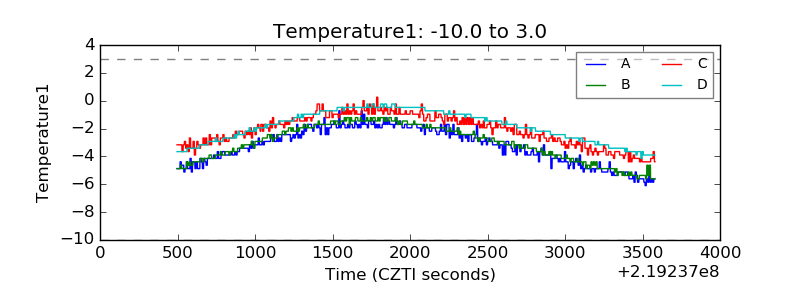 |
| Veto HV Monitor | 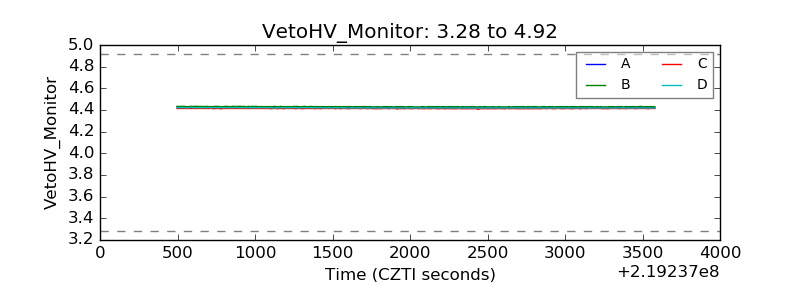 |
| Veto LLD | 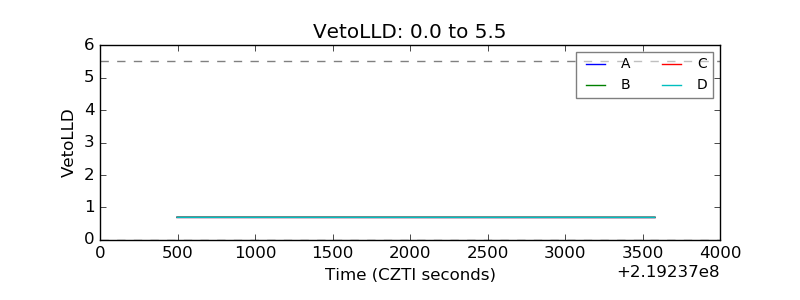 |
| Alpha Counter | 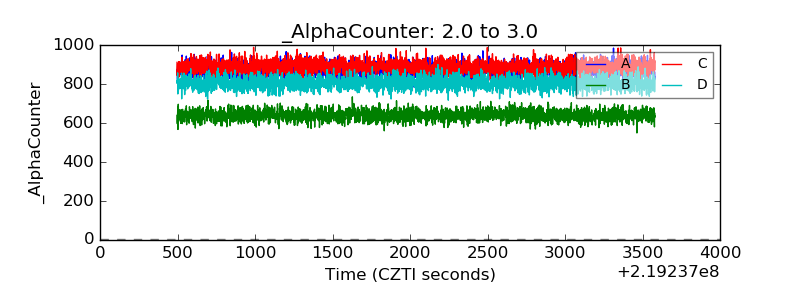 |
| _CPM_Rate | 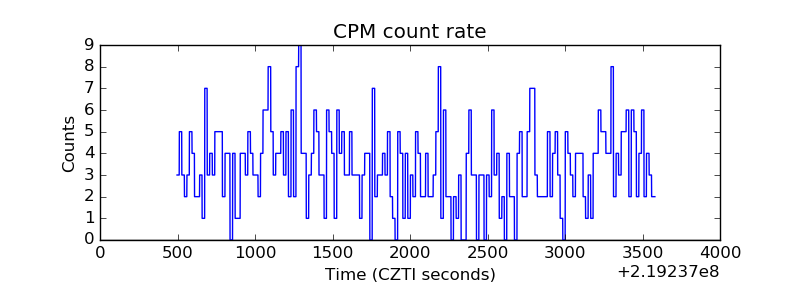 |
| CZT Counter | 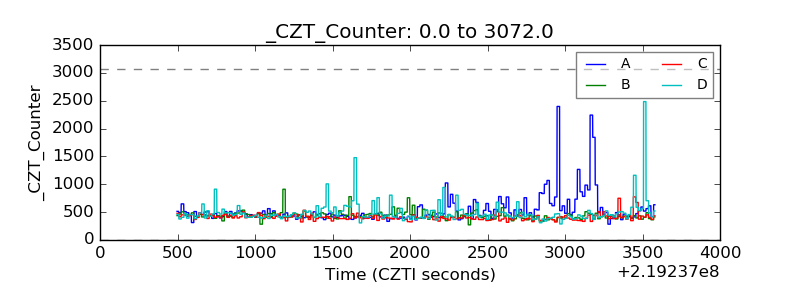 |
| +2.5 Volts monitor |  |
| +5 Volts monitor |  |
| _ROLL_ROT | 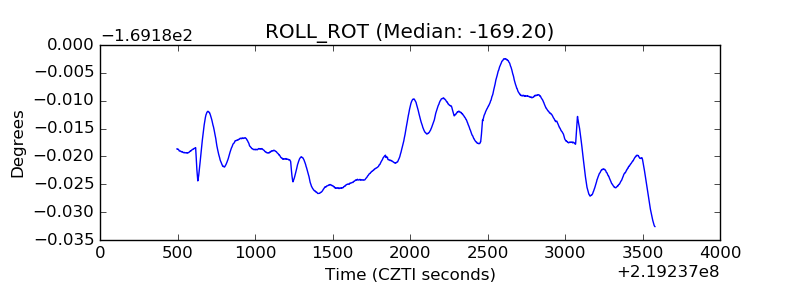 |
| _Roll_DEC | 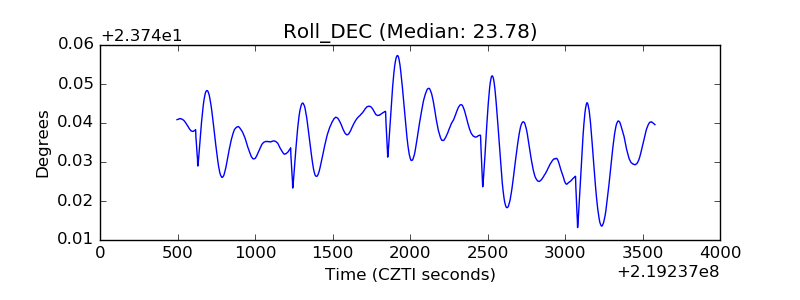 |
| _Roll_RA | 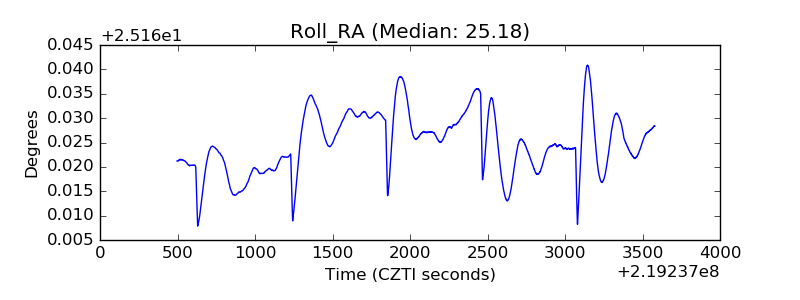 |
| Veto Counter | 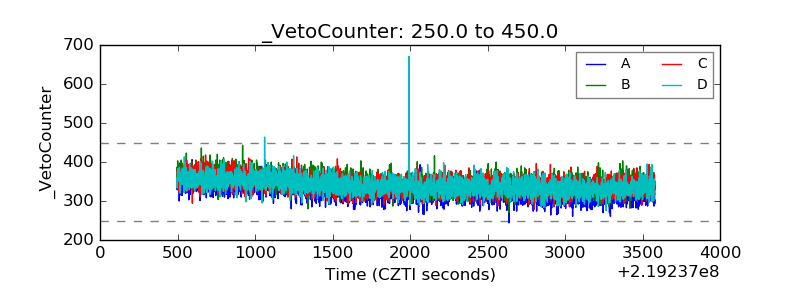 |