| Param | Original file | Final file |
|---|---|---|
| Filename | modeM0/AS1G05_246T04_9000000882cztM0_level2.fits | modeM0/AS1G05_246T04_9000000882cztM0_level2_quad_clean.evt |
| Size (bytes) | 1,311,989,760 | 1,229,618,880 |
| Size | 1.2 GB | 1.1 GB |
| Events in quadrant A | 6,640,882 | 6,955,576 |
| Events in quadrant B | 6,428,682 | 6,974,602 |
| Events in quadrant C | 6,604,759 | 6,734,496 |
| Events in quadrant D | 11,688,386 | 8,205,770 |
| Mode M0 | |||
|---|---|---|---|
| Quadrant | BADHDUFLAG | Total packets | Discarded packets |
| A | 0 | 252496 | 0 |
| B | 0 | 264158 | 0 |
| C | 0 | 250594 | 0 |
| D | 0 | 324225 | 0 |
| Mode SS | |||
|---|---|---|---|
| Quadrant | BADHDUFLAG | Total packets | Discarded packets |
| A | 0 | 2492 | 0 |
| B | 0 | 2494 | 0 |
| C | 0 | 2490 | 0 |
| D | 0 | 2484 | 0 |
| Mode M9 | |||
|---|---|---|---|
| Quadrant | BADHDUFLAG | Total packets | Discarded packets |
| A | 0 | 191 | 0 |
| B | 0 | 191 | 0 |
| C | 0 | 191 | 0 |
| D | 0 | 190 | 0 |
| Quadrant | Total seconds | Saturated seconds | Saturation percentage |
|---|---|---|---|
| A | 122172 | 1427 | 1.168025% |
| B | 122125 | 2299 | 1.882497% |
| C | 122169 | 1001 | 0.819357% |
| D | 122173 | 3835 | 3.138991% |
Noise dominated data is calculated using 1-second bins in cleaned event files. If a bin has >2000 counts, and if more than 50% of those come from <1% of pixels, then it is considered to be noise-dominated and hence unusable.
| Quadrant | # 1 sec bins | Bins with >0 counts | Bins with >2000 counts | High rate bins dominated by noise | Noise dominated (total time) | Noise dominated (detector-on time) | Marked lightcurve |
|---|---|---|---|---|---|---|---|
| A | 142592 | 122957 | 0 | 0 | 0.00% | 0.00% |  |
| B | 142592 | 122887 | 0 | 0 | 0.00% | 0.00% |  |
| C | 142592 | 122968 | 0 | 0 | 0.00% | 0.00% |  |
| D | 142592 | 122967 | 0 | 0 | 0.00% | 0.00% |  |
Top three noisy pixels from each quadrant. If the there are fewer than three noisy pixels in the level2.evt file, extra rows are filled as -1
| Pixel properties | Quadrant properties | ||||||
|---|---|---|---|---|---|---|---|
| Quadrant | DetID | PixID | Counts | Sigma | Mean | Median | Sigma |
| A | 14 | 188 | 6780 | 11.87 | 1723 | 1606 | 435.9 |
| A | 0 | 29 | 6401 | 11.0 | 1723 | 1606 | 435.9 |
| A | 14 | 204 | 5824 | 9.68 | 1723 | 1606 | 435.9 |
| B | 2 | 9 | 5676 | 11.9 | 1697 | 1611 | 341.5 |
| B | 12 | 226 | 4568 | 8.66 | 1697 | 1611 | 341.5 |
| B | 14 | 254 | 4492 | 8.44 | 1697 | 1611 | 341.5 |
| C | 1 | 80 | 4976 | 7.26 | 1745 | 1611 | 463.7 |
| C | 1 | 81 | 4696 | 6.65 | 1745 | 1611 | 463.7 |
| C | 12 | 241 | 4588 | 6.42 | 1745 | 1611 | 463.7 |
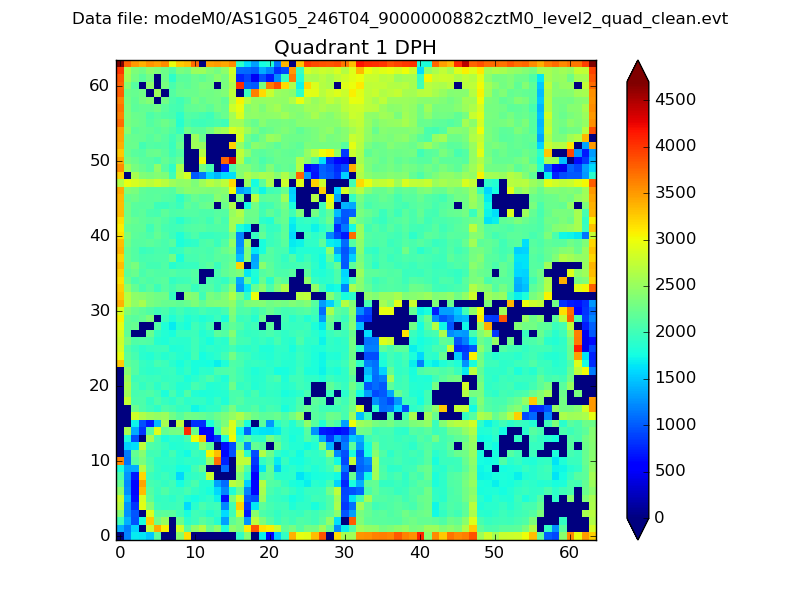
Histogram calculated using DETX and DETY for each event in the final _common_clean file
| Quadrant A |  |
 |
Quadrant B |
|---|---|---|---|
| Quadrant D |  |
 |
Quadrant C |
| Plot type | Count rate plots | Images |
|---|---|---|
| Comparison with Poisson distribution Blue bars denote a histogram of data divided into 1 sec bins. Red curve is a Poisson curve with rate = median count rate of data. |
 |
 |
| Quadrant-wise count rates Data is divided into 100 sec bins |
 |
|
| Module-wise count rates for Quadrant A Data is divided into 100 sec bins |
 |
 |
| Module-wise count rates for Quadrant B Data is divided into 100 sec bins |
 |
 |
| Module-wise count rates for Quadrant C Data is divided into 100 sec bins |
 |
 |
| Module-wise count rates for Quadrant D Data is divided into 100 sec bins |
 |
 |
| Parameter | Plot |
|---|---|
| CZT HV Monitor |  |
| D_VDD |  |
| Temperature 1 |  |
| Veto HV Monitor |  |
| Veto LLD |  |
| Alpha Counter |  |
| _CPM_Rate |  |
| CZT Counter |  |
| +2.5 Volts monitor |  |
| +5 Volts monitor |  |
| _ROLL_ROT |  |
| _Roll_DEC |  |
| _Roll_RA |  |
| Veto Counter |  |