| Param | Original file | Final file |
|---|---|---|
| Filename | modeM0/AS1G05_246T04_9000000882_06547cztM0_level2.evt | modeM0/AS1G05_246T04_9000000882_06547cztM0_level2_quad_clean.evt |
| Size (bytes) | 377,493,120 | 70,346,880 |
| Size | 360.0 MB | 67.1 MB |
| Events in quadrant A | 2,689,773 | 440,330 |
| Events in quadrant B | 2,907,750 | 447,153 |
| Events in quadrant C | 2,421,700 | 444,888 |
| Events in quadrant D | 3,049,475 | 423,657 |
| Mode M0 | |||
|---|---|---|---|
| Quadrant | BADHDUFLAG | Total packets | Discarded packets |
| A | 0 | 11426 | 42 |
| B | 0 | 12171 | 39 |
| C | 0 | 11094 | 46 |
| D | 0 | 12646 | 45 |
| Mode SS | |||
|---|---|---|---|
| Quadrant | BADHDUFLAG | Total packets | Discarded packets |
| A | 0 | 106 | 0 |
| B | 0 | 106 | 0 |
| C | 0 | 106 | 2 |
| D | 0 | 106 | 0 |
| Quadrant | Total seconds | Saturated seconds | Saturation percentage |
|---|---|---|---|
| A | 5343 | 188 | 3.518622% |
| B | 5348 | 283 | 5.291698% |
| C | 5340 | 109 | 2.041199% |
| D | 5344 | 192 | 3.592814% |
Noise dominated data is calculated using 1-second bins in cleaned event files. If a bin has >2000 counts, and if more than 50% of those come from <1% of pixels, then it is considered to be noise-dominated and hence unusable.
| Quadrant | # 1 sec bins | Bins with >0 counts | Bins with >2000 counts | High rate bins dominated by noise | Noise dominated (total time) | Noise dominated (detector-on time) | Marked lightcurve |
|---|---|---|---|---|---|---|---|
| A | 5377 | 5363 | 0 | 0 | 0.00% | 0.00% | 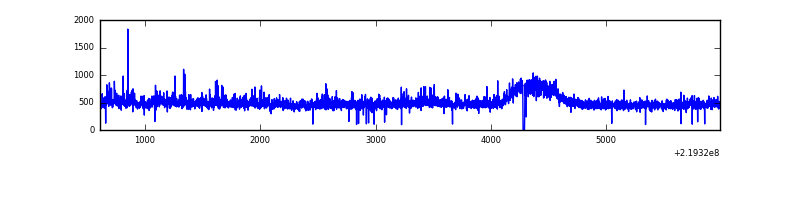 |
| B | 5377 | 5362 | 53 | 53 | 0.99% | 0.99% |  |
| C | 5377 | 5363 | 0 | 0 | 0.00% | 0.00% | 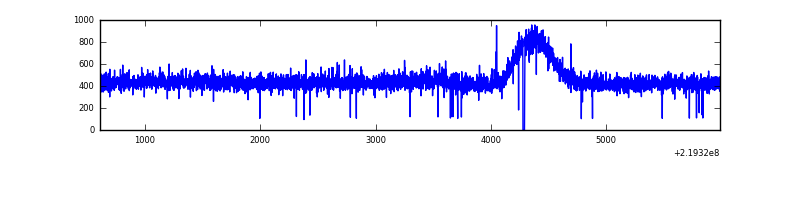 |
| D | 5377 | 5363 | 44 | 44 | 0.82% | 0.82% | 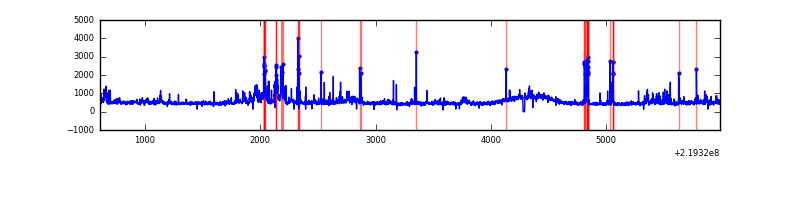 |
Top three noisy pixels from each quadrant. If the there are fewer than three noisy pixels in the level2.evt file, extra rows are filled as -1
| Pixel properties | Quadrant properties | ||||||
|---|---|---|---|---|---|---|---|
| Quadrant | DetID | PixID | Counts | Sigma | Mean | Median | Sigma |
| A | 8 | 15 | 228544 | 1725.26 | 634 | 618 | 132.1 |
| A | 13 | 251 | 6443 | 44.09 | 634 | 618 | 132.1 |
| A | 0 | 226 | 6311 | 43.09 | 634 | 618 | 132.1 |
| B | 4 | 48 | 137546 | 1120.96 | 635 | 618 | 122.2 |
| B | 0 | 219 | 66685 | 540.86 | 635 | 618 | 122.2 |
| B | 4 | 80 | 59502 | 482.05 | 635 | 618 | 122.2 |
| C | 8 | 128 | 5799 | 35.88 | 616 | 616 | 144.4 |
| C | 13 | 61 | 5020 | 30.49 | 616 | 616 | 144.4 |
| C | 8 | 112 | 4098 | 24.11 | 616 | 616 | 144.4 |
| D | 2 | 63 | 314320 | 2058.62 | 615 | 592 | 152.4 |
| D | 2 | 33 | 124359 | 812.14 | 615 | 592 | 152.4 |
| D | 14 | 173 | 120378 | 786.01 | 615 | 592 | 152.4 |
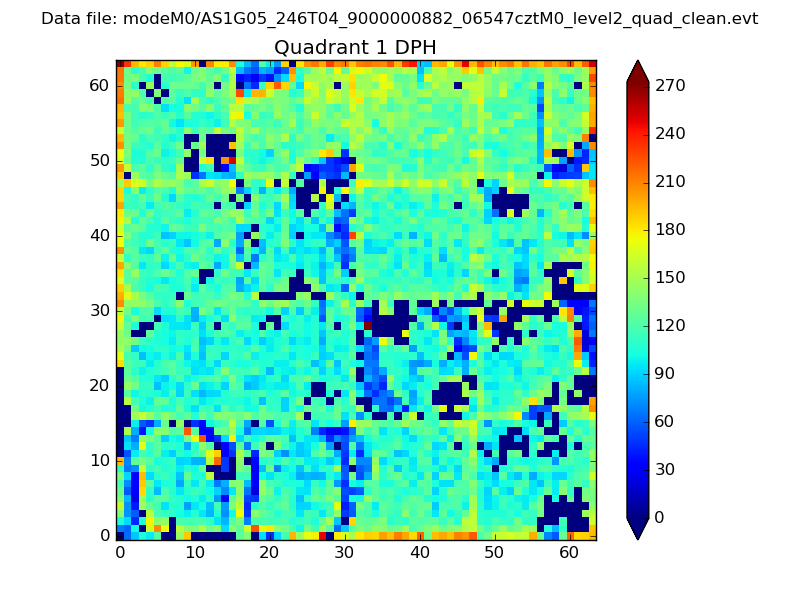
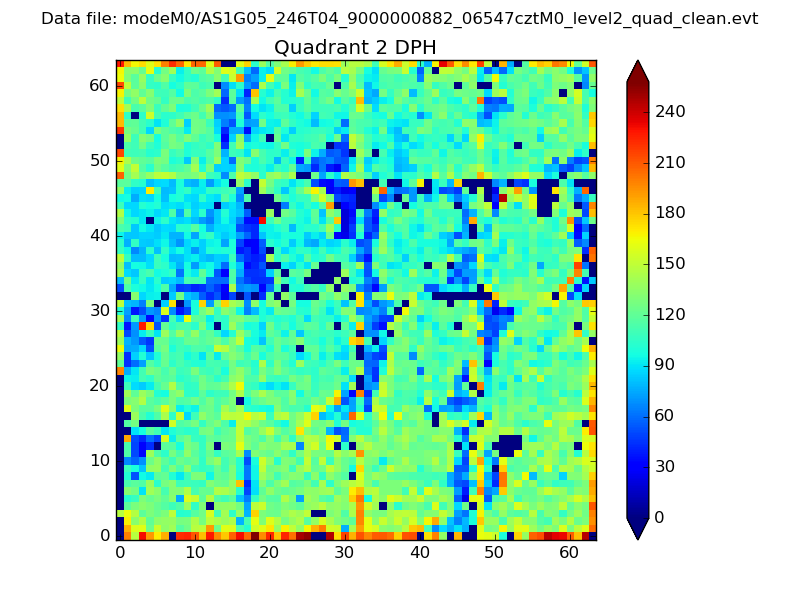
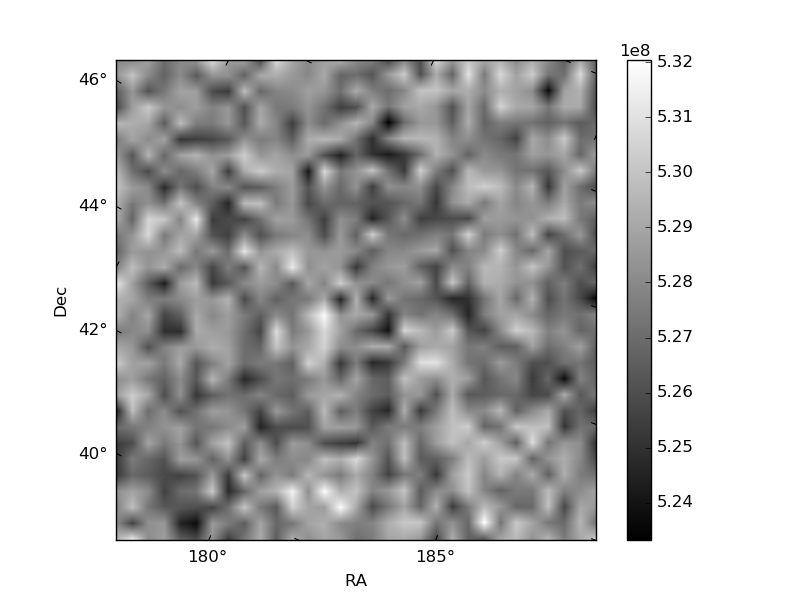
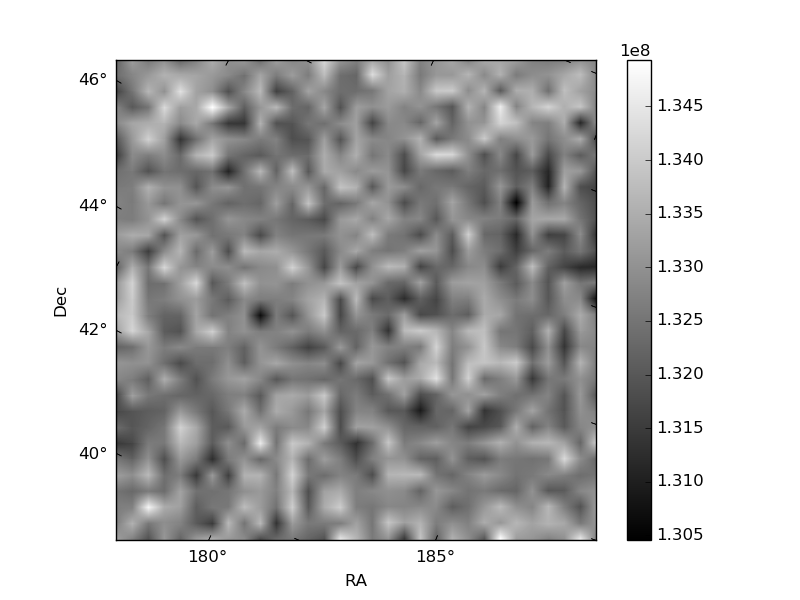
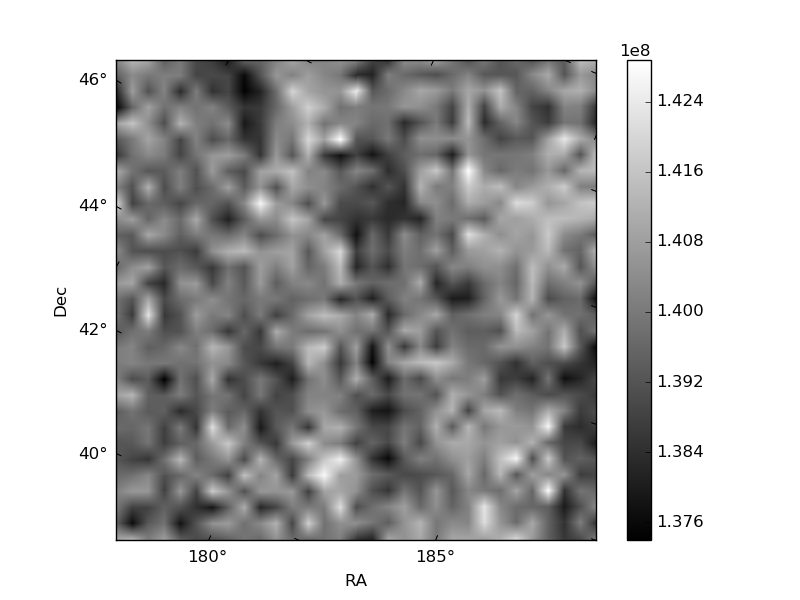
Histogram calculated using DETX and DETY for each event in the final _common_clean file
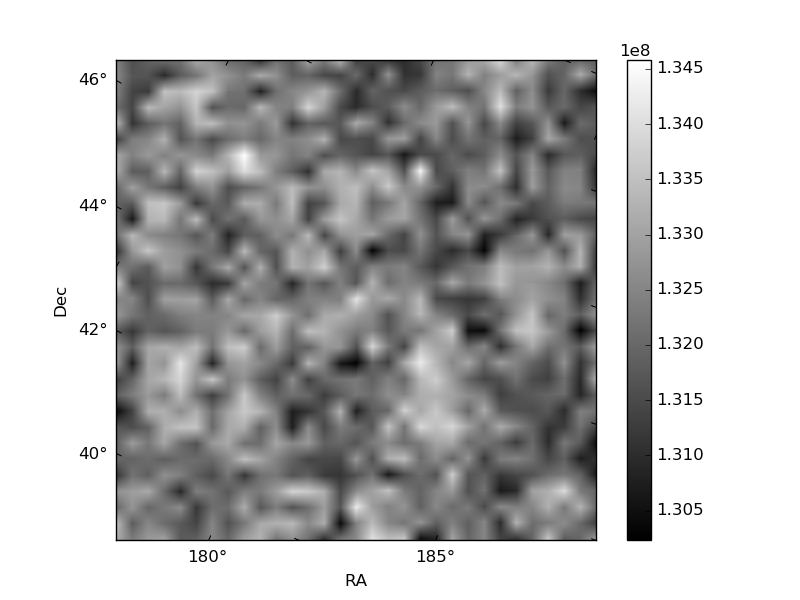
| Quadrant A | 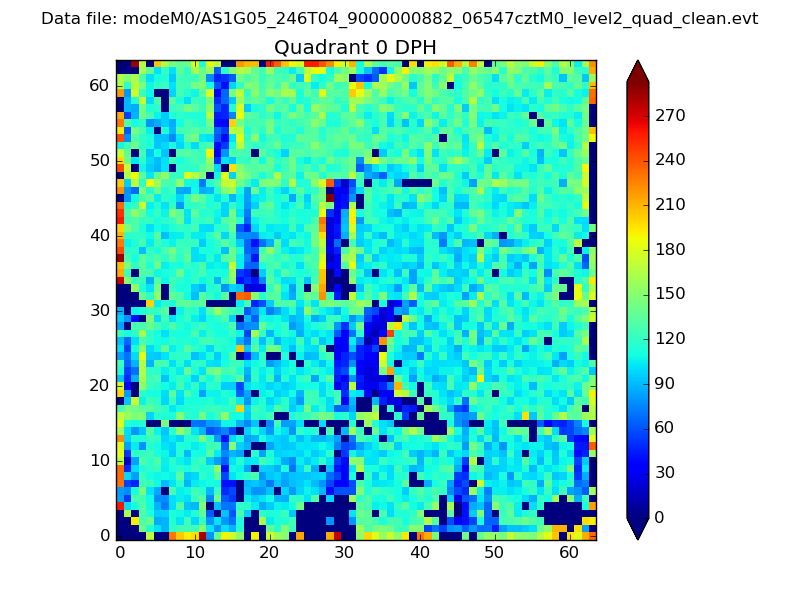 |
 |
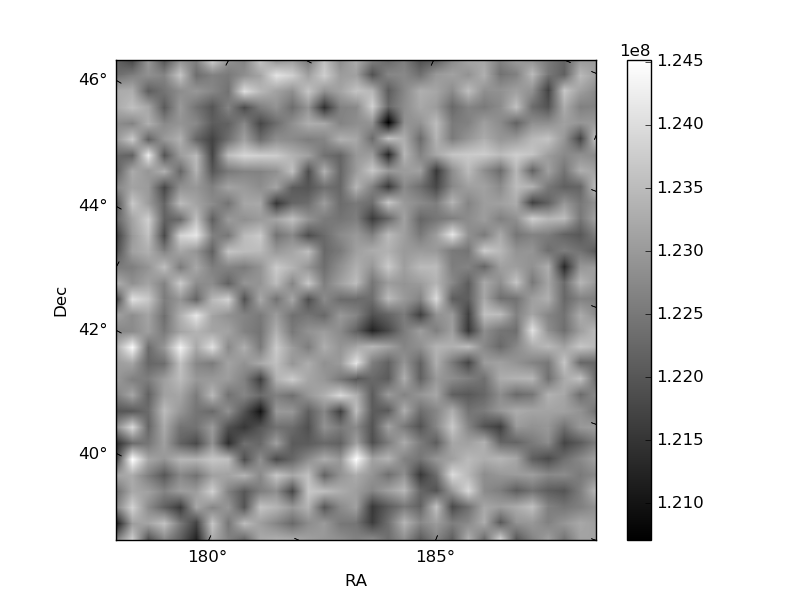
Quadrant B |
|---|---|---|---|
| Quadrant D | 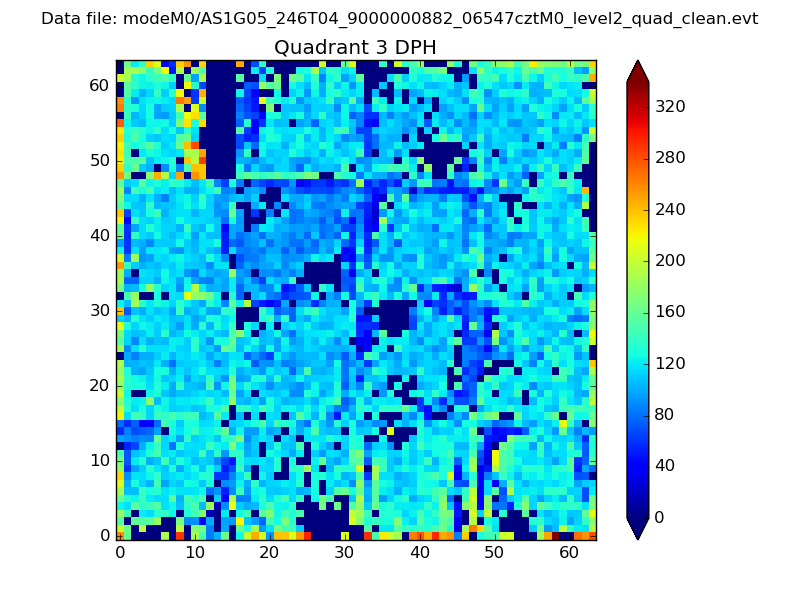 |
 |
Quadrant C |
| Plot type | Count rate plots | Images |
|---|---|---|
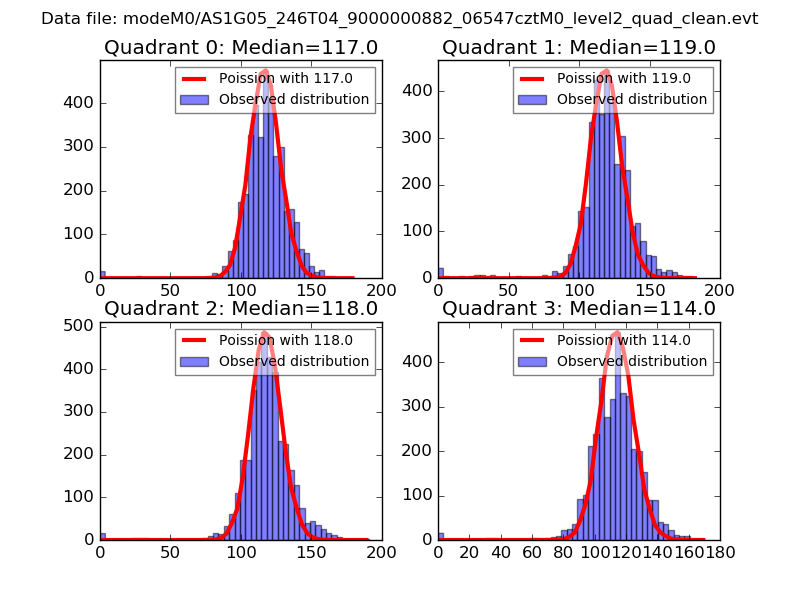
| Comparison with Poisson distribution Blue bars denote a histogram of data divided into 1 sec bins. Red curve is a Poisson curve with rate = median count rate of data. |
 |
 |
| Quadrant-wise count rates Data is divided into 100 sec bins |
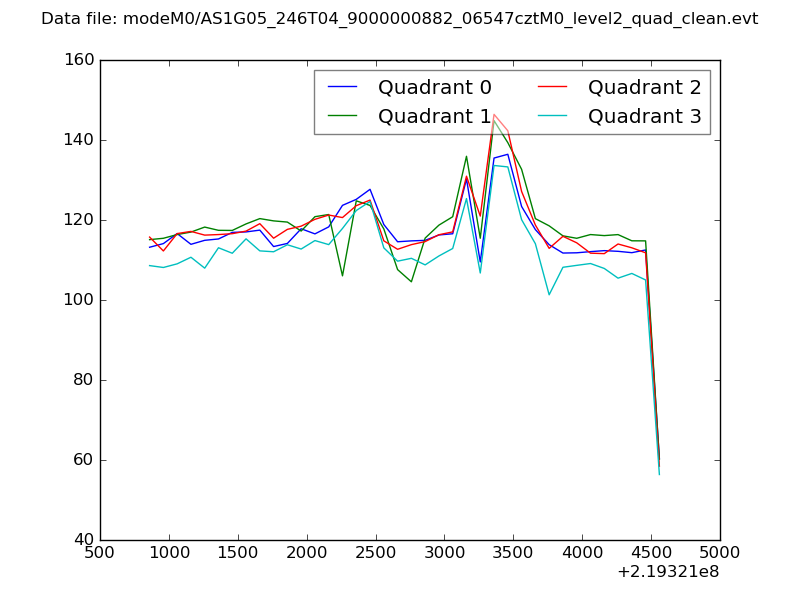 |
|
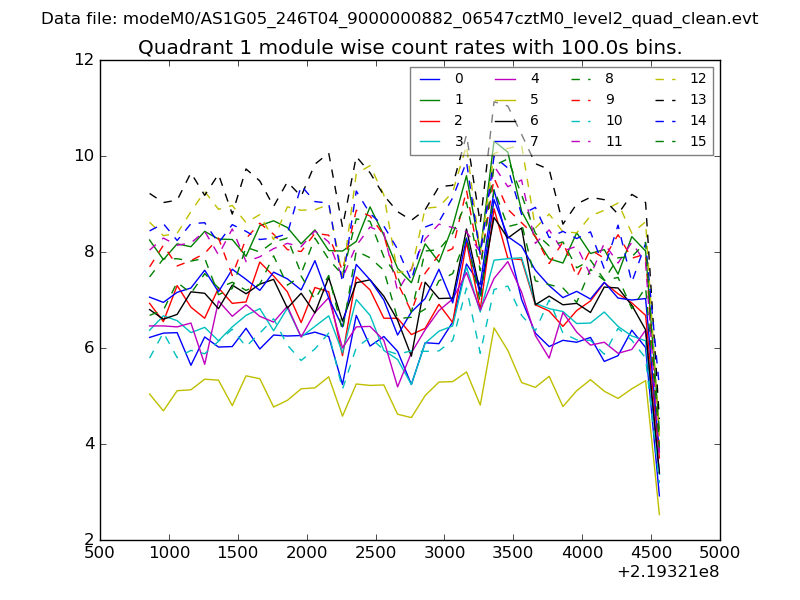
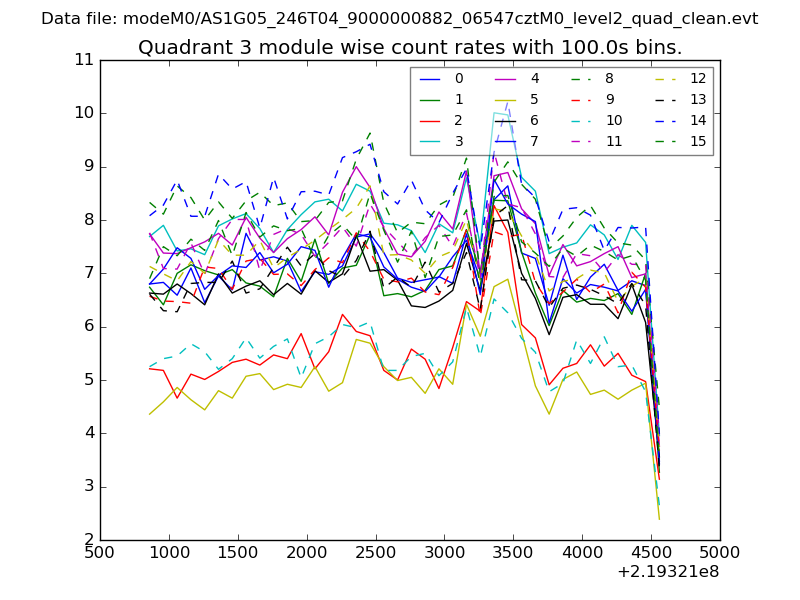
| Module-wise count rates for Quadrant A Data is divided into 100 sec bins |
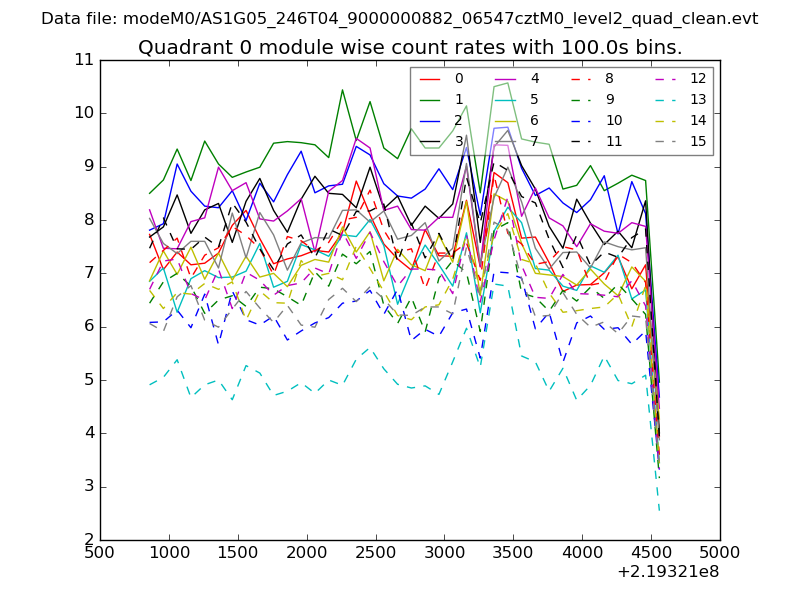 |
 |
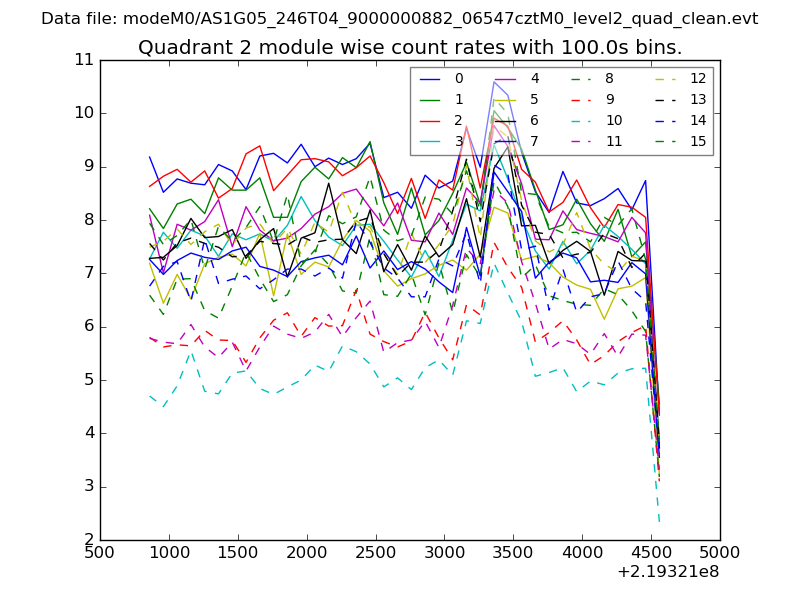
| Module-wise count rates for Quadrant B Data is divided into 100 sec bins |
 |
 |
| Module-wise count rates for Quadrant C Data is divided into 100 sec bins |
 |
 |
| Module-wise count rates for Quadrant D Data is divided into 100 sec bins |
 |
 |
| Parameter | Plot |
|---|---|
| CZT HV Monitor | 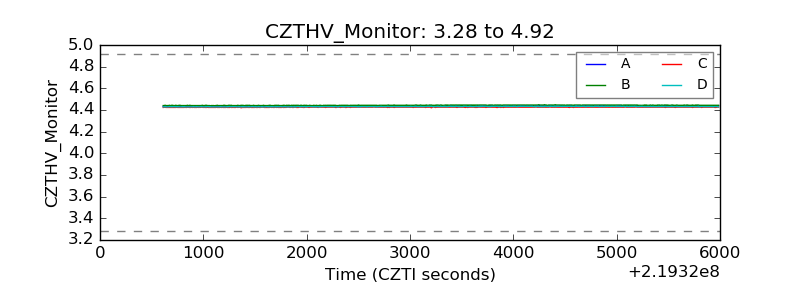 |
| D_VDD | 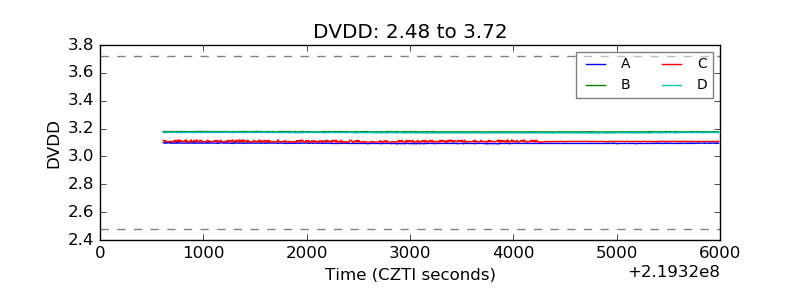 |
| Temperature 1 | 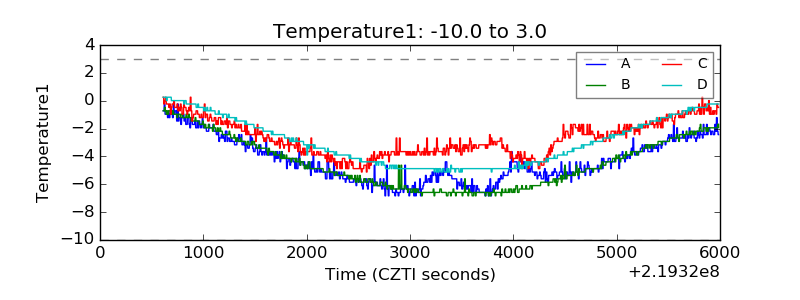 |
| Veto HV Monitor | 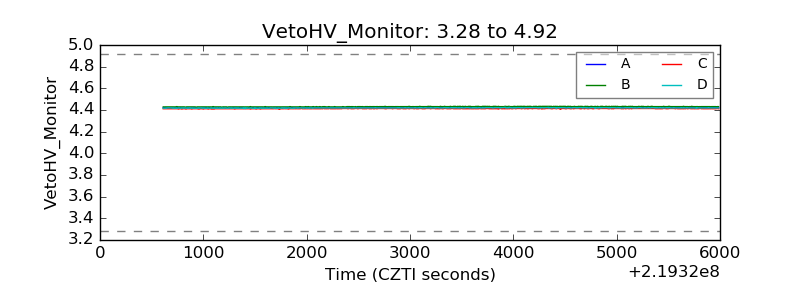 |
| Veto LLD | 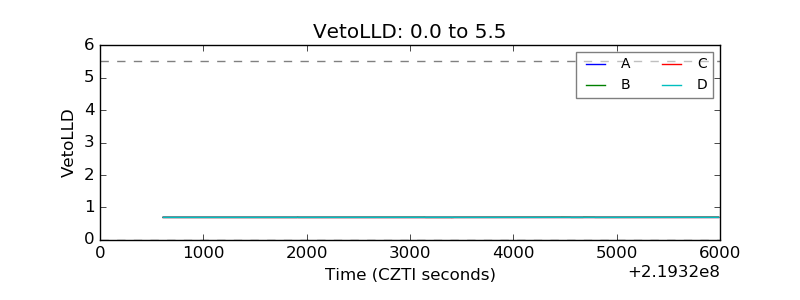 |
| Alpha Counter | 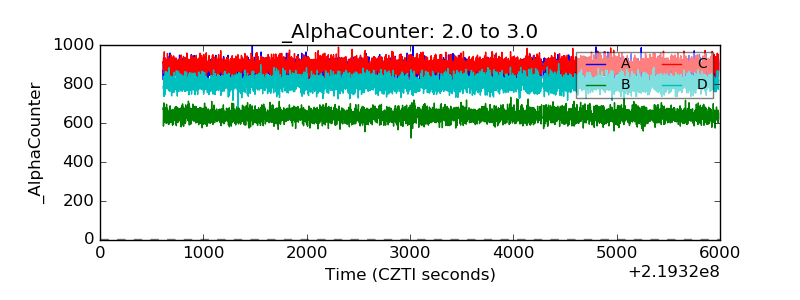 |
| _CPM_Rate | 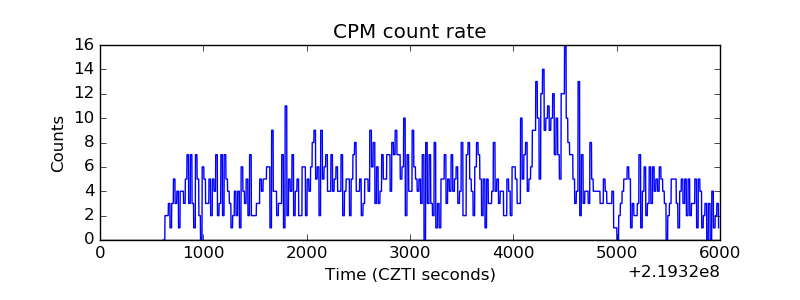 |
| CZT Counter | 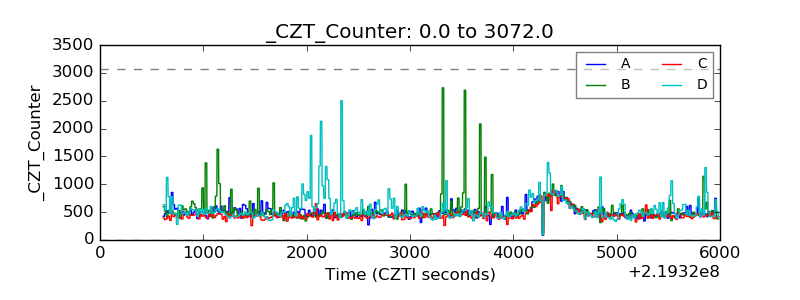 |
| +2.5 Volts monitor | 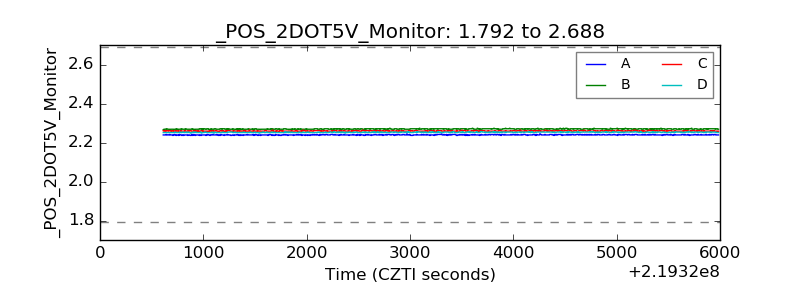 |
| +5 Volts monitor | 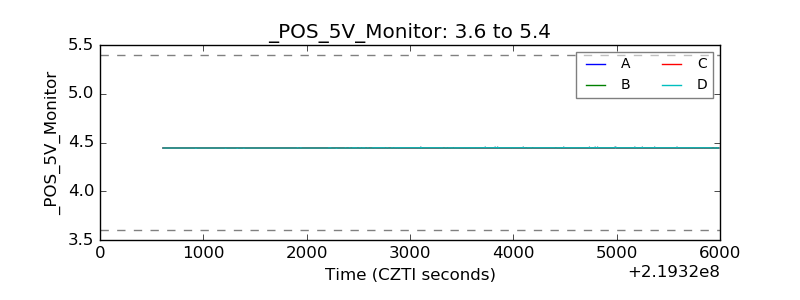 |
| _ROLL_ROT | 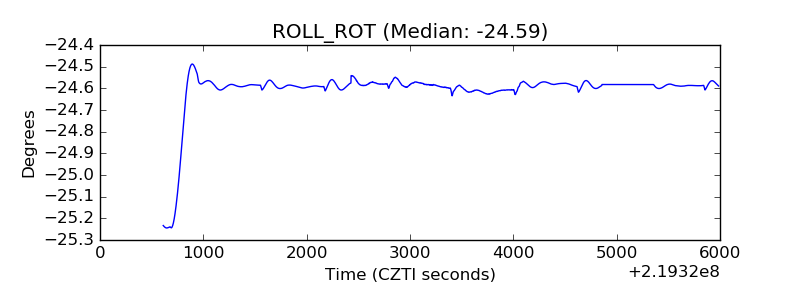 |
| _Roll_DEC | 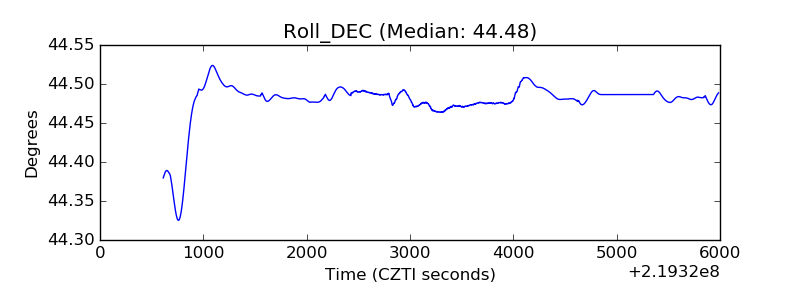 |
| _Roll_RA | 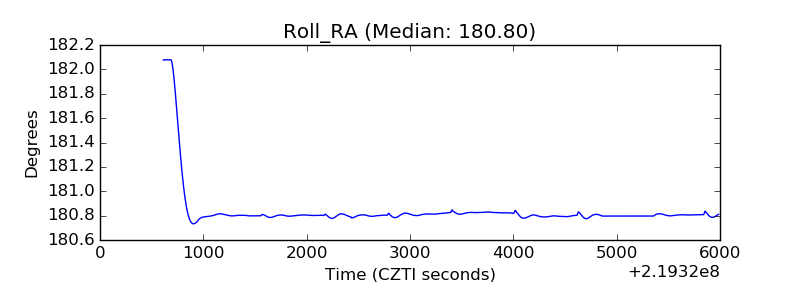 |
| Veto Counter | 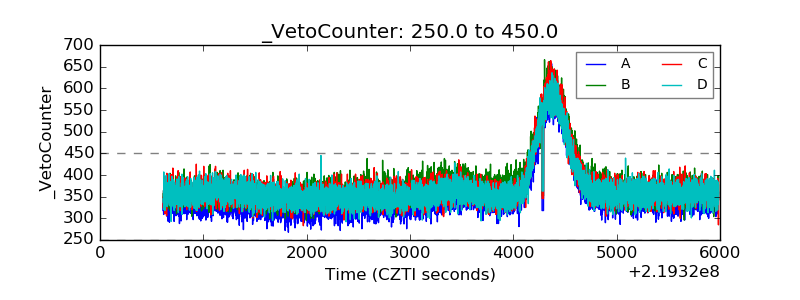 |