| Param | Original file | Final file |
|---|---|---|
| Filename | modeM0/AS1G05_246T04_9000000882_06548cztM0_level2.evt | modeM0/AS1G05_246T04_9000000882_06548cztM0_level2_quad_clean.evt |
| Size (bytes) | 202,959,360 | 26,288,640 |
| Size | 193.6 MB | 25.1 MB |
| Events in quadrant A | 1,373,654 | 148,188 |
| Events in quadrant B | 1,471,508 | 153,896 |
| Events in quadrant C | 1,259,313 | 151,217 |
| Events in quadrant D | 1,850,570 | 142,858 |
| Mode M0 | |||
|---|---|---|---|
| Quadrant | BADHDUFLAG | Total packets | Discarded packets |
| A | 0 | 5880 | 1 |
| B | 0 | 6137 | 0 |
| C | 0 | 5794 | 0 |
| D | 0 | 7428 | 0 |
| Mode SS | |||
|---|---|---|---|
| Quadrant | BADHDUFLAG | Total packets | Discarded packets |
| A | 0 | 56 | 0 |
| B | 0 | 56 | 0 |
| C | 0 | 56 | 0 |
| D | 0 | 56 | 0 |
| Quadrant | Total seconds | Saturated seconds | Saturation percentage |
|---|---|---|---|
| A | 2787 | 108 | 3.875135% |
| B | 2787 | 122 | 4.377467% |
| C | 2787 | 70 | 2.511661% |
| D | 2787 | 120 | 4.305705% |
Noise dominated data is calculated using 1-second bins in cleaned event files. If a bin has >2000 counts, and if more than 50% of those come from <1% of pixels, then it is considered to be noise-dominated and hence unusable.
| Quadrant | # 1 sec bins | Bins with >0 counts | Bins with >2000 counts | High rate bins dominated by noise | Noise dominated (total time) | Noise dominated (detector-on time) | Marked lightcurve |
|---|---|---|---|---|---|---|---|
| A | 2787 | 2787 | 0 | 0 | 0.00% | 0.00% | 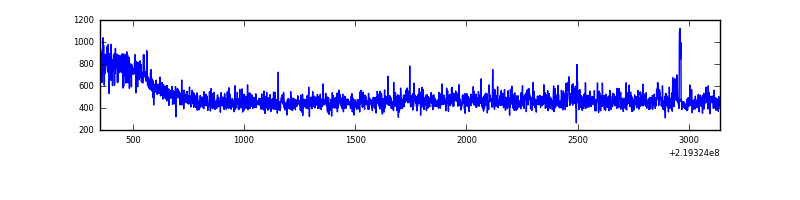 |
| B | 2787 | 2787 | 0 | 0 | 0.00% | 0.00% | 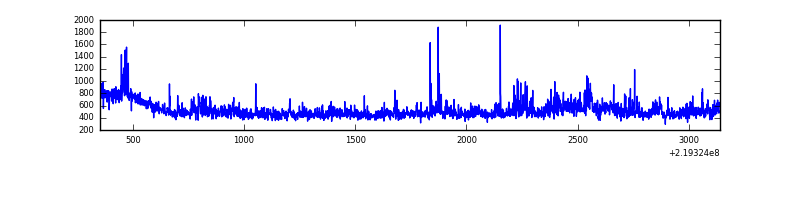 |
| C | 2787 | 2787 | 0 | 0 | 0.00% | 0.00% | 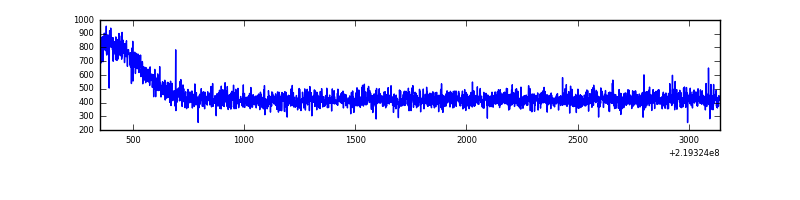 |
| D | 2787 | 2787 | 27 | 27 | 0.97% | 0.97% | 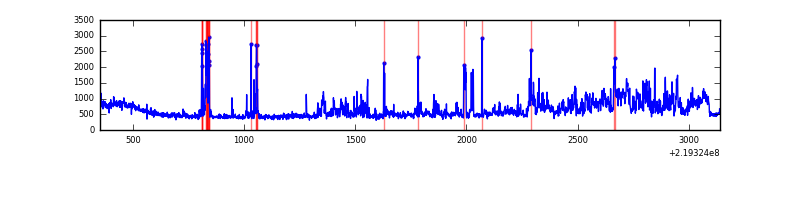 |
Top three noisy pixels from each quadrant. If the there are fewer than three noisy pixels in the level2.evt file, extra rows are filled as -1
| Pixel properties | Quadrant properties | ||||||
|---|---|---|---|---|---|---|---|
| Quadrant | DetID | PixID | Counts | Sigma | Mean | Median | Sigma |
| A | 8 | 15 | 73300 | 1031.07 | 335 | 327 | 70.8 |
| A | 15 | 236 | 6950 | 93.58 | 335 | 327 | 70.8 |
| A | 0 | 226 | 3307 | 42.11 | 335 | 327 | 70.8 |
| B | 8 | 3 | 46358 | 694.73 | 333 | 323 | 66.3 |
| B | 0 | 214 | 34588 | 517.11 | 333 | 323 | 66.3 |
| B | 4 | 81 | 24653 | 367.17 | 333 | 323 | 66.3 |
| C | 13 | 61 | 2562 | 29.43 | 322 | 322 | 76.1 |
| C | 8 | 222 | 920 | 7.86 | 322 | 322 | 76.1 |
| C | 1 | 16 | 819 | 6.53 | 322 | 322 | 76.1 |
| D | 2 | 63 | 306974 | 3745.38 | 325 | 314 | 81.9 |
| D | 1 | 239 | 185126 | 2257.2 | 325 | 314 | 81.9 |
| D | 14 | 34 | 25856 | 311.96 | 325 | 314 | 81.9 |
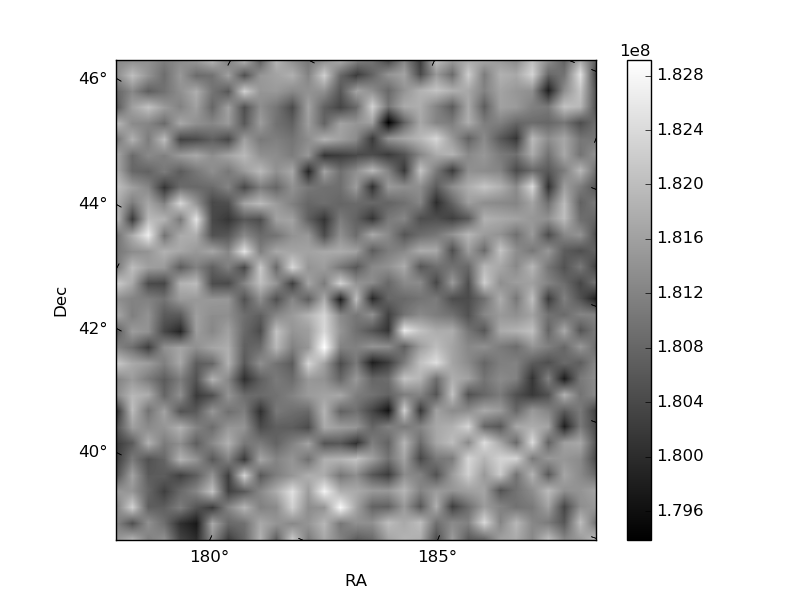
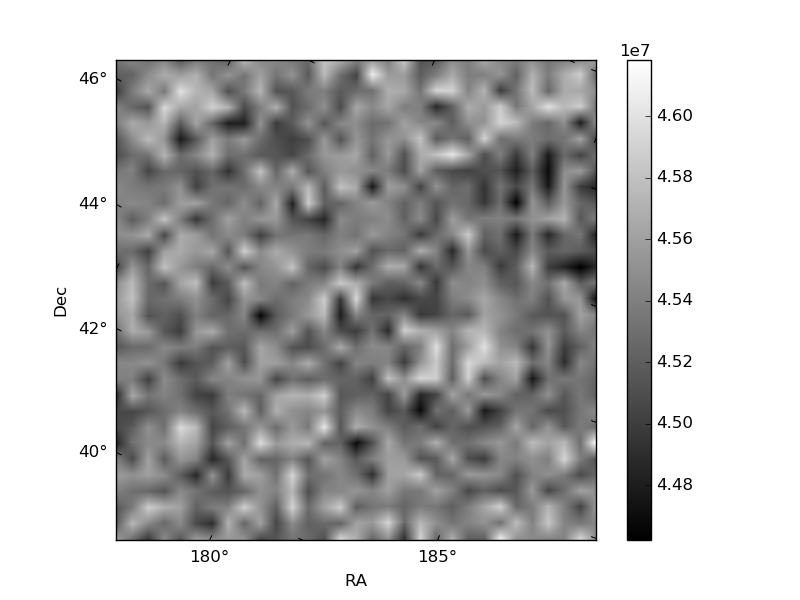
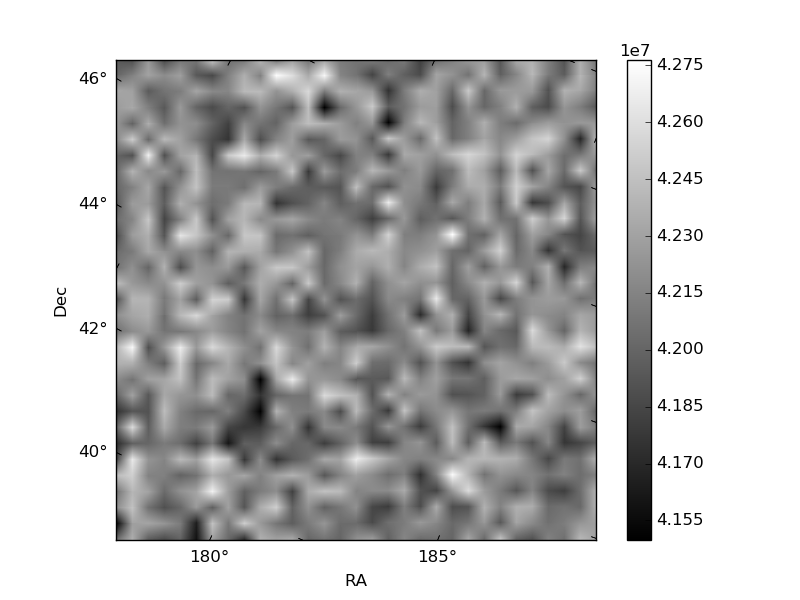
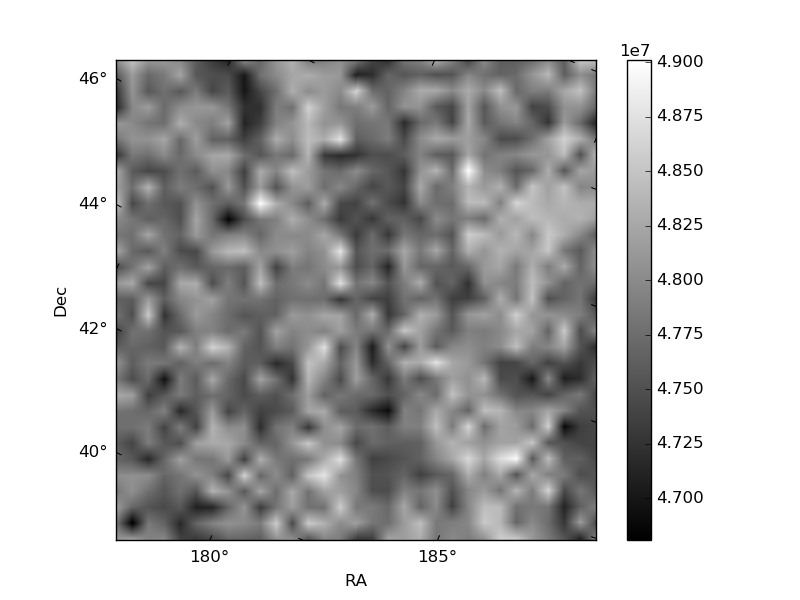
Histogram calculated using DETX and DETY for each event in the final _common_clean file
| Quadrant A | 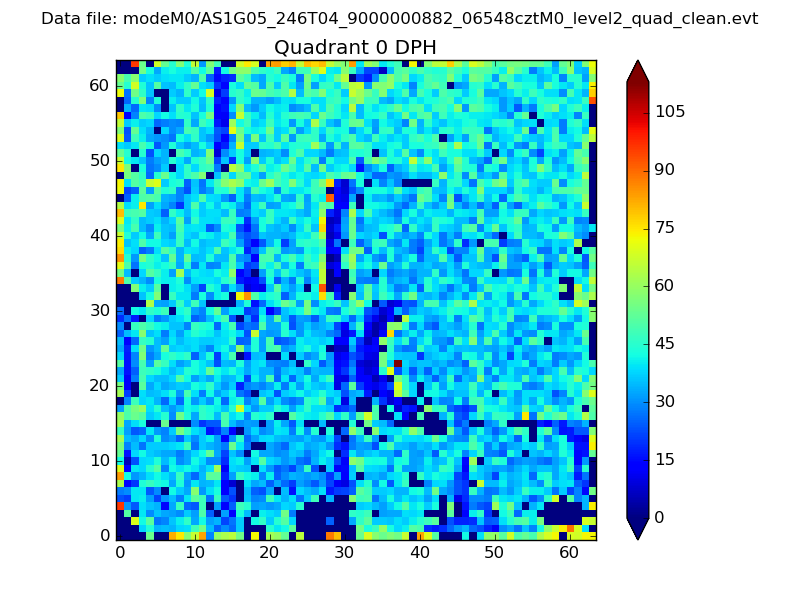 |
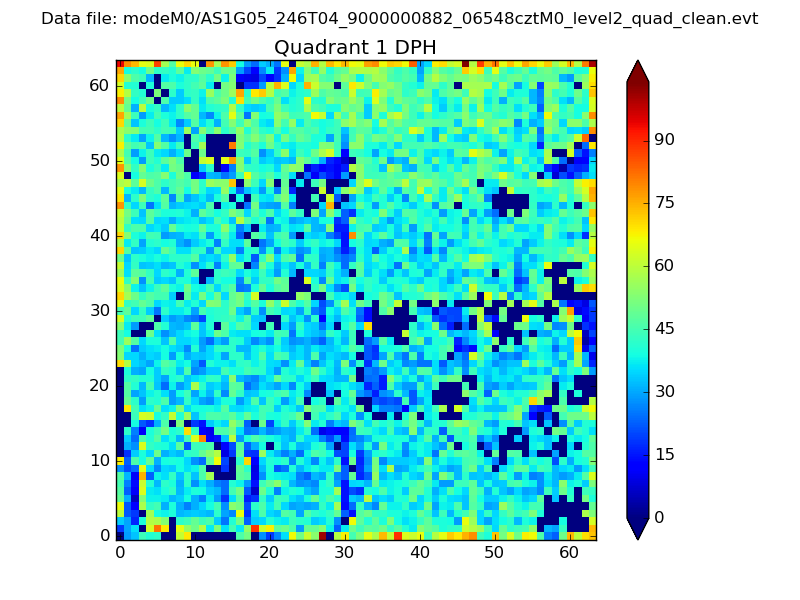 |
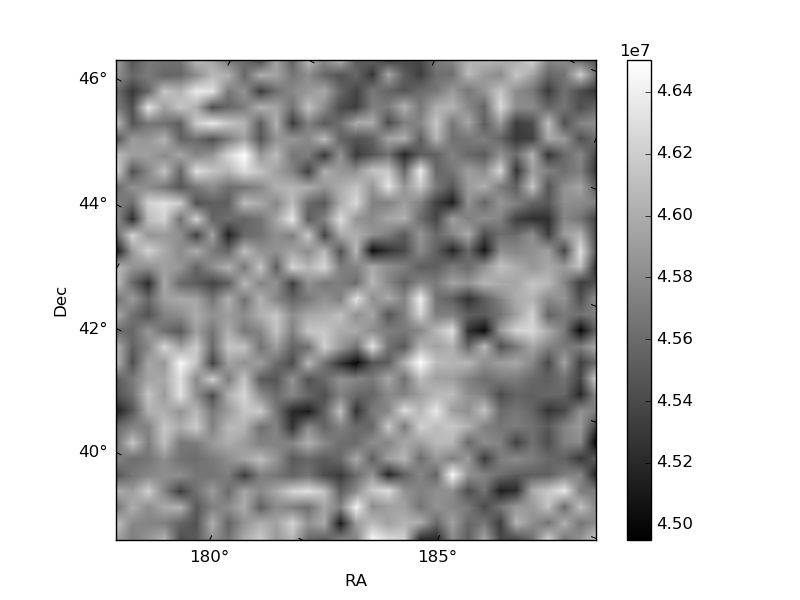
Quadrant B |
|---|---|---|---|
| Quadrant D | 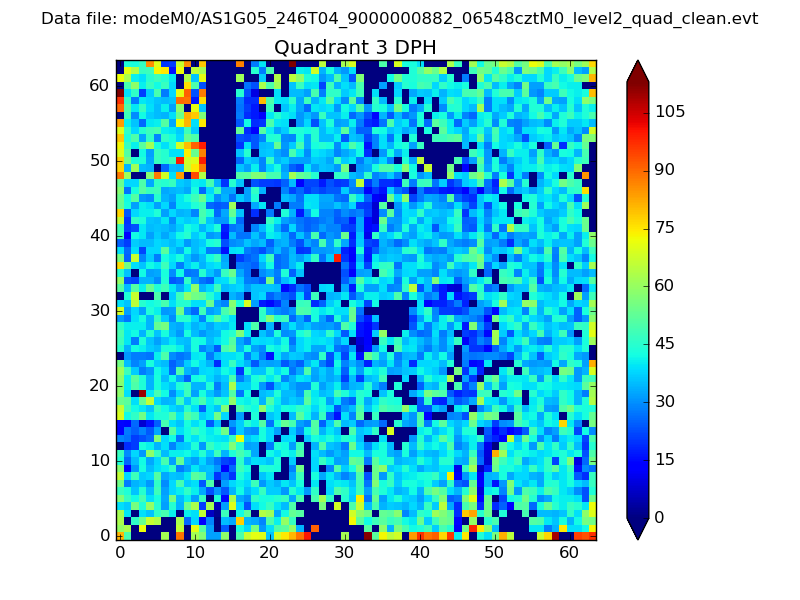 |
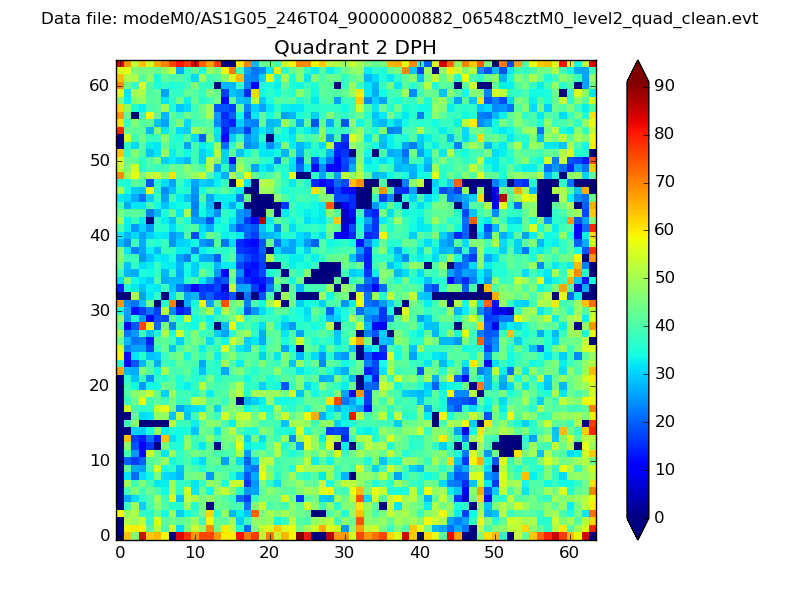 |
Quadrant C |
| Plot type | Count rate plots | Images |
|---|---|---|
| Comparison with Poisson distribution Blue bars denote a histogram of data divided into 1 sec bins. Red curve is a Poisson curve with rate = median count rate of data. |
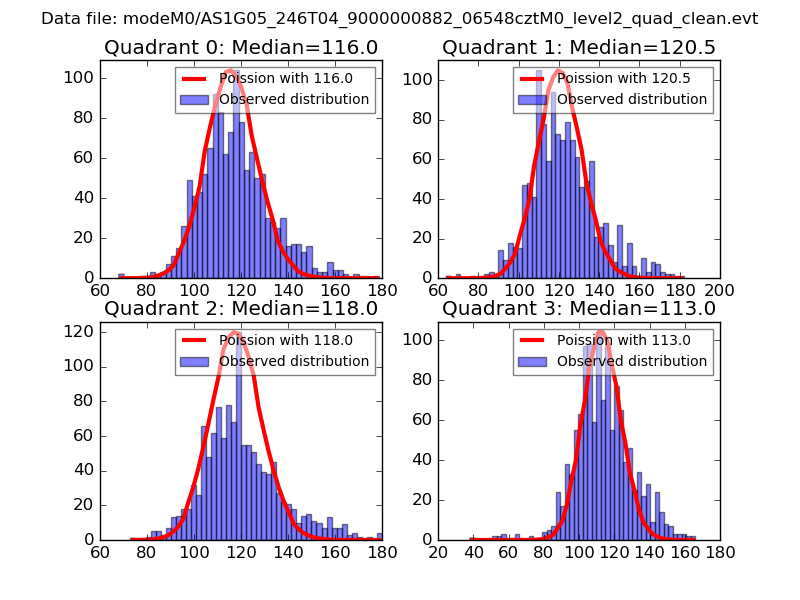 |
 |
| Quadrant-wise count rates Data is divided into 100 sec bins |
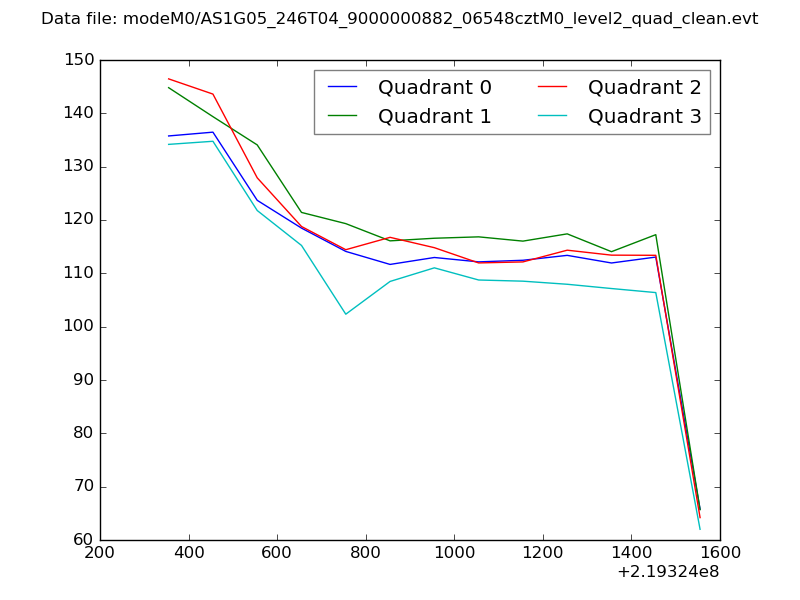 |
|
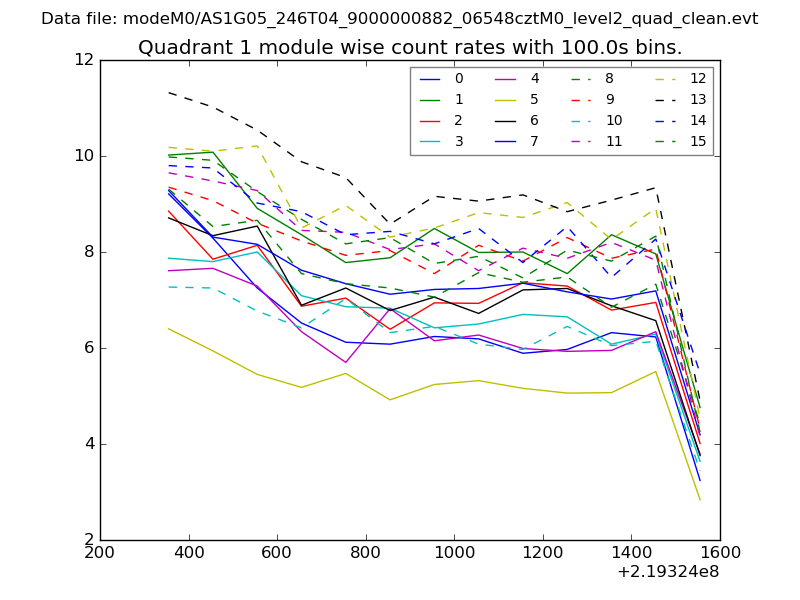
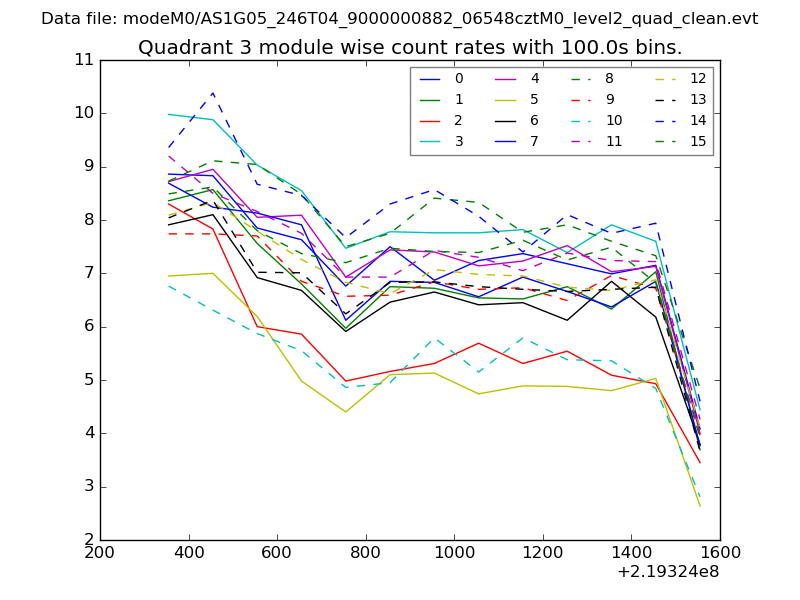
| Module-wise count rates for Quadrant A Data is divided into 100 sec bins |
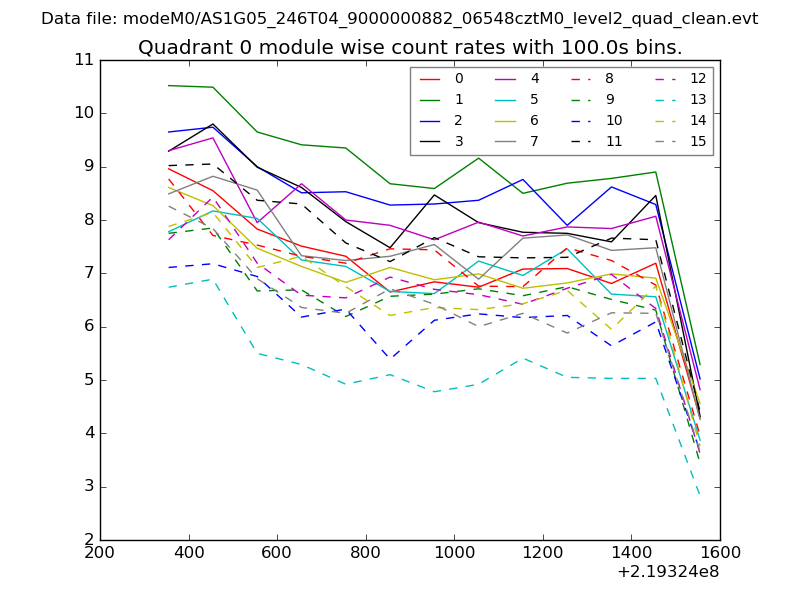 |
 |
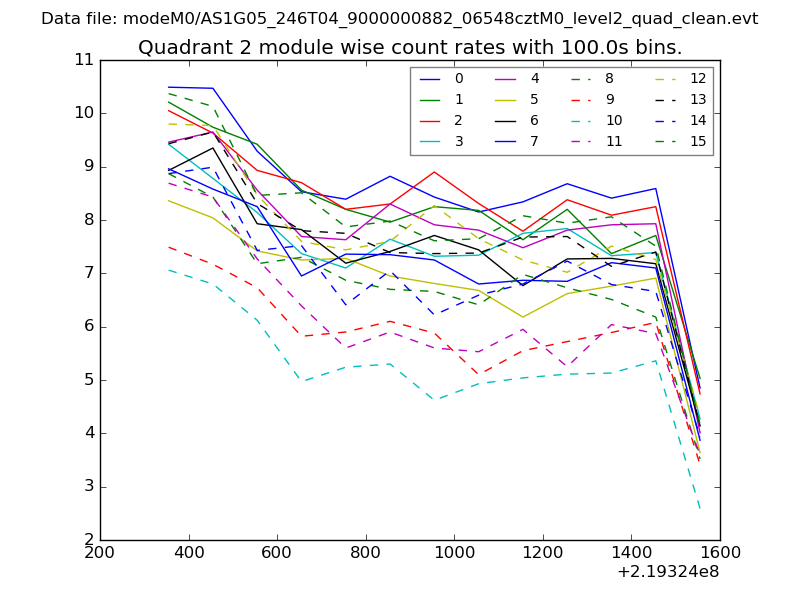
| Module-wise count rates for Quadrant B Data is divided into 100 sec bins |
 |
 |
| Module-wise count rates for Quadrant C Data is divided into 100 sec bins |
 |
 |
| Module-wise count rates for Quadrant D Data is divided into 100 sec bins |
 |
 |
| Parameter | Plot |
|---|---|
| CZT HV Monitor | 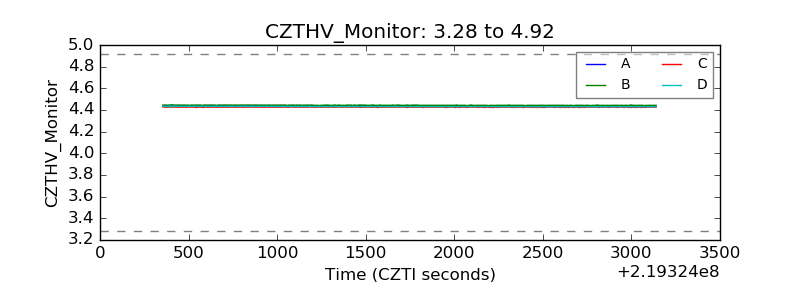 |
| D_VDD | 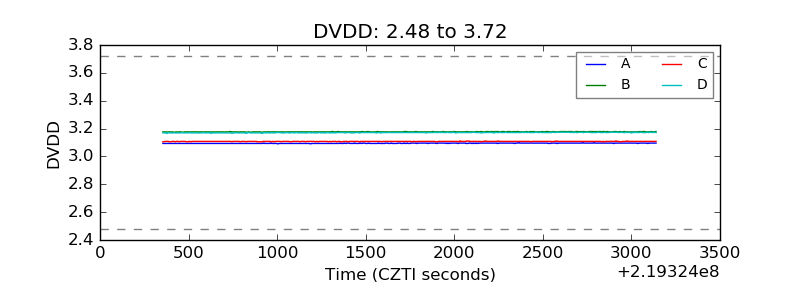 |
| Temperature 1 | 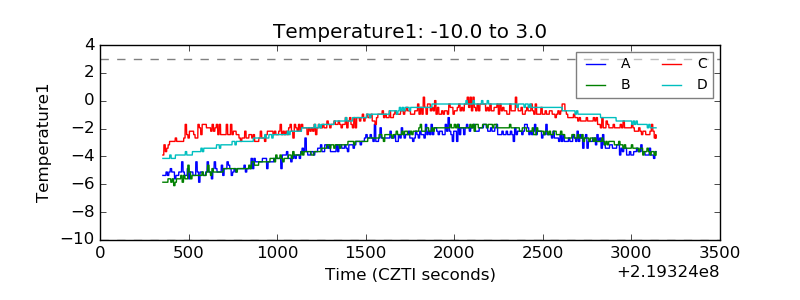 |
| Veto HV Monitor | 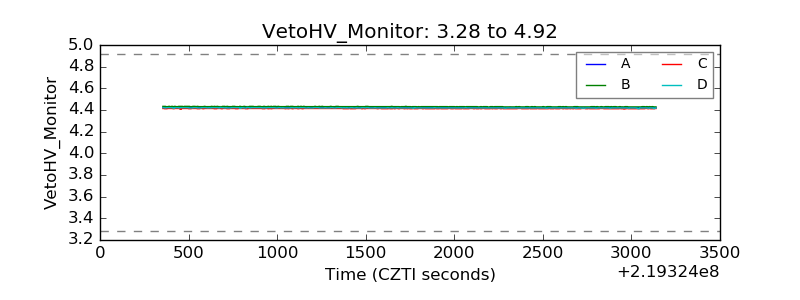 |
| Veto LLD | 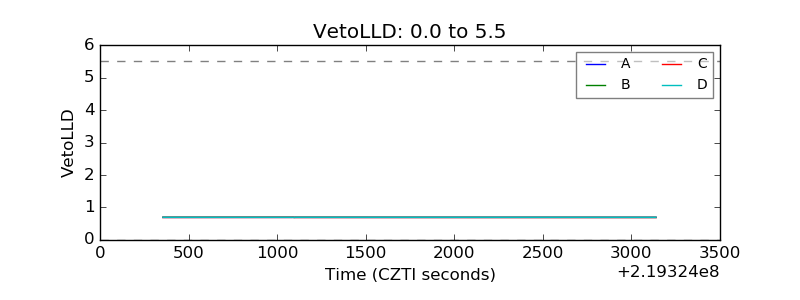 |
| Alpha Counter | 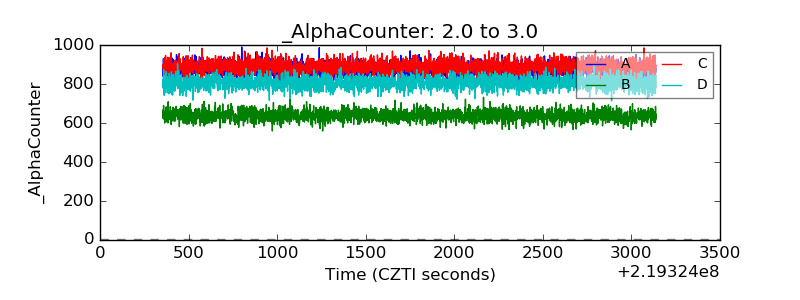 |
| _CPM_Rate | 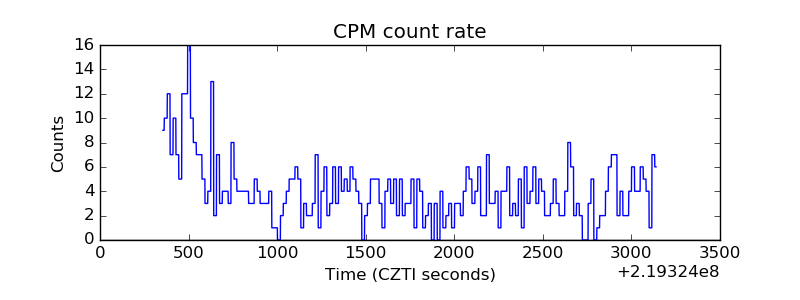 |
| CZT Counter | 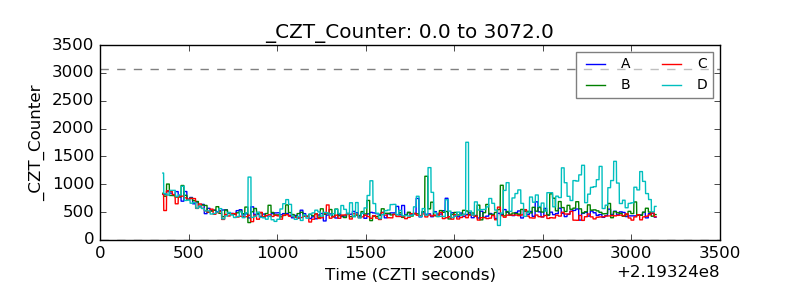 |
| +2.5 Volts monitor |  |
| +5 Volts monitor | 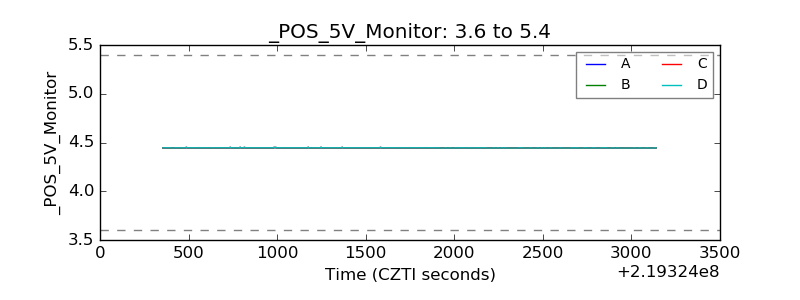 |
| _ROLL_ROT | 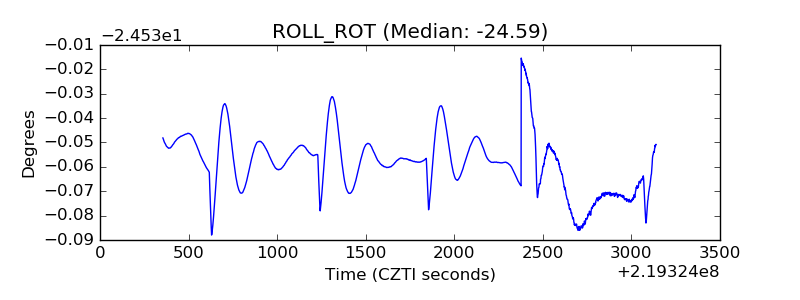 |
| _Roll_DEC | 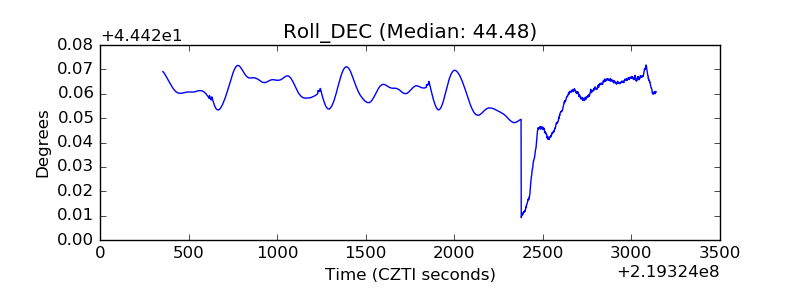 |
| _Roll_RA | 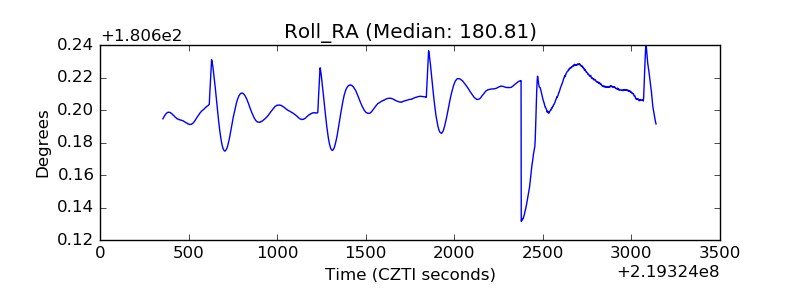 |
| Veto Counter | 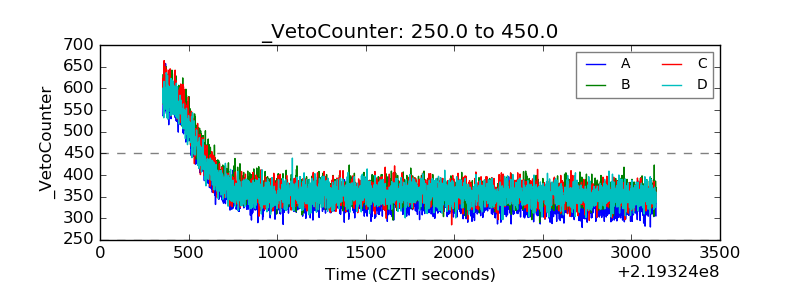 |