| Param | Original file | Final file |
|---|---|---|
| Filename | modeM0/AS1G05_246T04_9000000882_06551cztM0_level2.evt | modeM0/AS1G05_246T04_9000000882_06551cztM0_level2_quad_clean.evt |
| Size (bytes) | 498,614,400 | 85,947,840 |
| Size | 475.5 MB | 82.0 MB |
| Events in quadrant A | 3,556,959 | 520,203 |
| Events in quadrant B | 3,783,359 | 524,909 |
| Events in quadrant C | 3,433,399 | 523,000 |
| Events in quadrant D | 3,811,284 | 506,577 |
| Mode M0 | |||
|---|---|---|---|
| Quadrant | BADHDUFLAG | Total packets | Discarded packets |
| A | 0 | 15609 | 3 |
| B | 0 | 16289 | 2 |
| C | 0 | 15499 | 5 |
| D | 0 | 16606 | 2 |
| Mode SS | |||
|---|---|---|---|
| Quadrant | BADHDUFLAG | Total packets | Discarded packets |
| A | 0 | 156 | 0 |
| B | 0 | 156 | 0 |
| C | 0 | 156 | 0 |
| D | 0 | 156 | 0 |
| Mode M9 | |||
|---|---|---|---|
| Quadrant | BADHDUFLAG | Total packets | Discarded packets |
| A | 0 | 16 | 0 |
| B | 0 | 16 | 0 |
| C | 0 | 16 | 0 |
| D | 0 | 16 | 0 |
| Quadrant | Total seconds | Saturated seconds | Saturation percentage |
|---|---|---|---|
| A | 7589 | 81 | 1.067334% |
| B | 7589 | 129 | 1.699829% |
| C | 7588 | 74 | 0.975224% |
| D | 7589 | 94 | 1.238635% |
Noise dominated data is calculated using 1-second bins in cleaned event files. If a bin has >2000 counts, and if more than 50% of those come from <1% of pixels, then it is considered to be noise-dominated and hence unusable.
| Quadrant | # 1 sec bins | Bins with >0 counts | Bins with >2000 counts | High rate bins dominated by noise | Noise dominated (total time) | Noise dominated (detector-on time) | Marked lightcurve |
|---|---|---|---|---|---|---|---|
| A | 9229 | 7591 | 0 | 0 | 0.00% | 0.00% | 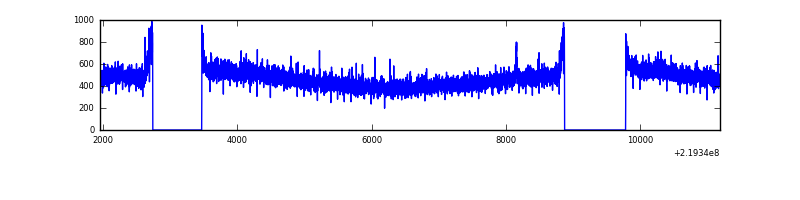 |
| B | 9229 | 7591 | 19 | 19 | 0.21% | 0.25% | 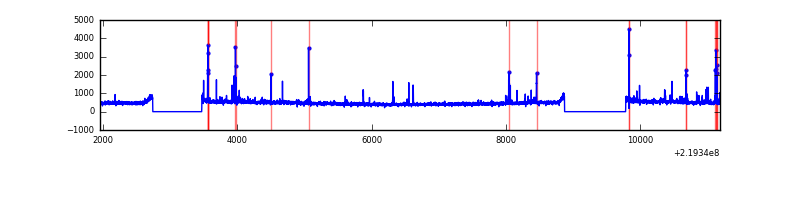 |
| C | 9229 | 7591 | 0 | 0 | 0.00% | 0.00% | 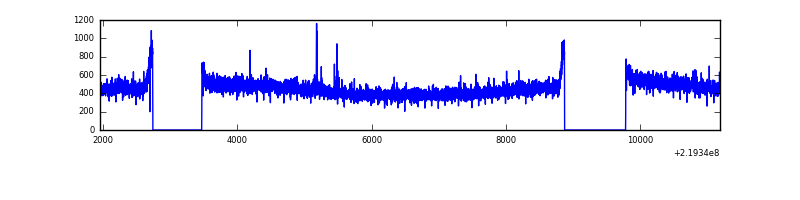 |
| D | 9229 | 7591 | 14 | 14 | 0.15% | 0.18% | 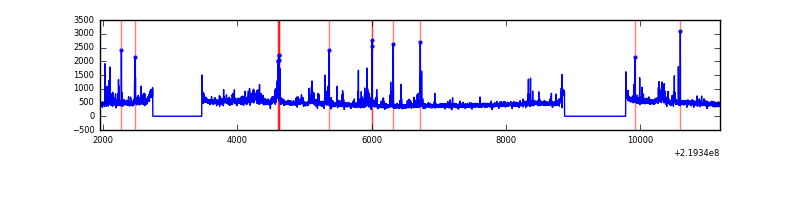 |
Top three noisy pixels from each quadrant. If the there are fewer than three noisy pixels in the level2.evt file, extra rows are filled as -1
| Pixel properties | Quadrant properties | ||||||
|---|---|---|---|---|---|---|---|
| Quadrant | DetID | PixID | Counts | Sigma | Mean | Median | Sigma |
| A | 8 | 15 | 89924 | 486.48 | 896 | 875 | 183.0 |
| A | 0 | 226 | 8628 | 42.35 | 896 | 875 | 183.0 |
| A | 12 | 194 | 8196 | 39.99 | 896 | 875 | 183.0 |
| B | 4 | 81 | 78371 | 448.39 | 897 | 874 | 172.8 |
| B | 8 | 3 | 64493 | 368.09 | 897 | 874 | 172.8 |
| B | 0 | 214 | 57349 | 326.76 | 897 | 874 | 172.8 |
| C | 9 | 54 | 12980 | 59.07 | 875 | 877 | 204.9 |
| C | 13 | 61 | 6839 | 29.1 | 875 | 877 | 204.9 |
| C | 14 | 67 | 4135 | 15.9 | 875 | 877 | 204.9 |
| D | 2 | 63 | 113766 | 524.3 | 877 | 849 | 215.4 |
| D | 14 | 34 | 112553 | 518.67 | 877 | 849 | 215.4 |
| D | 12 | 221 | 79017 | 362.95 | 877 | 849 | 215.4 |
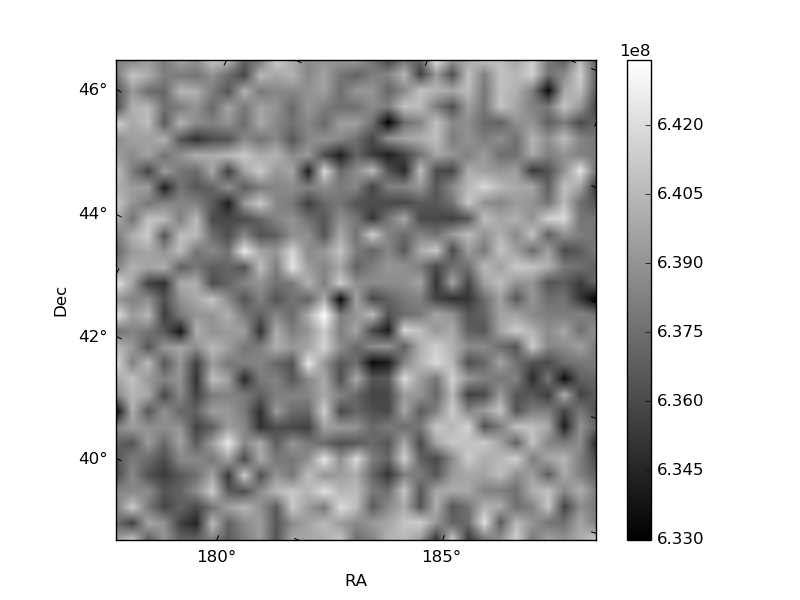
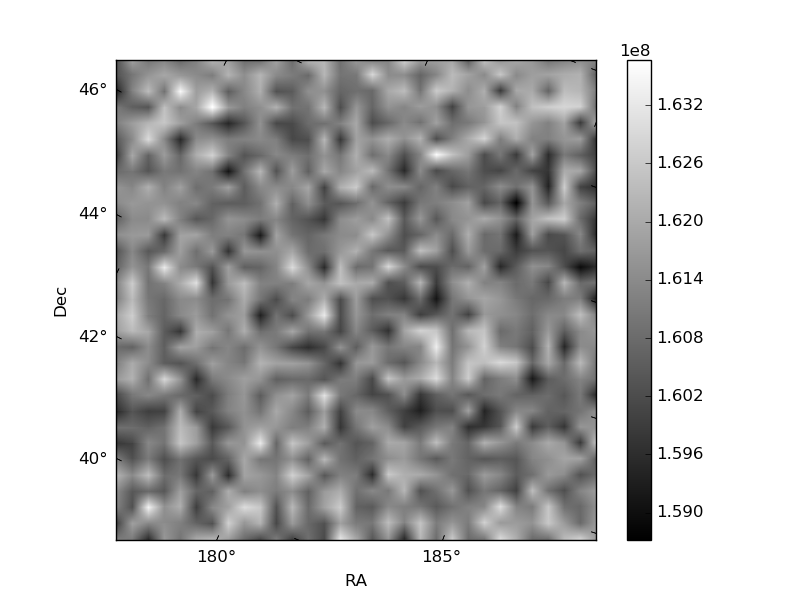
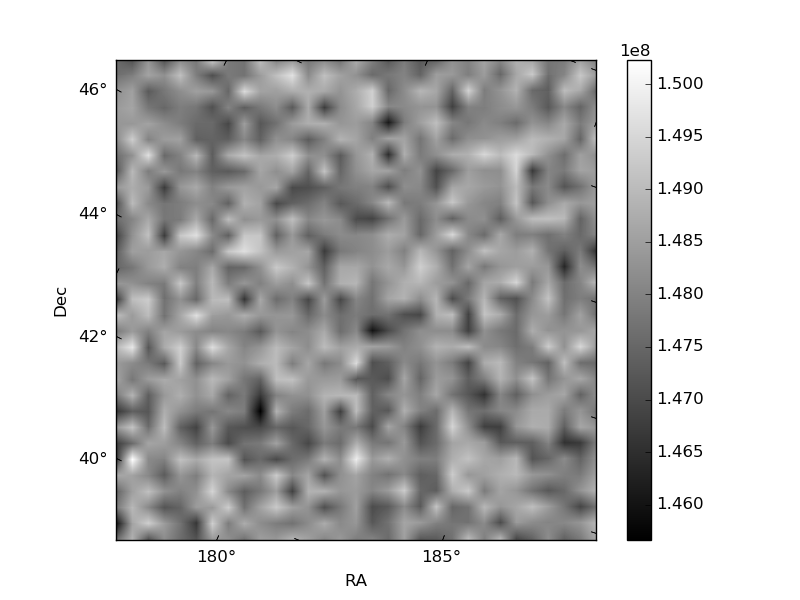
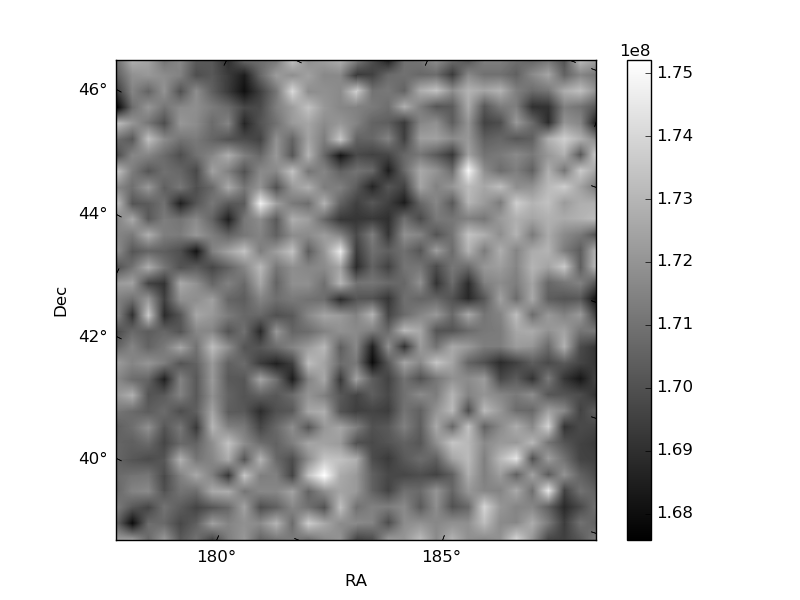
Histogram calculated using DETX and DETY for each event in the final _common_clean file
| Quadrant A | 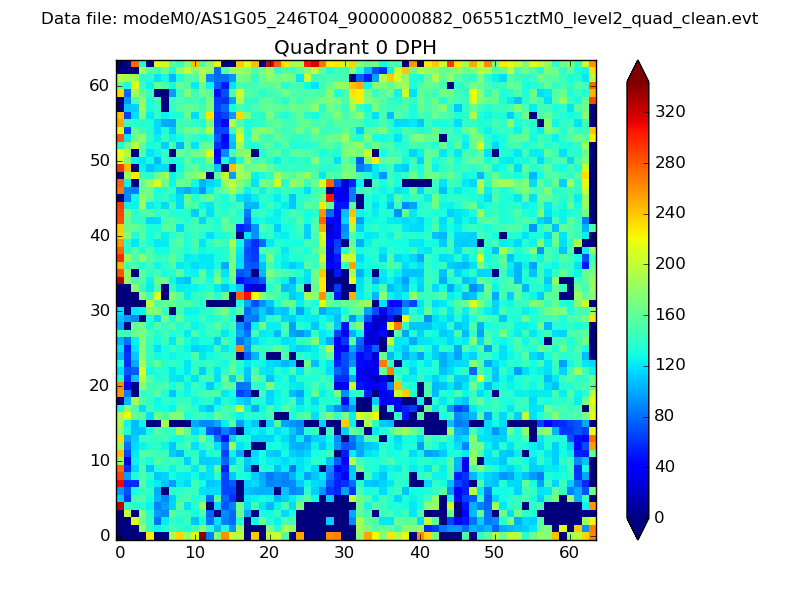 |
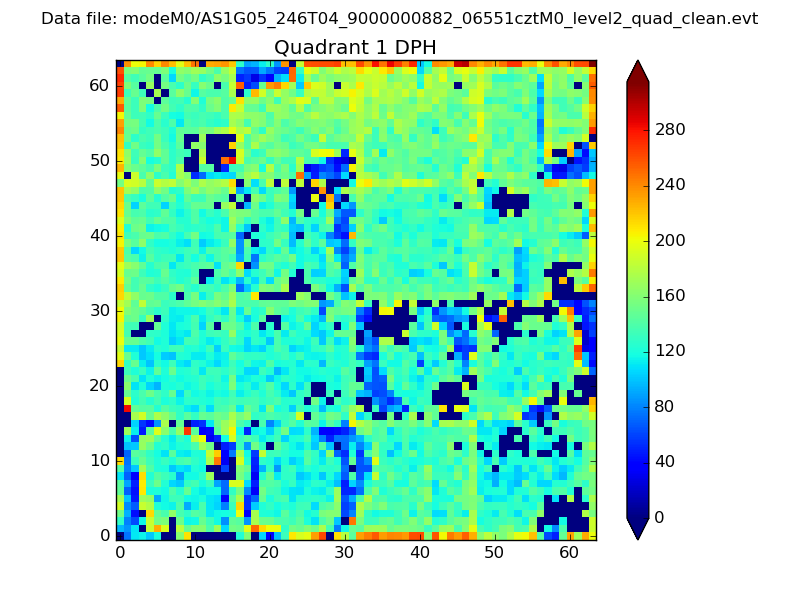 |
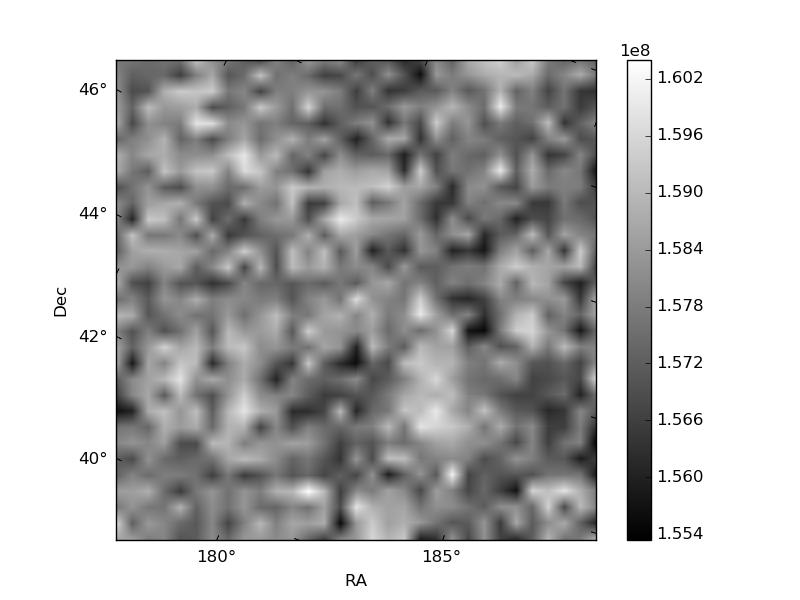
Quadrant B |
|---|---|---|---|
| Quadrant D | 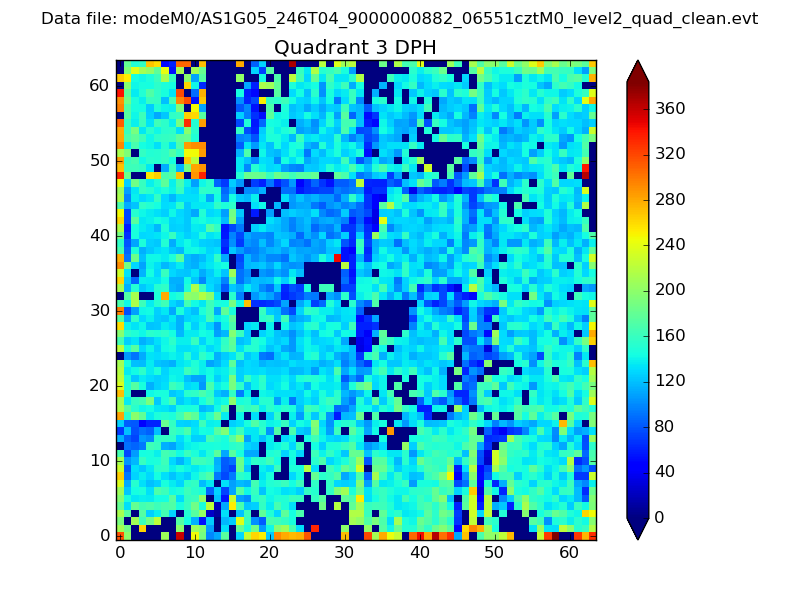 |
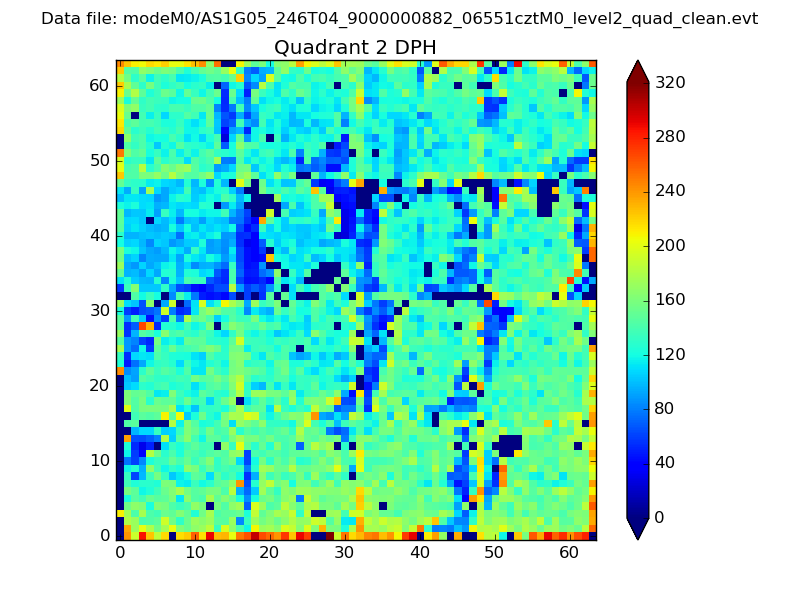 |
Quadrant C |
| Plot type | Count rate plots | Images |
|---|---|---|
| Comparison with Poisson distribution Blue bars denote a histogram of data divided into 1 sec bins. Red curve is a Poisson curve with rate = median count rate of data. |
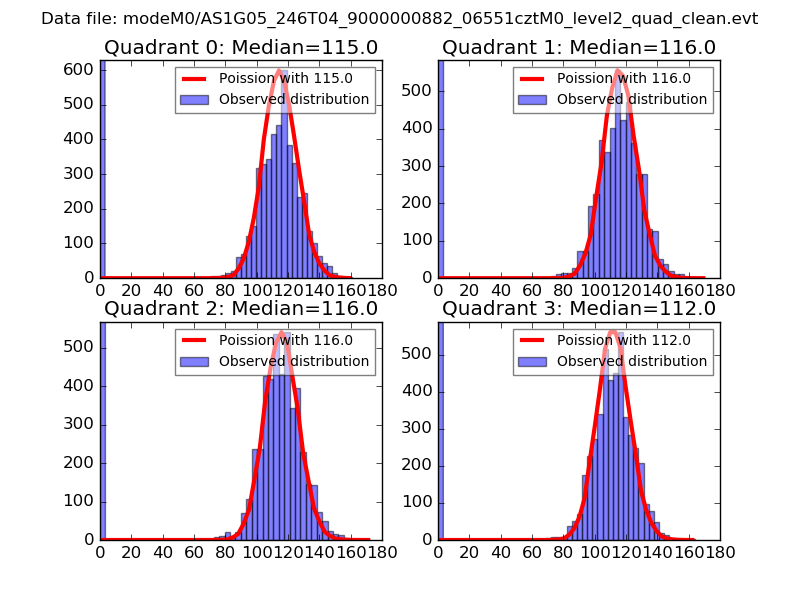 |
 |
| Quadrant-wise count rates Data is divided into 100 sec bins |
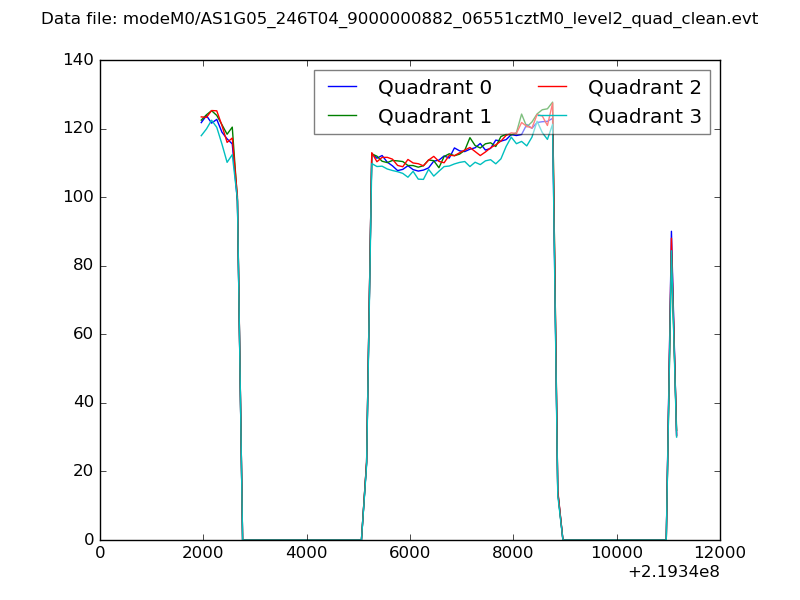 |
|
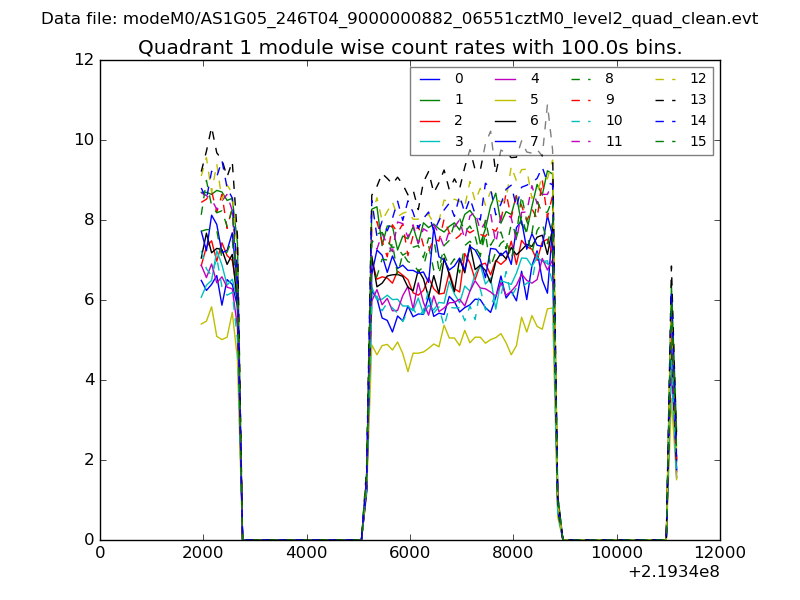
| Module-wise count rates for Quadrant A Data is divided into 100 sec bins |
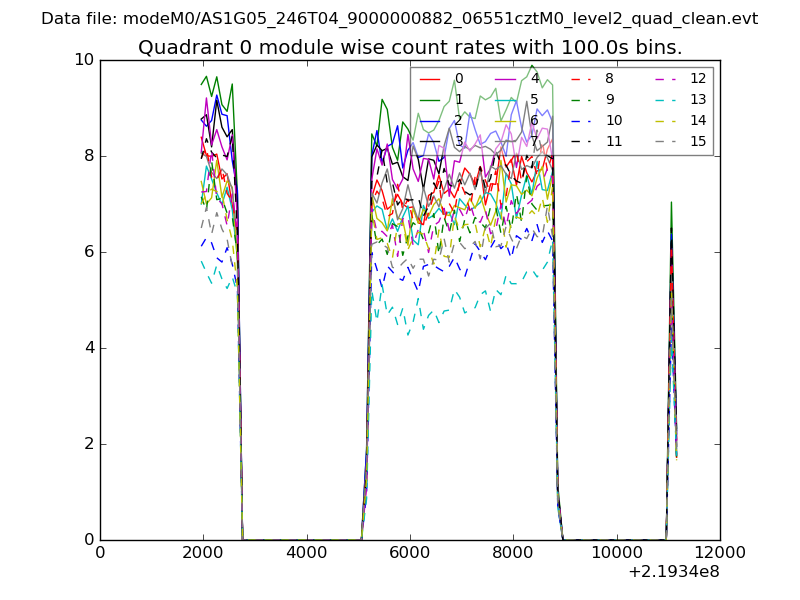 |
 |
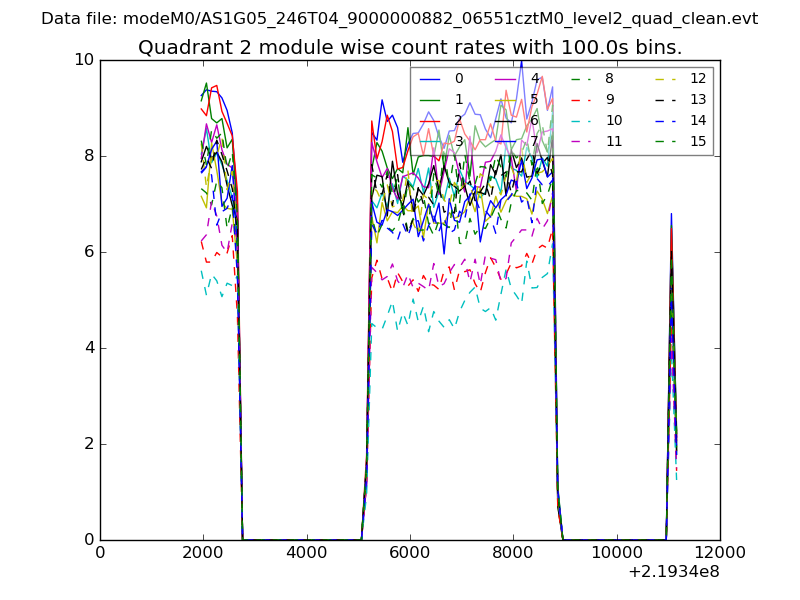
| Module-wise count rates for Quadrant B Data is divided into 100 sec bins |
 |
 |
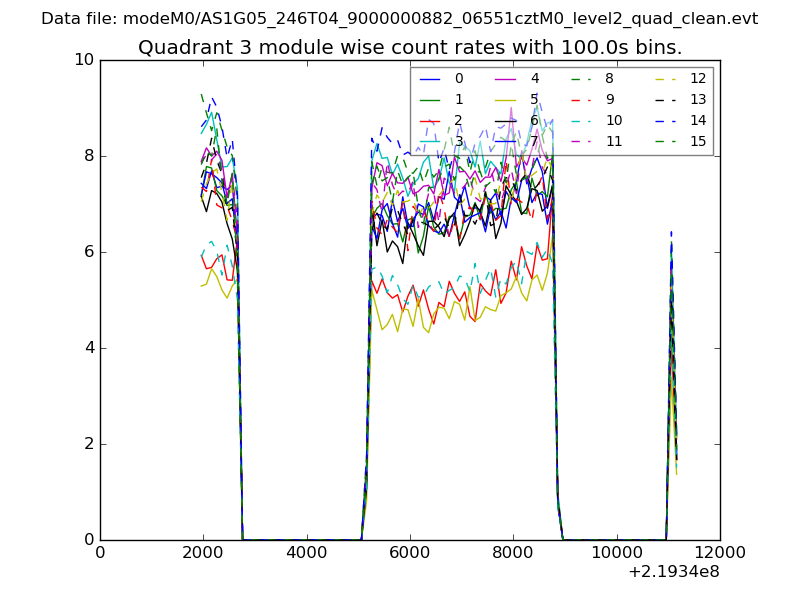
| Module-wise count rates for Quadrant C Data is divided into 100 sec bins |
 |
 |
| Module-wise count rates for Quadrant D Data is divided into 100 sec bins |
 |
 |
| Parameter | Plot |
|---|---|
| CZT HV Monitor |  |
| D_VDD | 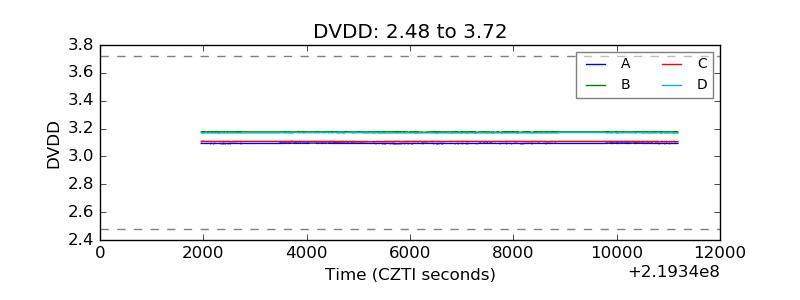 |
| Temperature 1 | 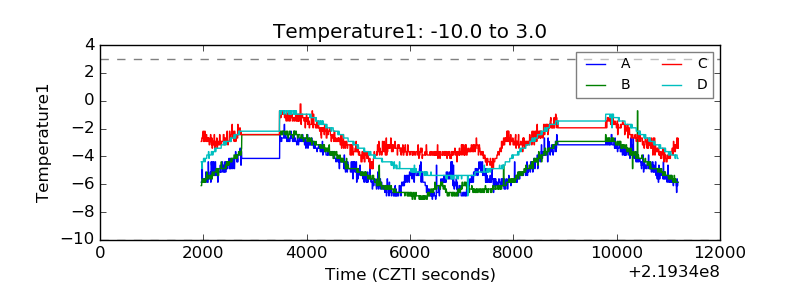 |
| Veto HV Monitor | 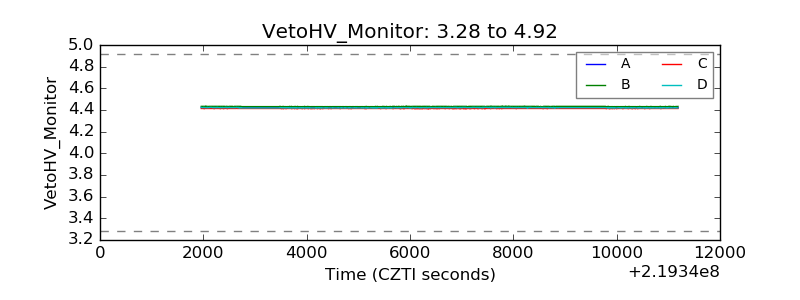 |
| Veto LLD | 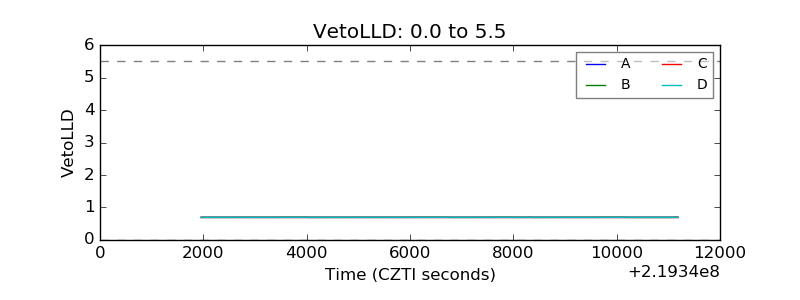 |
| Alpha Counter | 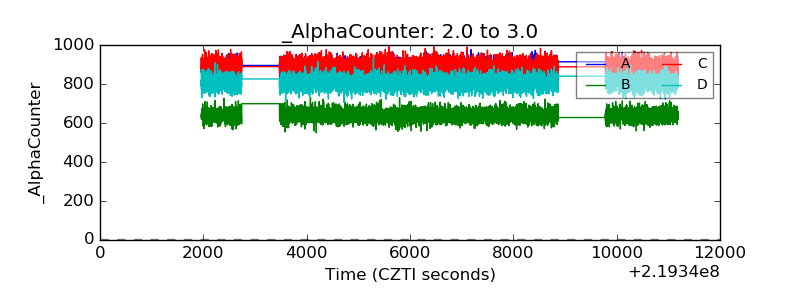 |
| _CPM_Rate | 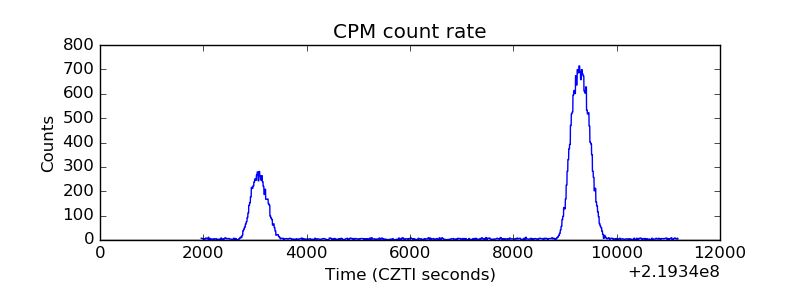 |
| CZT Counter | 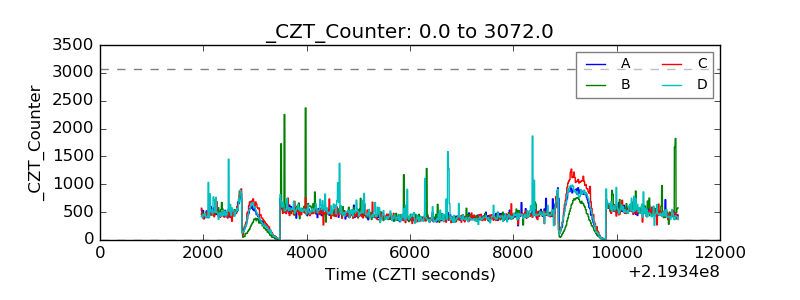 |
| +2.5 Volts monitor |  |
| +5 Volts monitor | 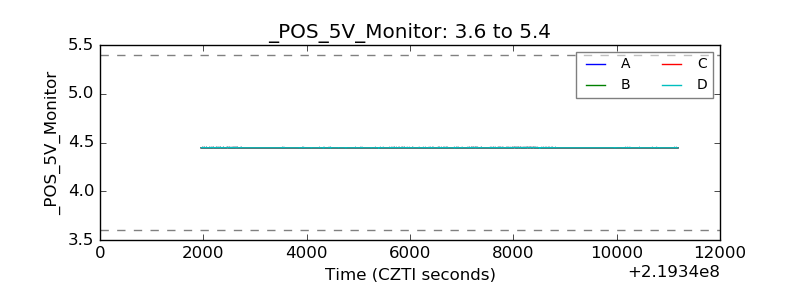 |
| _ROLL_ROT | 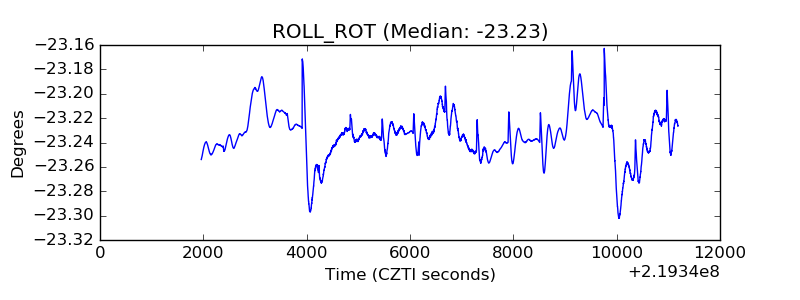 |
| _Roll_DEC | 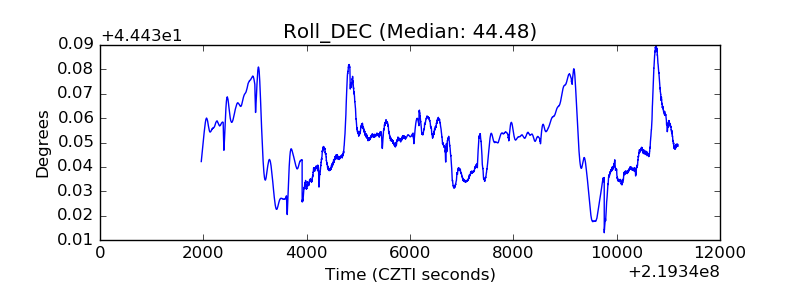 |
| _Roll_RA | 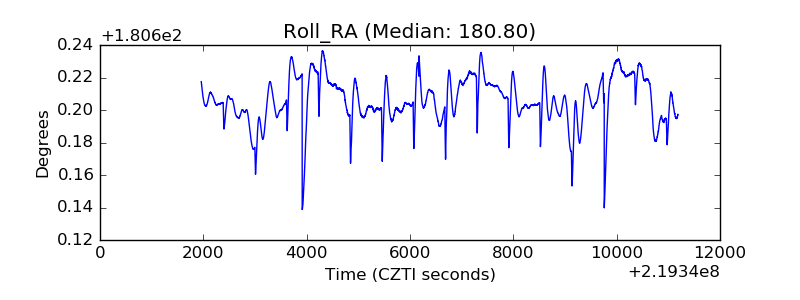 |
| Veto Counter | 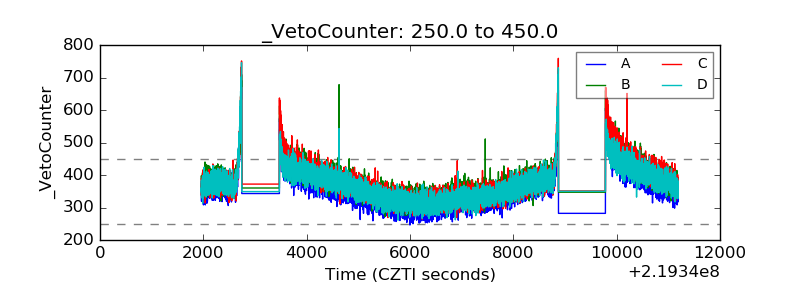 |