| Param | Original file | Final file |
|---|---|---|
| Filename | modeM0/AS1G05_246T04_9000000882_06552cztM0_level2.evt | modeM0/AS1G05_246T04_9000000882_06552cztM0_level2_quad_clean.evt |
| Size (bytes) | 443,819,520 | 80,323,200 |
| Size | 423.3 MB | 76.6 MB |
| Events in quadrant A | 3,036,945 | 493,984 |
| Events in quadrant B | 3,546,844 | 496,763 |
| Events in quadrant C | 3,008,541 | 500,273 |
| Events in quadrant D | 3,398,363 | 479,292 |
| Mode M0 | |||
|---|---|---|---|
| Quadrant | BADHDUFLAG | Total packets | Discarded packets |
| A | 0 | 13608 | 3 |
| B | 0 | 14992 | 2 |
| C | 0 | 13640 | 2 |
| D | 0 | 14810 | 2 |
| Mode SS | |||
|---|---|---|---|
| Quadrant | BADHDUFLAG | Total packets | Discarded packets |
| A | 0 | 136 | 0 |
| B | 0 | 136 | 0 |
| C | 0 | 136 | 0 |
| D | 0 | 136 | 0 |
| Mode M9 | |||
|---|---|---|---|
| Quadrant | BADHDUFLAG | Total packets | Discarded packets |
| A | 0 | 13 | 0 |
| B | 0 | 13 | 0 |
| C | 0 | 13 | 0 |
| D | 0 | 14 | 0 |
| Quadrant | Total seconds | Saturated seconds | Saturation percentage |
|---|---|---|---|
| A | 6620 | 22 | 0.332326% |
| B | 6620 | 131 | 1.978852% |
| C | 6620 | 24 | 0.362538% |
| D | 6620 | 49 | 0.740181% |
Noise dominated data is calculated using 1-second bins in cleaned event files. If a bin has >2000 counts, and if more than 50% of those come from <1% of pixels, then it is considered to be noise-dominated and hence unusable.
| Quadrant | # 1 sec bins | Bins with >0 counts | Bins with >2000 counts | High rate bins dominated by noise | Noise dominated (total time) | Noise dominated (detector-on time) | Marked lightcurve |
|---|---|---|---|---|---|---|---|
| A | 7695 | 6621 | 0 | 0 | 0.00% | 0.00% | 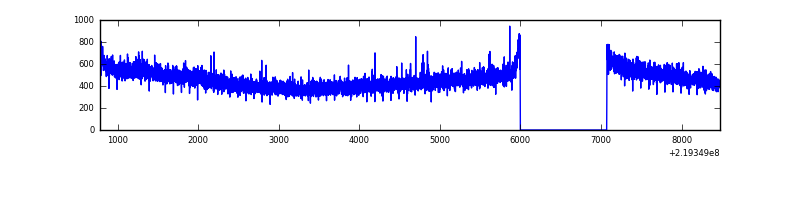 |
| B | 7695 | 6620 | 67 | 67 | 0.87% | 1.01% | 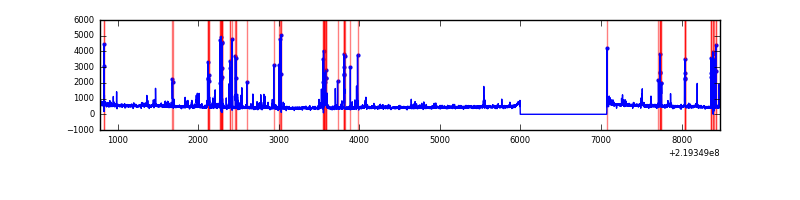 |
| C | 7695 | 6621 | 0 | 0 | 0.00% | 0.00% | 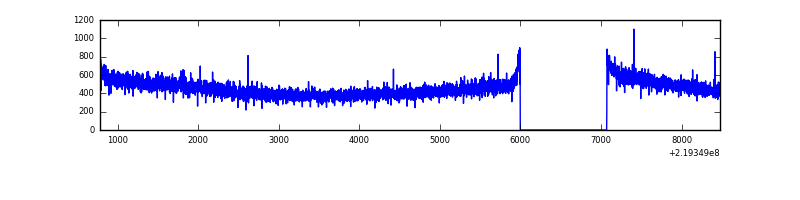 |
| D | 7695 | 6621 | 18 | 18 | 0.23% | 0.27% | 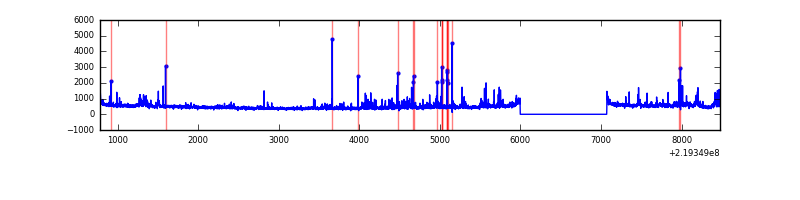 |
Top three noisy pixels from each quadrant. If the there are fewer than three noisy pixels in the level2.evt file, extra rows are filled as -1
| Pixel properties | Quadrant properties | ||||||
|---|---|---|---|---|---|---|---|
| Quadrant | DetID | PixID | Counts | Sigma | Mean | Median | Sigma |
| A | 8 | 15 | 45870 | 285.99 | 774 | 756 | 157.7 |
| A | 0 | 226 | 7459 | 42.49 | 774 | 756 | 157.7 |
| A | 12 | 194 | 7161 | 40.6 | 774 | 756 | 157.7 |
| B | 4 | 48 | 206284 | 1378.93 | 777 | 757 | 149.0 |
| B | 4 | 81 | 116852 | 778.91 | 777 | 757 | 149.0 |
| B | 0 | 219 | 108852 | 725.23 | 777 | 757 | 149.0 |
| C | 1 | 16 | 17924 | 97.07 | 762 | 765 | 176.8 |
| C | 9 | 54 | 11253 | 59.33 | 762 | 765 | 176.8 |
| C | 13 | 61 | 5989 | 29.55 | 762 | 765 | 176.8 |
| D | 14 | 34 | 203425 | 1083.55 | 759 | 736 | 187.1 |
| D | 11 | 241 | 107121 | 568.72 | 759 | 736 | 187.1 |
| D | 2 | 152 | 60118 | 317.45 | 759 | 736 | 187.1 |
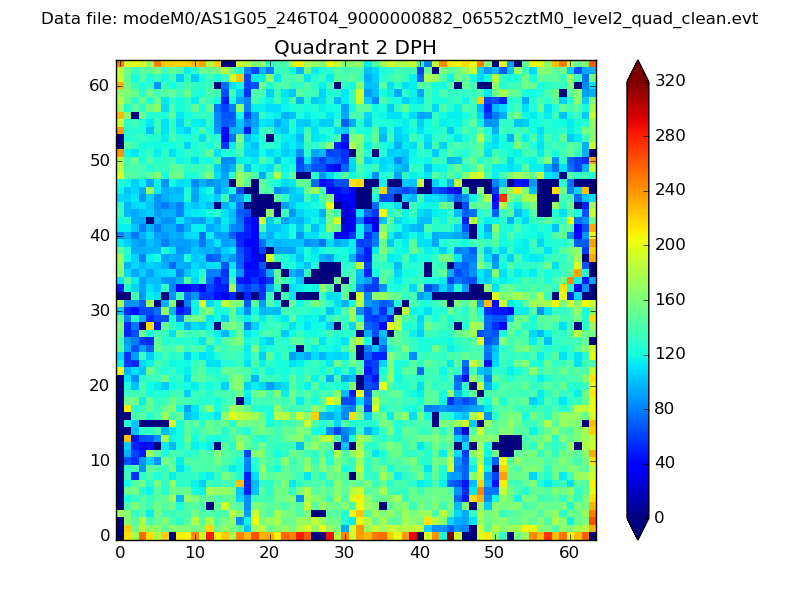
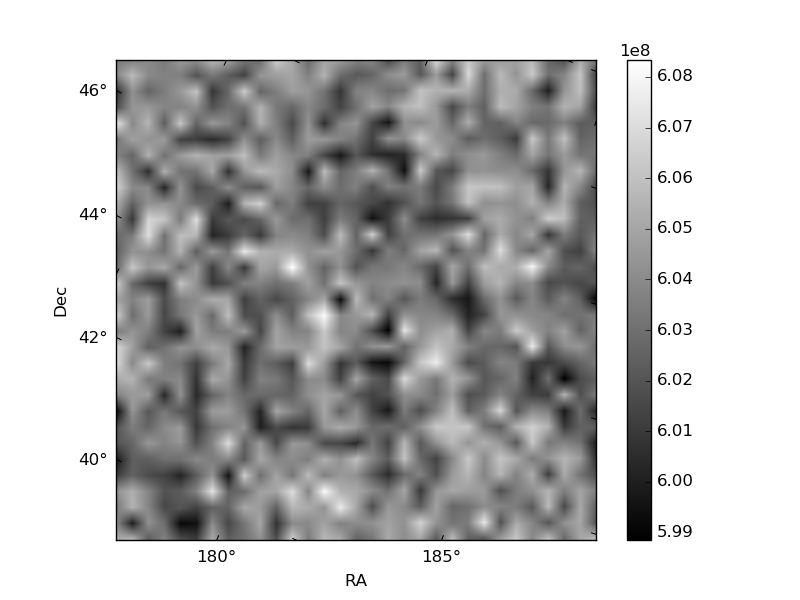
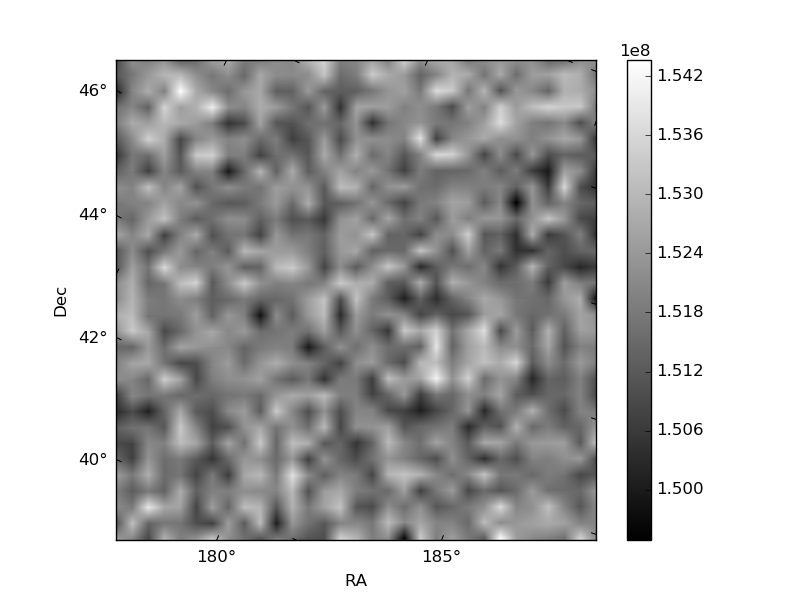
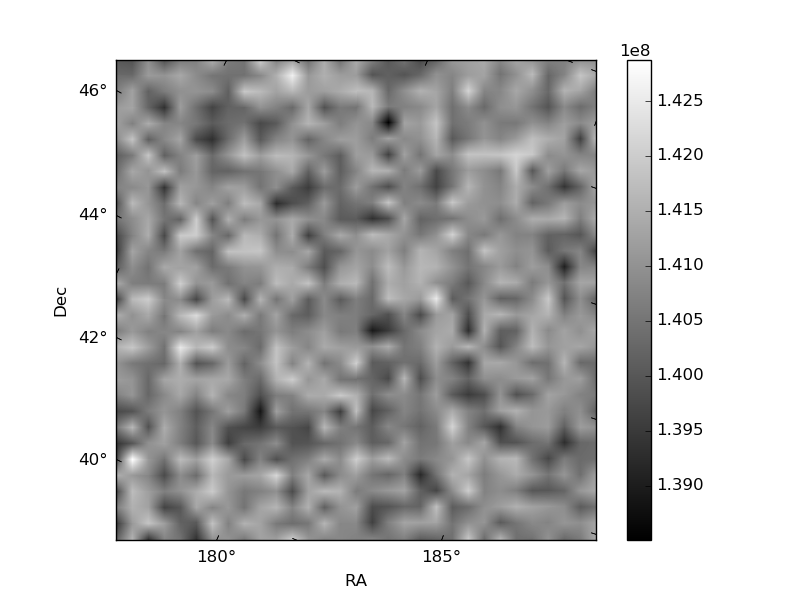
Histogram calculated using DETX and DETY for each event in the final _common_clean file
| Quadrant A | 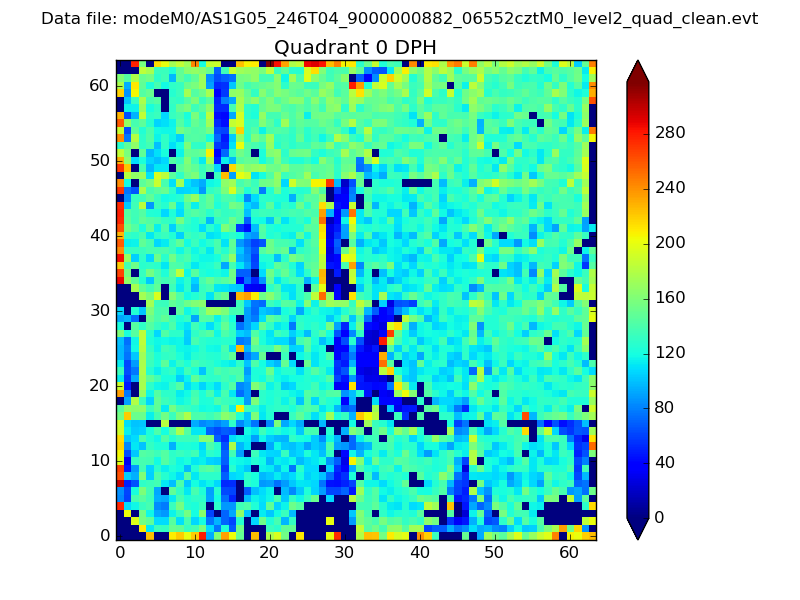 |
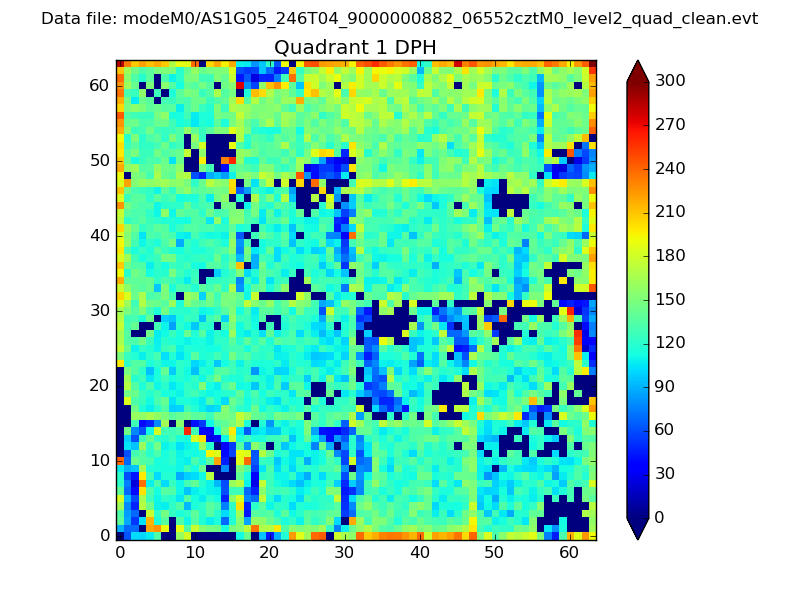 |
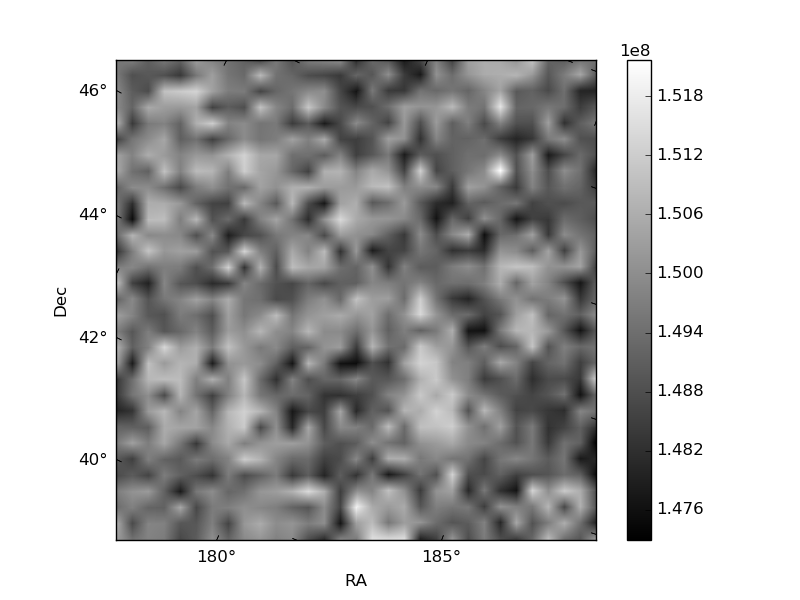
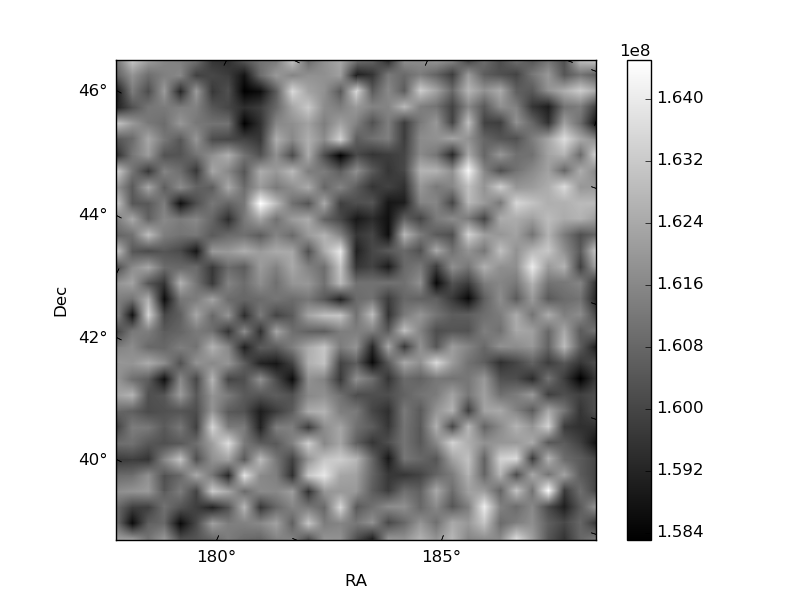
Quadrant B |
|---|---|---|---|
| Quadrant D | 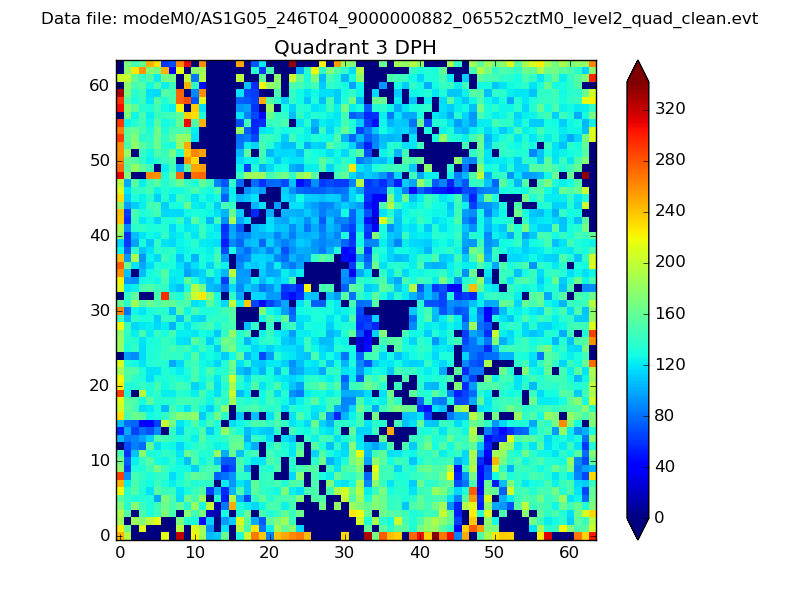 |
 |
Quadrant C |
| Plot type | Count rate plots | Images |
|---|---|---|
| Comparison with Poisson distribution Blue bars denote a histogram of data divided into 1 sec bins. Red curve is a Poisson curve with rate = median count rate of data. |
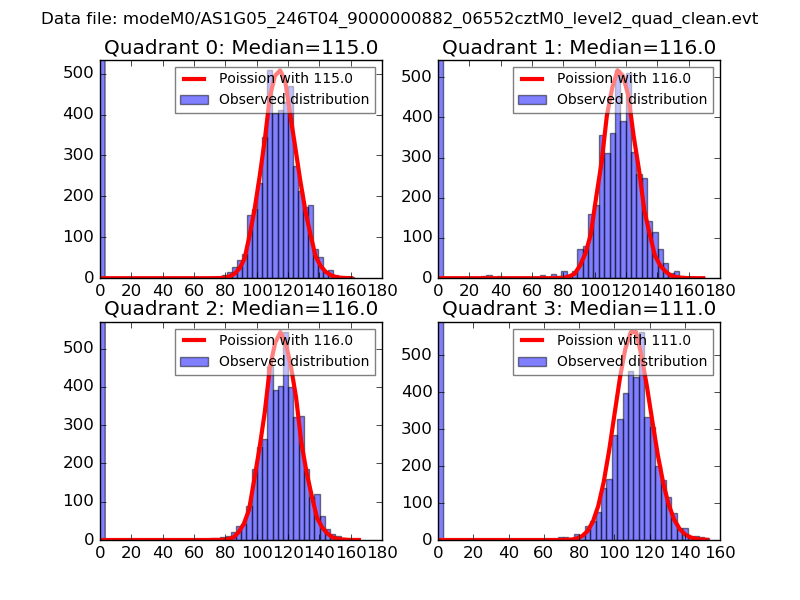 |
 |
| Quadrant-wise count rates Data is divided into 100 sec bins |
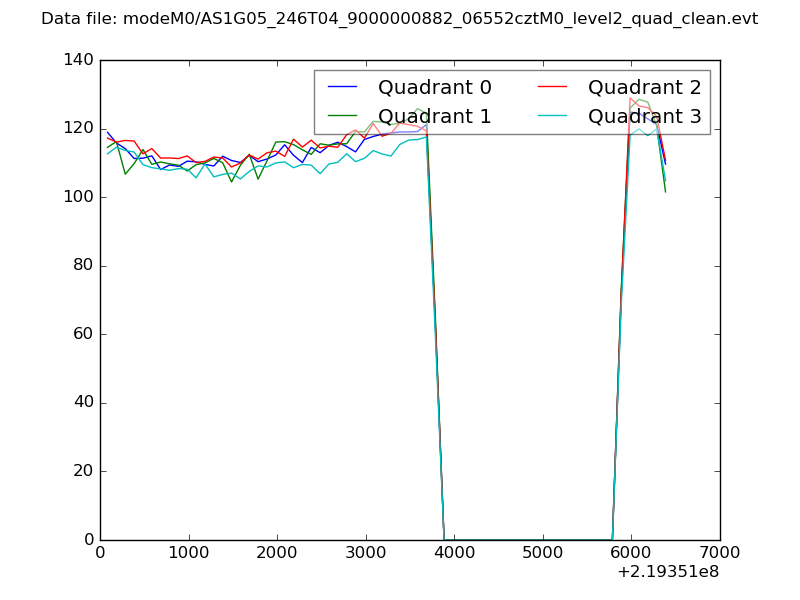 |
|
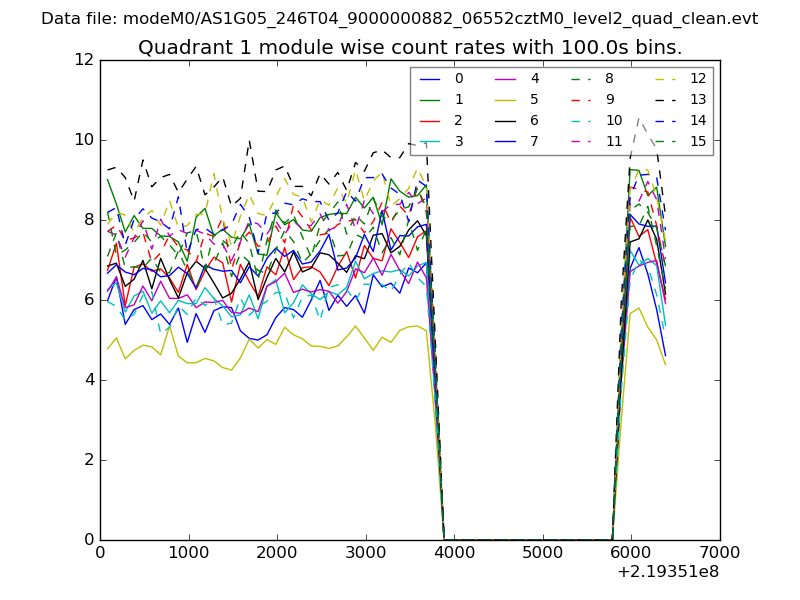
| Module-wise count rates for Quadrant A Data is divided into 100 sec bins |
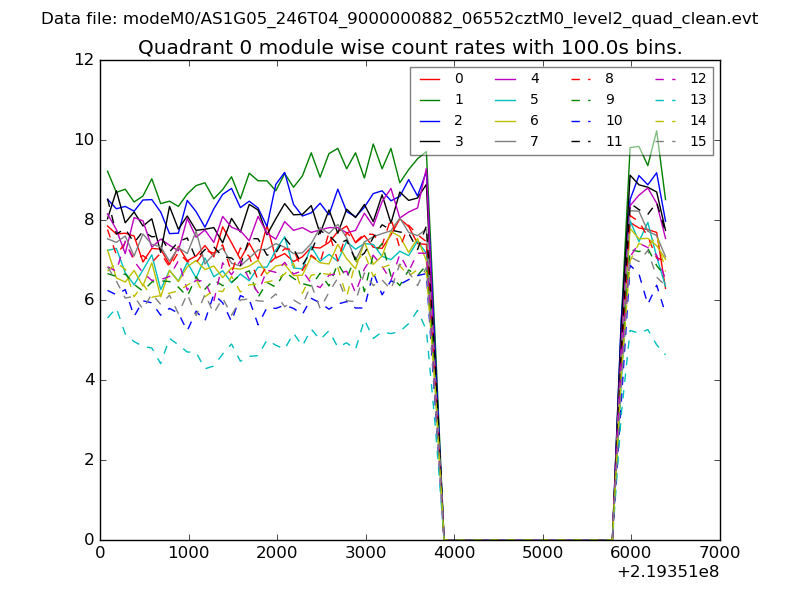 |
 |
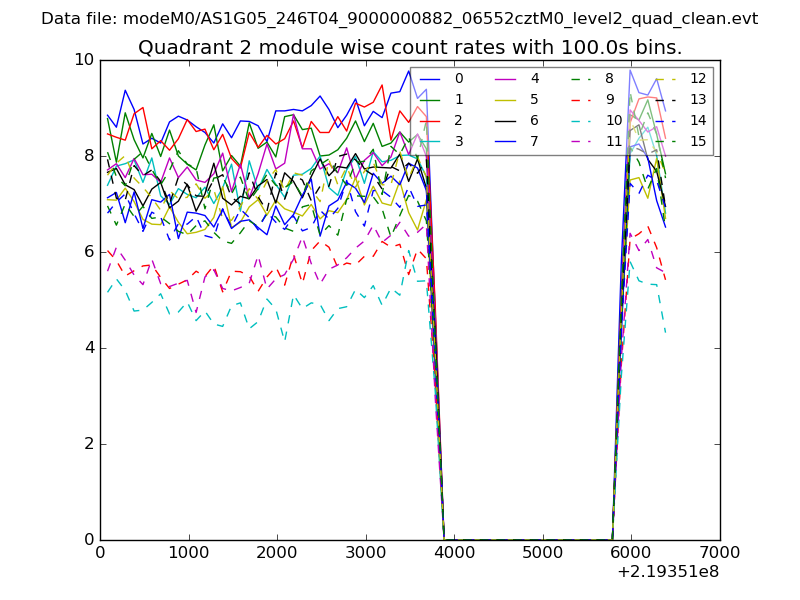
| Module-wise count rates for Quadrant B Data is divided into 100 sec bins |
 |
 |
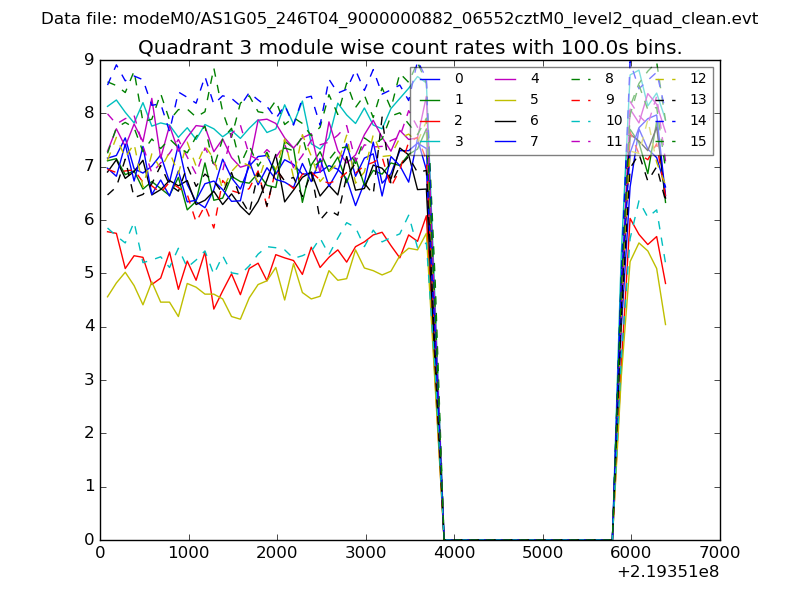
| Module-wise count rates for Quadrant C Data is divided into 100 sec bins |
 |
 |
| Module-wise count rates for Quadrant D Data is divided into 100 sec bins |
 |
 |
| Parameter | Plot |
|---|---|
| CZT HV Monitor | 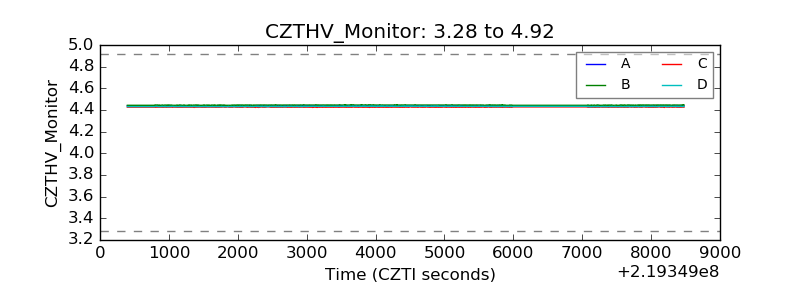 |
| D_VDD | 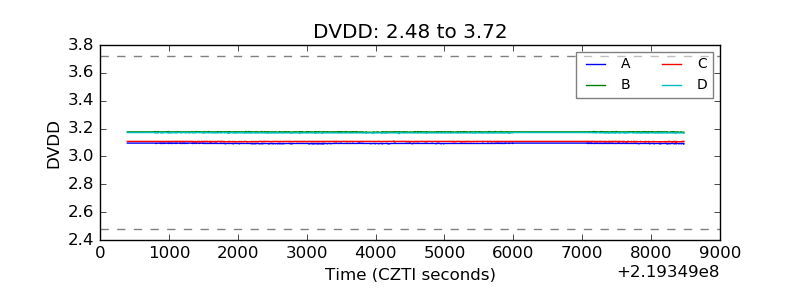 |
| Temperature 1 | 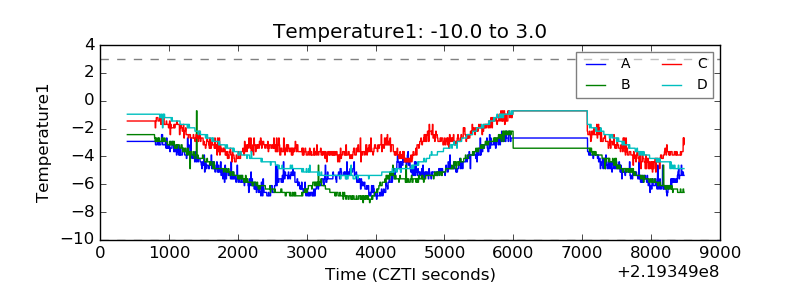 |
| Veto HV Monitor | 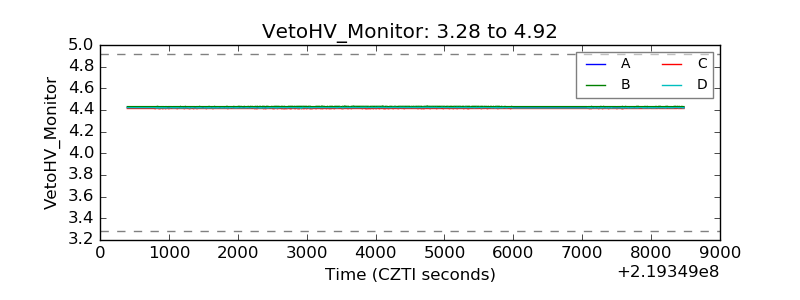 |
| Veto LLD | 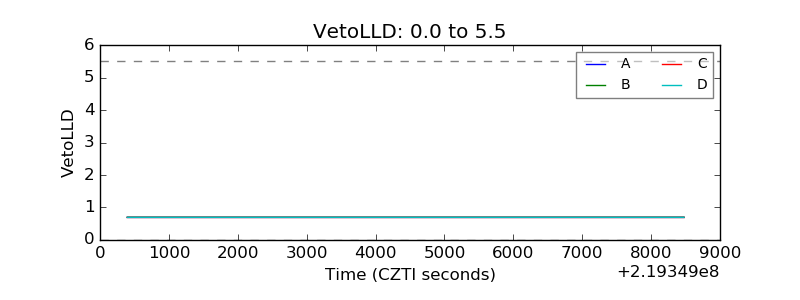 |
| Alpha Counter | 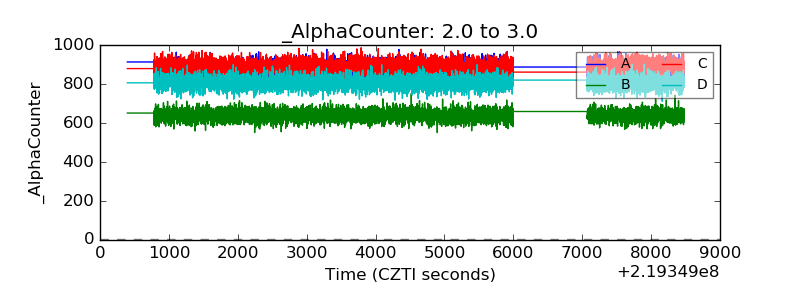 |
| _CPM_Rate | 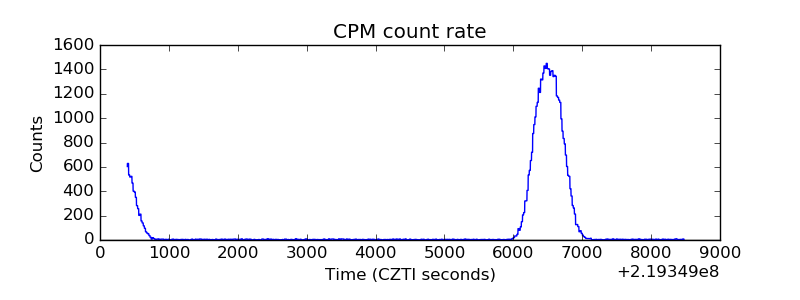 |
| CZT Counter | 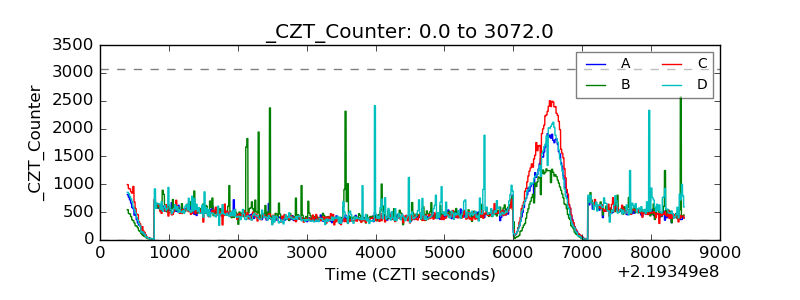 |
| +2.5 Volts monitor |  |
| +5 Volts monitor | 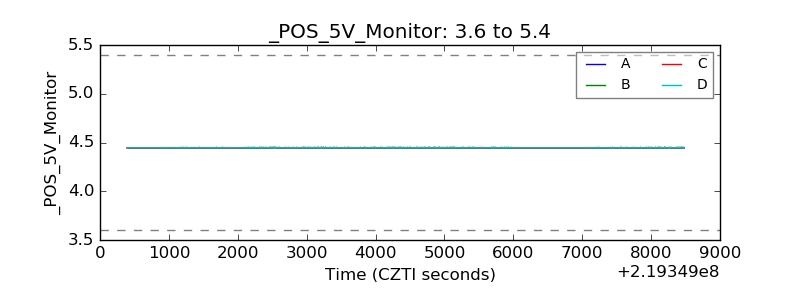 |
| _ROLL_ROT | 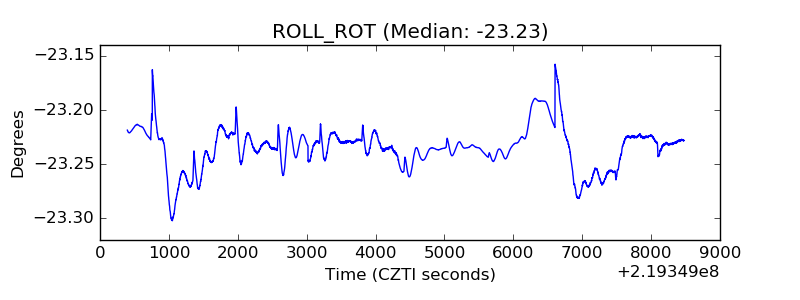 |
| _Roll_DEC | 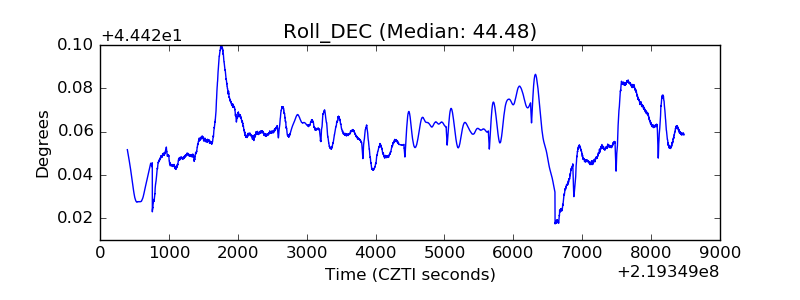 |
| _Roll_RA | 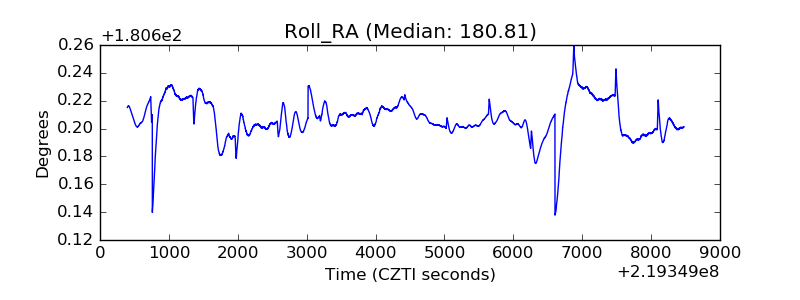 |
| Veto Counter | 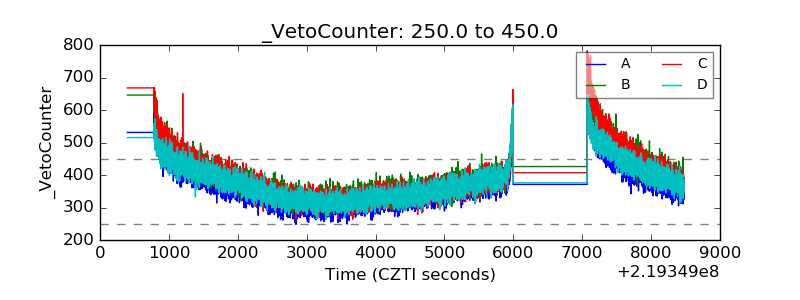 |