| Param | Original file | Final file |
|---|---|---|
| Filename | modeM0/AS1G05_246T04_9000000882_06554cztM0_level2.evt | modeM0/AS1G05_246T04_9000000882_06554cztM0_level2_quad_clean.evt |
| Size (bytes) | 476,680,320 | 86,944,320 |
| Size | 454.6 MB | 82.9 MB |
| Events in quadrant A | 3,005,132 | 548,465 |
| Events in quadrant B | 3,327,195 | 558,875 |
| Events in quadrant C | 2,925,862 | 558,627 |
| Events in quadrant D | 4,745,381 | 522,394 |
| Mode M0 | |||
|---|---|---|---|
| Quadrant | BADHDUFLAG | Total packets | Discarded packets |
| A | 0 | 13372 | 3 |
| B | 0 | 14319 | 2 |
| C | 0 | 13240 | 2 |
| D | 0 | 18566 | 2 |
| Mode SS | |||
|---|---|---|---|
| Quadrant | BADHDUFLAG | Total packets | Discarded packets |
| A | 0 | 130 | 0 |
| B | 0 | 130 | 0 |
| C | 0 | 130 | 0 |
| D | 0 | 130 | 0 |
| Mode M9 | |||
|---|---|---|---|
| Quadrant | BADHDUFLAG | Total packets | Discarded packets |
| A | 0 | 12 | 0 |
| B | 0 | 12 | 0 |
| C | 0 | 12 | 0 |
| D | 0 | 12 | 0 |
| Quadrant | Total seconds | Saturated seconds | Saturation percentage |
|---|---|---|---|
| A | 6370 | 33 | 0.518053% |
| B | 6370 | 101 | 1.585557% |
| C | 6370 | 22 | 0.345369% |
| D | 6371 | 247 | 3.876942% |
Noise dominated data is calculated using 1-second bins in cleaned event files. If a bin has >2000 counts, and if more than 50% of those come from <1% of pixels, then it is considered to be noise-dominated and hence unusable.
| Quadrant | # 1 sec bins | Bins with >0 counts | Bins with >2000 counts | High rate bins dominated by noise | Noise dominated (total time) | Noise dominated (detector-on time) | Marked lightcurve |
|---|---|---|---|---|---|---|---|
| A | 7550 | 6371 | 10 | 10 | 0.13% | 0.16% | 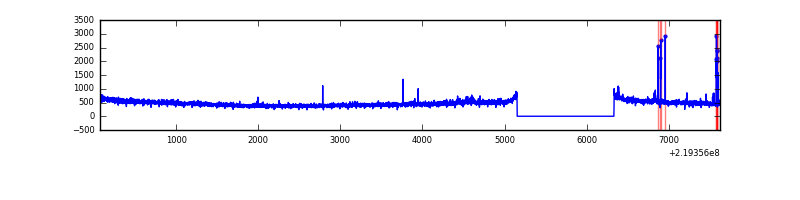 |
| B | 7550 | 6370 | 47 | 47 | 0.62% | 0.74% | 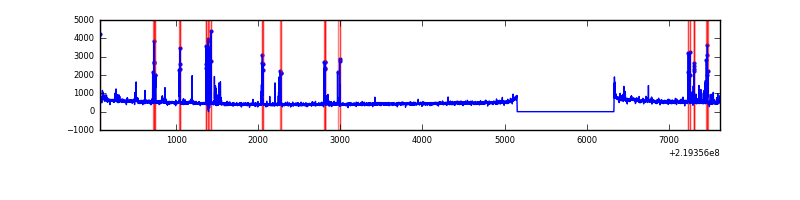 |
| C | 7550 | 6371 | 0 | 0 | 0.00% | 0.00% | 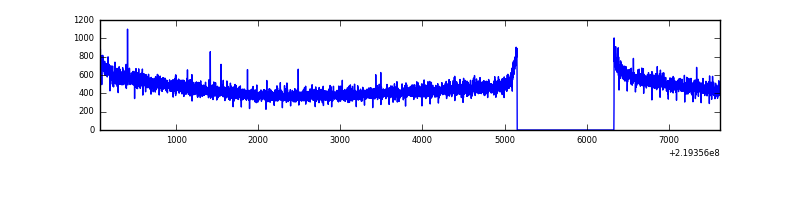 |
| D | 7551 | 6372 | 178 | 178 | 2.36% | 2.79% | 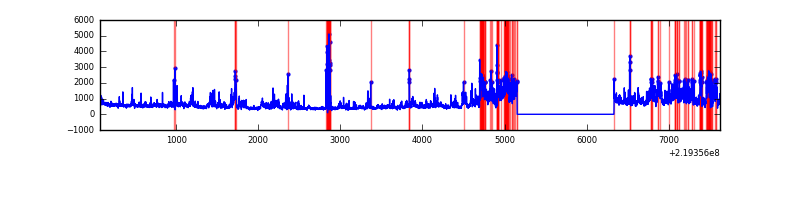 |
Top three noisy pixels from each quadrant. If the there are fewer than three noisy pixels in the level2.evt file, extra rows are filled as -1
| Pixel properties | Quadrant properties | ||||||
|---|---|---|---|---|---|---|---|
| Quadrant | DetID | PixID | Counts | Sigma | Mean | Median | Sigma |
| A | 13 | 251 | 60150 | 385.97 | 754 | 738 | 153.9 |
| A | 8 | 15 | 35520 | 225.96 | 754 | 738 | 153.9 |
| A | 0 | 226 | 7155 | 41.69 | 754 | 738 | 153.9 |
| B | 0 | 219 | 183239 | 1243.31 | 764 | 745 | 146.8 |
| B | 4 | 81 | 56371 | 378.97 | 764 | 745 | 146.8 |
| B | 0 | 214 | 32080 | 213.48 | 764 | 745 | 146.8 |
| C | 1 | 16 | 18465 | 102.97 | 743 | 747 | 172.1 |
| C | 9 | 54 | 6116 | 31.2 | 743 | 747 | 172.1 |
| C | 13 | 61 | 5775 | 29.22 | 743 | 747 | 172.1 |
| D | 11 | 241 | 1630081 | 9127.11 | 728 | 706 | 178.5 |
| D | 2 | 14 | 119595 | 665.97 | 728 | 706 | 178.5 |
| D | 2 | 33 | 60810 | 336.68 | 728 | 706 | 178.5 |
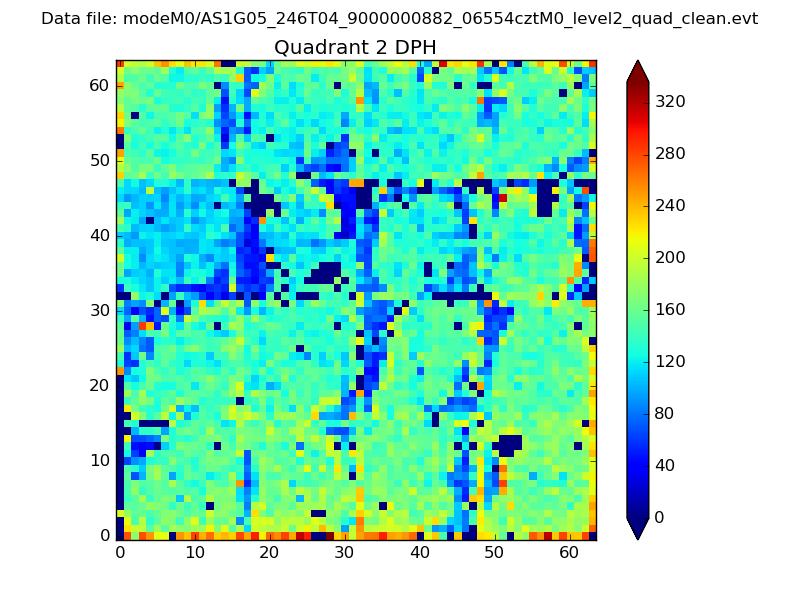
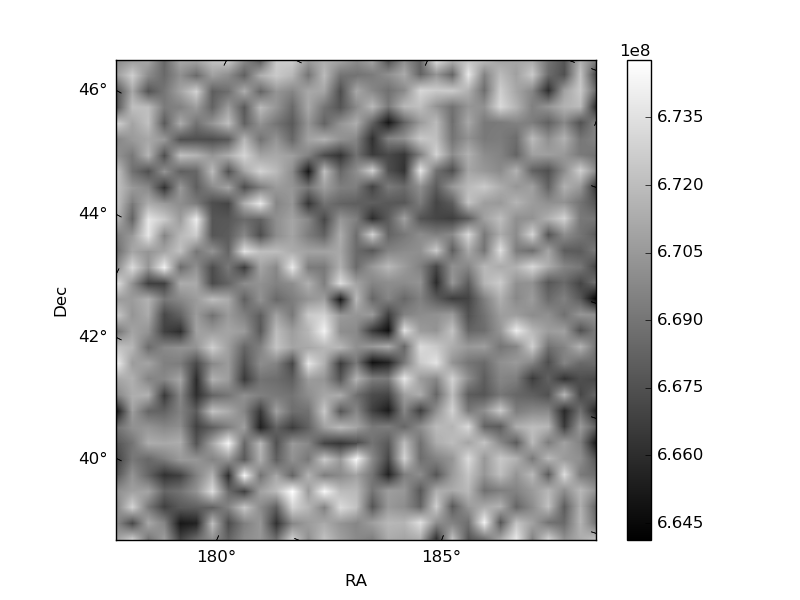
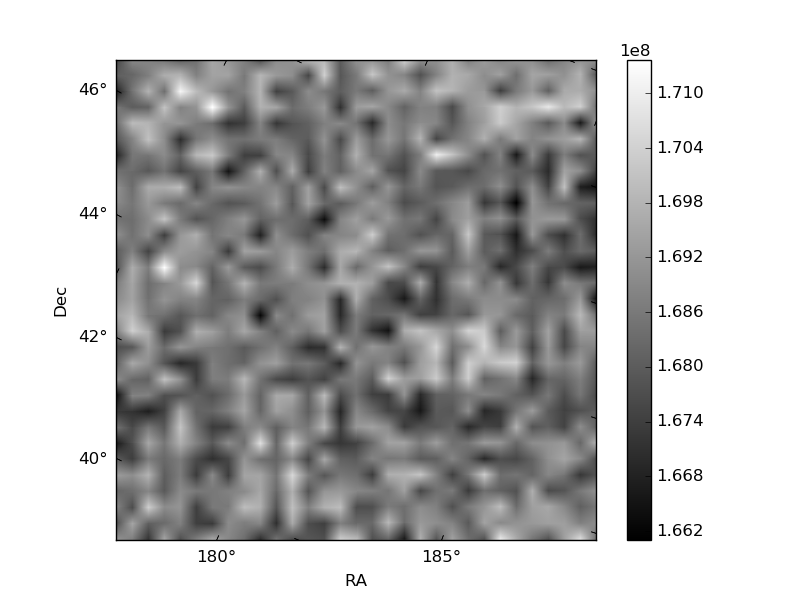
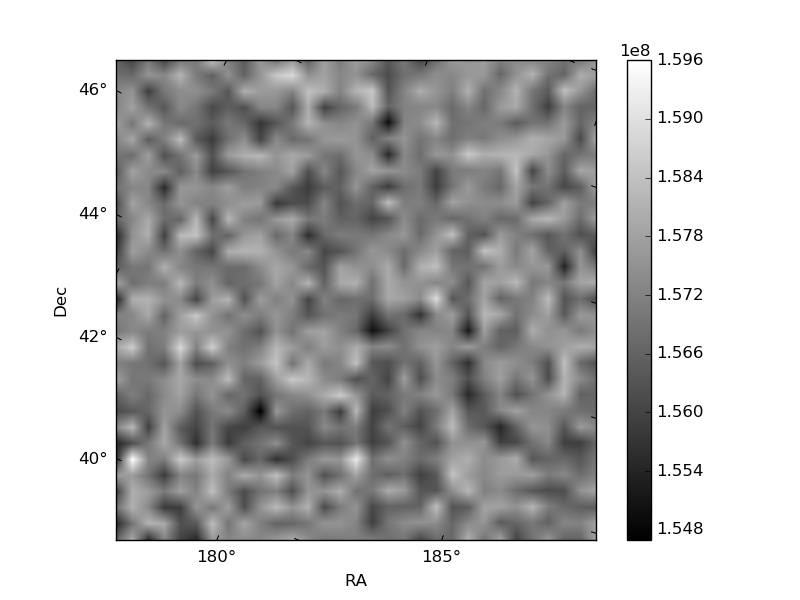
Histogram calculated using DETX and DETY for each event in the final _common_clean file
| Quadrant A | 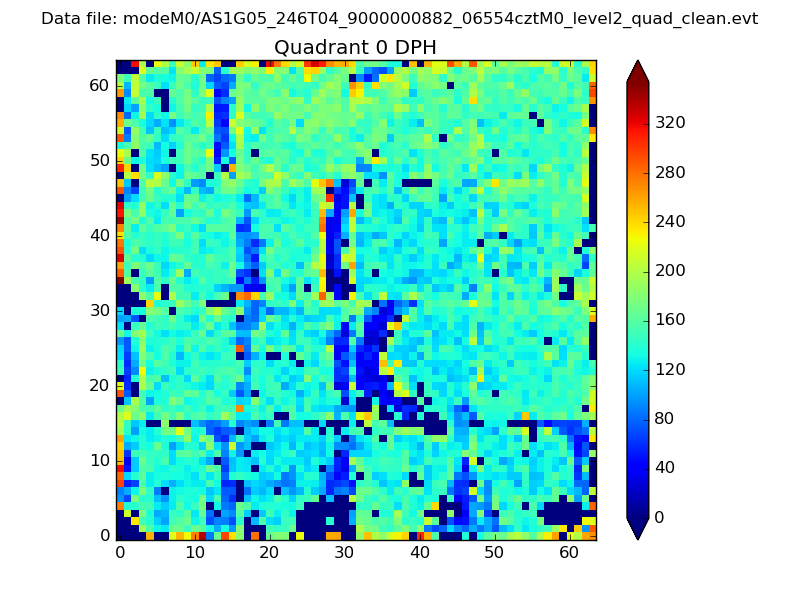 |
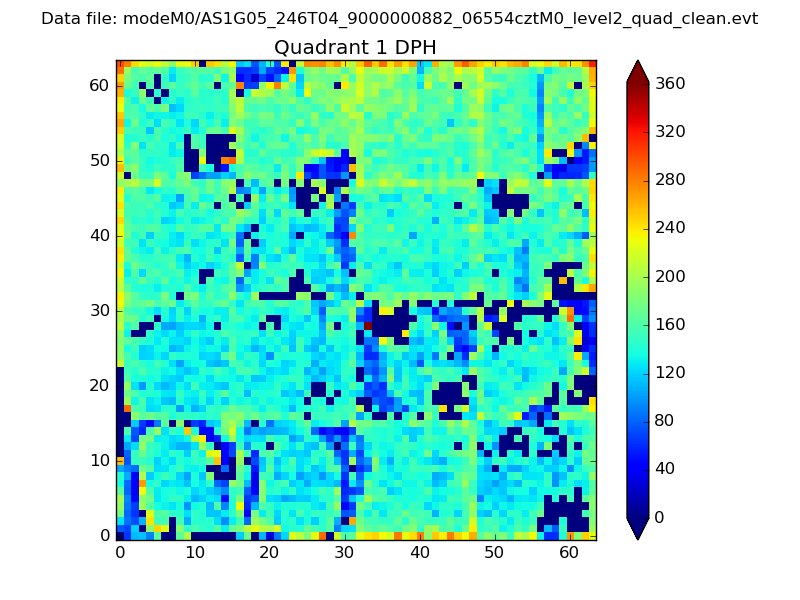 |
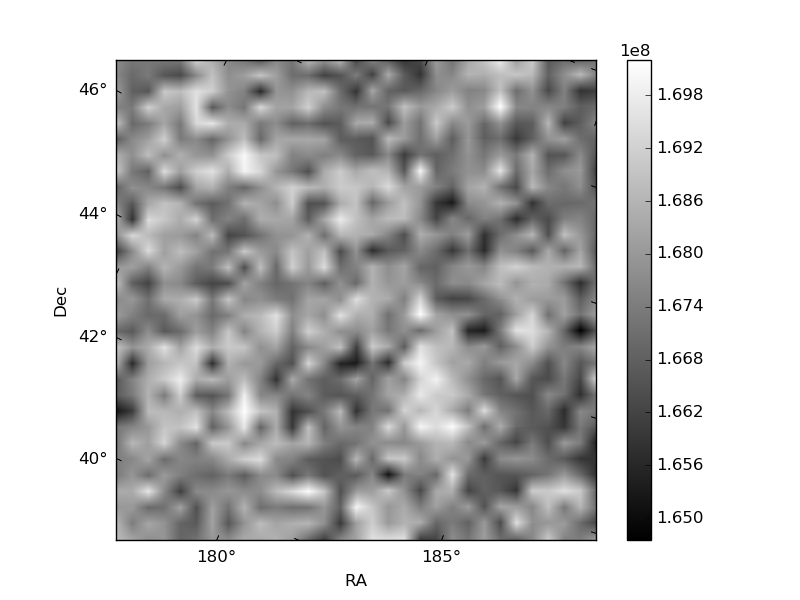
Quadrant B |
|---|---|---|---|
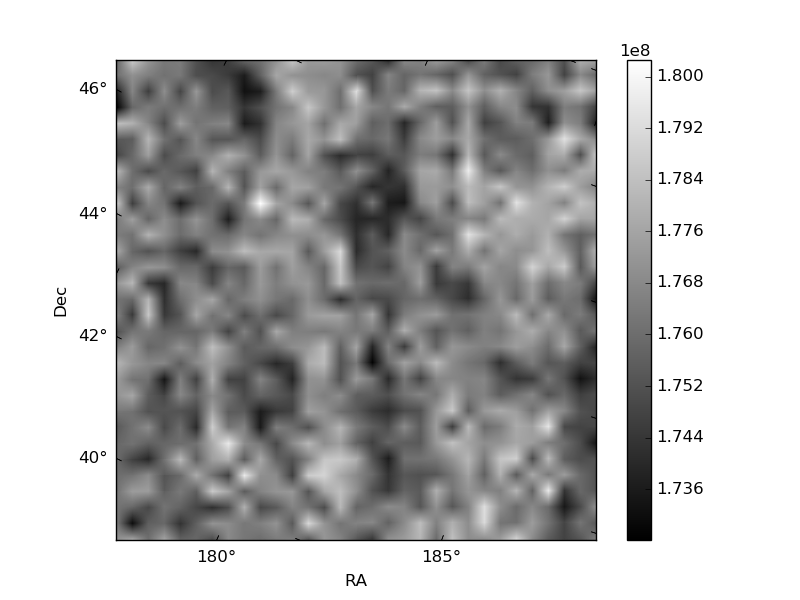
| Quadrant D | 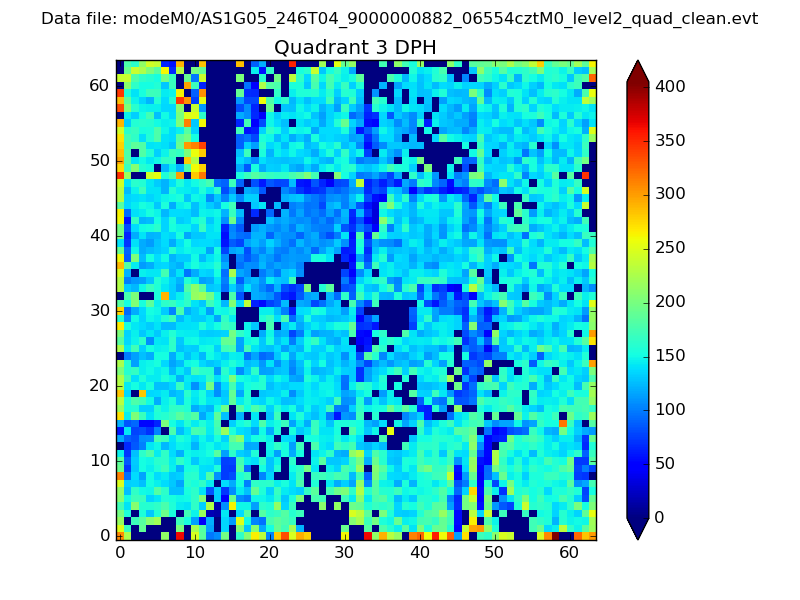 |
 |
Quadrant C |
| Plot type | Count rate plots | Images |
|---|---|---|
| Comparison with Poisson distribution Blue bars denote a histogram of data divided into 1 sec bins. Red curve is a Poisson curve with rate = median count rate of data. |
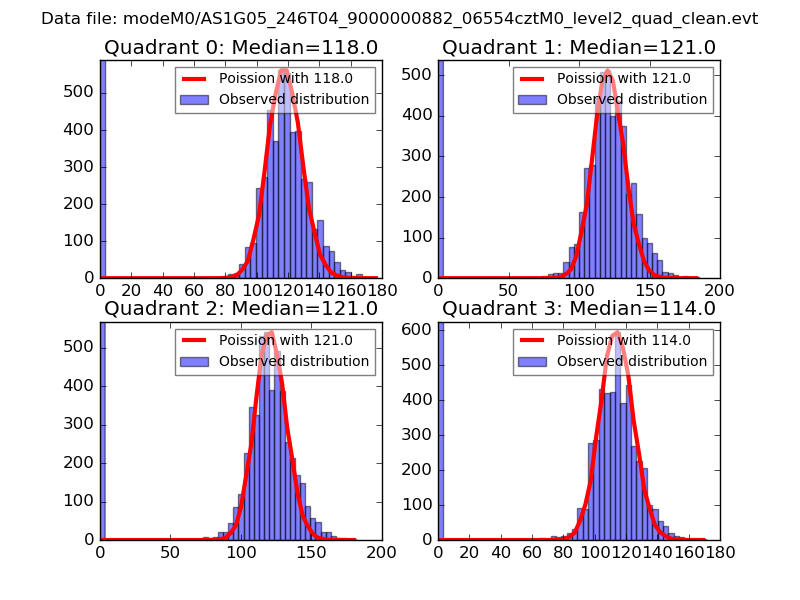 |
 |
| Quadrant-wise count rates Data is divided into 100 sec bins |
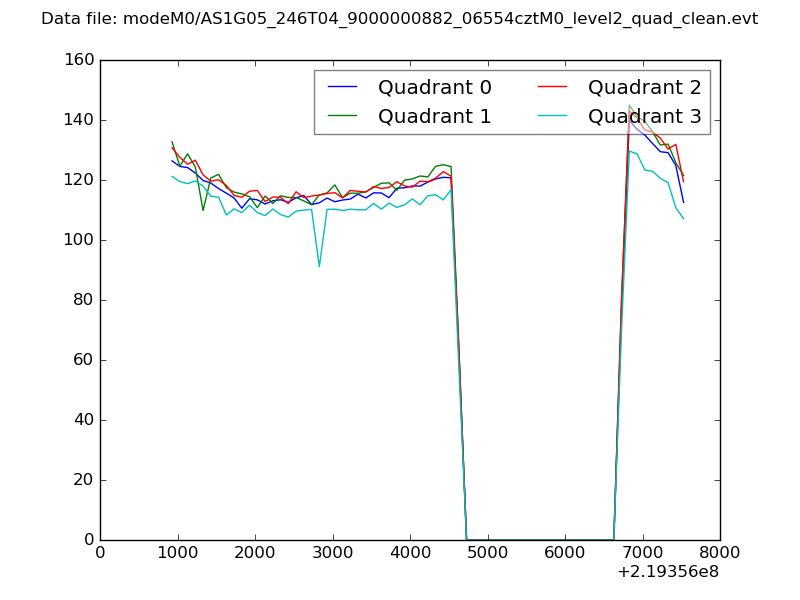 |
|
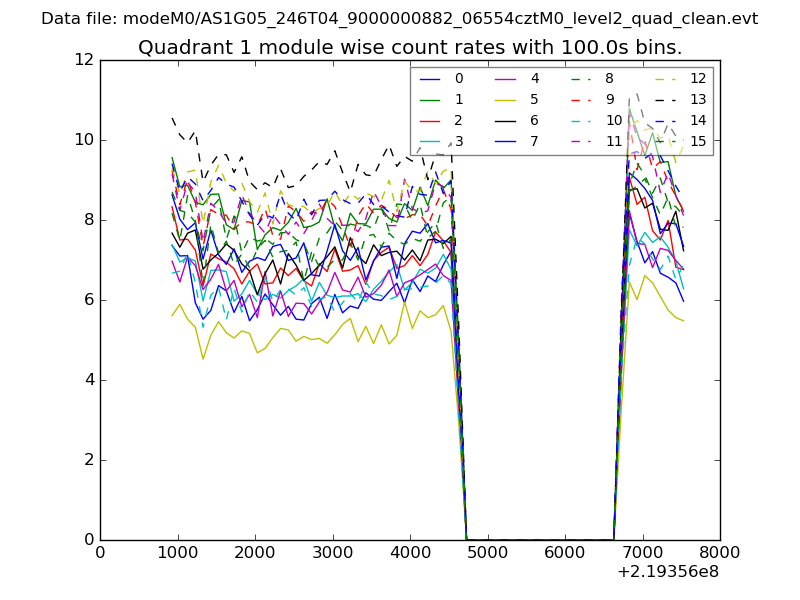
| Module-wise count rates for Quadrant A Data is divided into 100 sec bins |
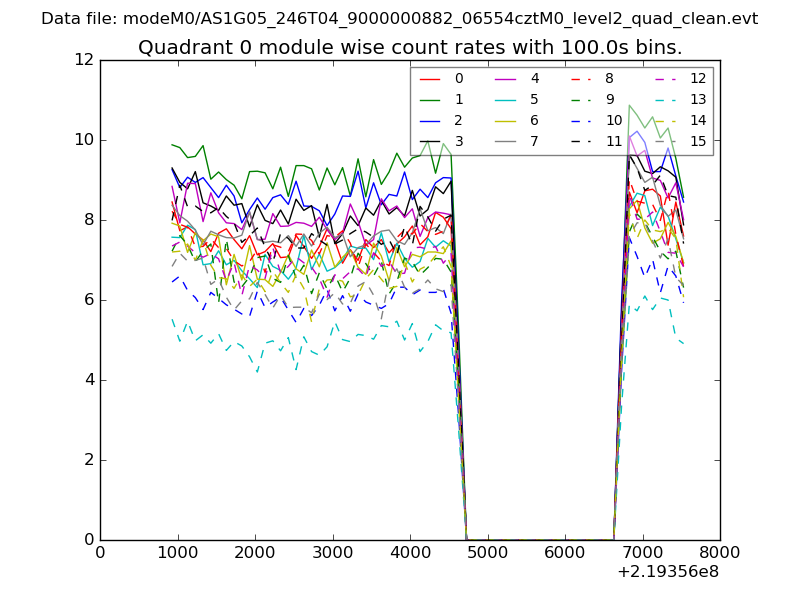 |
 |
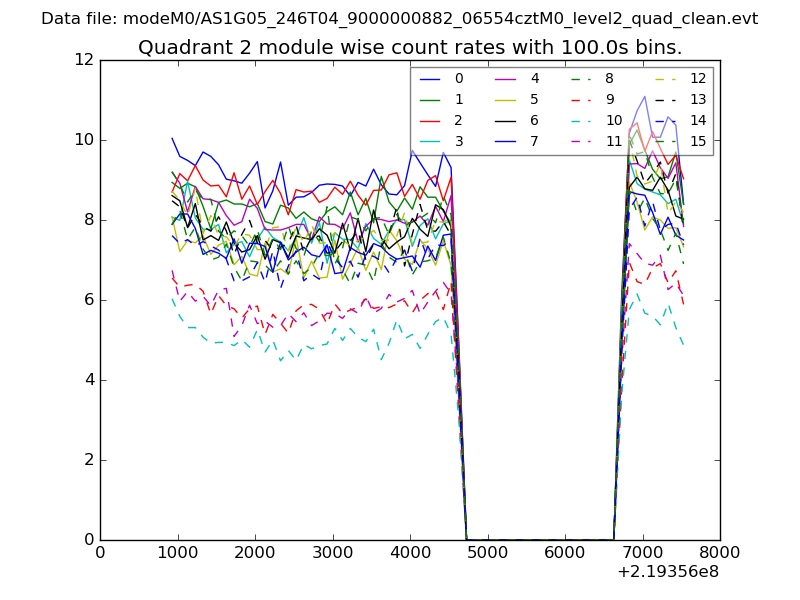
| Module-wise count rates for Quadrant B Data is divided into 100 sec bins |
 |
 |
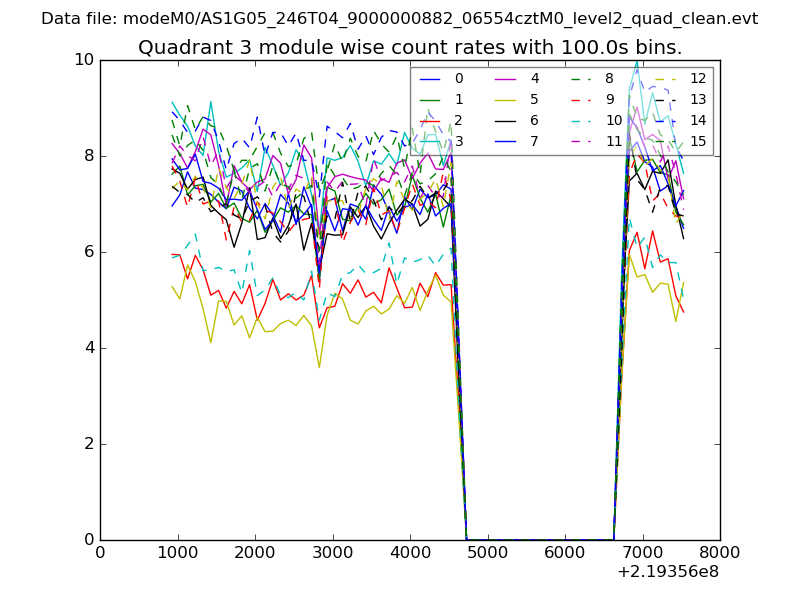
| Module-wise count rates for Quadrant C Data is divided into 100 sec bins |
 |
 |
| Module-wise count rates for Quadrant D Data is divided into 100 sec bins |
 |
 |
| Parameter | Plot |
|---|---|
| CZT HV Monitor | 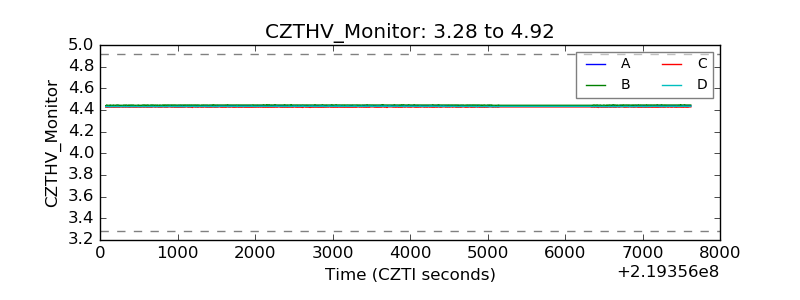 |
| D_VDD | 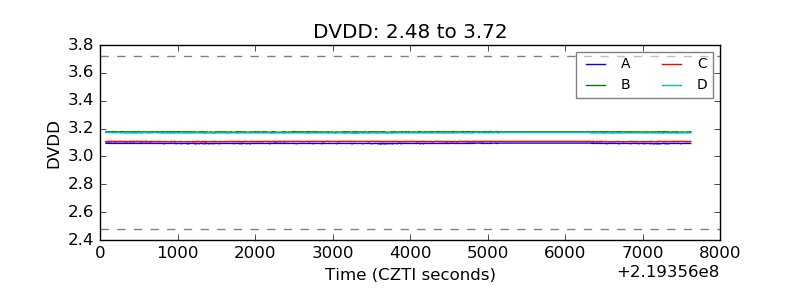 |
| Temperature 1 | 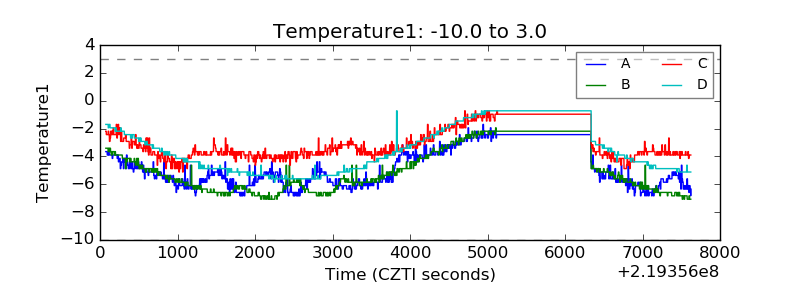 |
| Veto HV Monitor | 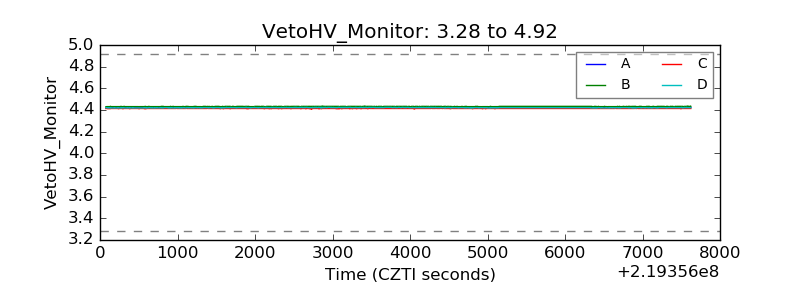 |
| Veto LLD | 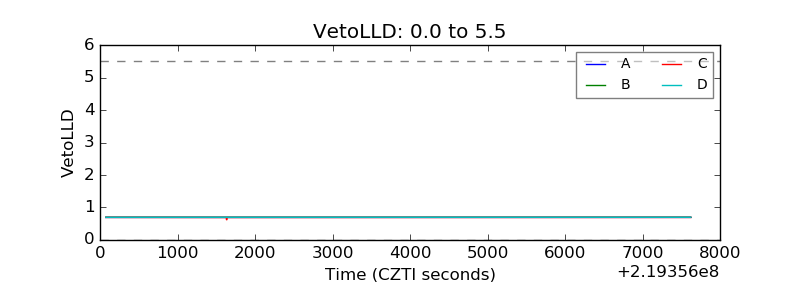 |
| Alpha Counter | 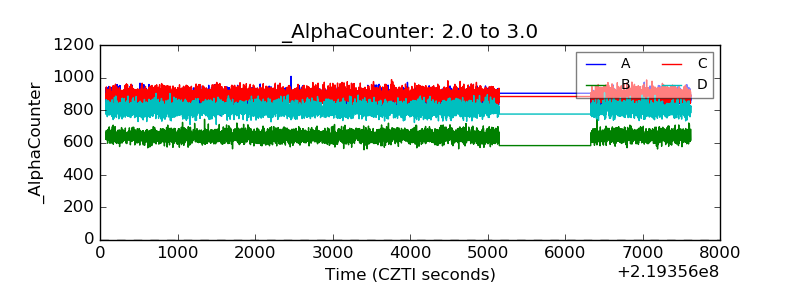 |
| _CPM_Rate | 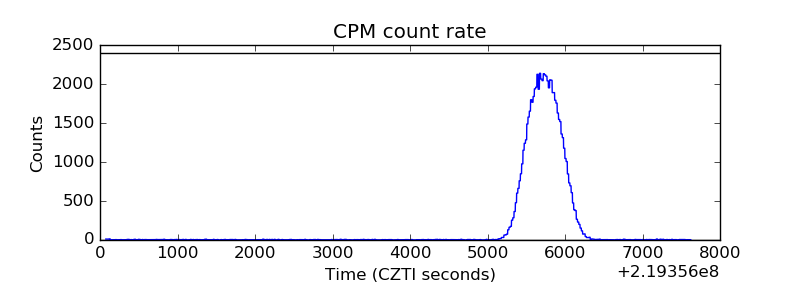 |
| CZT Counter | 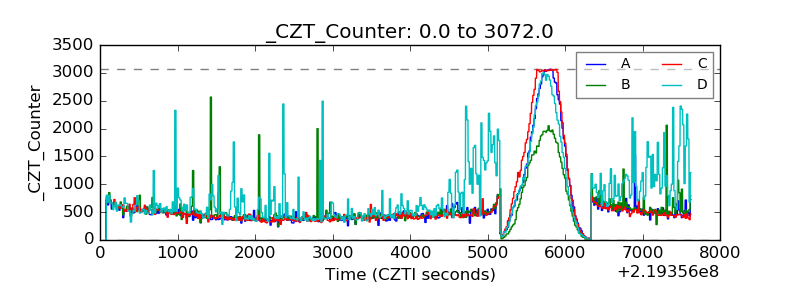 |
| +2.5 Volts monitor | 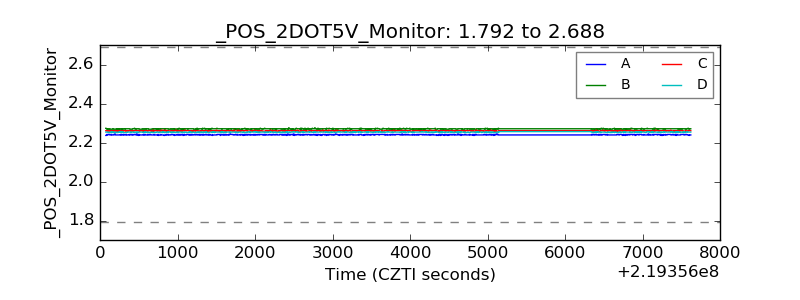 |
| +5 Volts monitor | 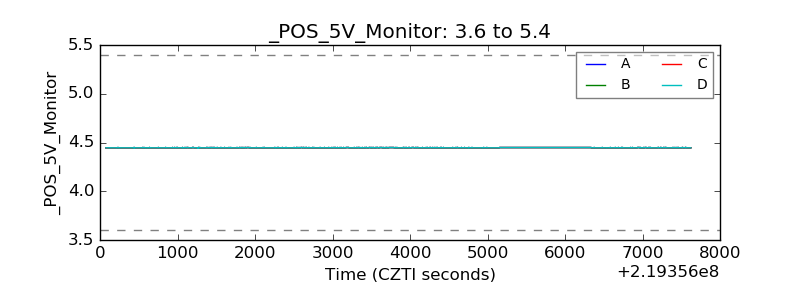 |
| _ROLL_ROT | 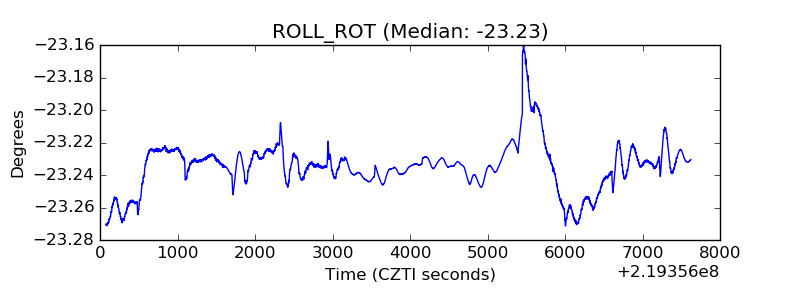 |
| _Roll_DEC | 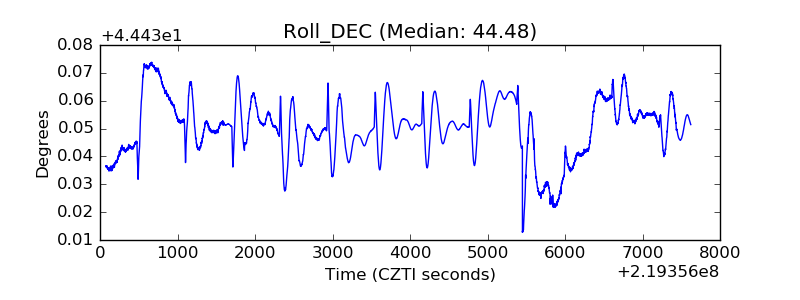 |
| _Roll_RA | 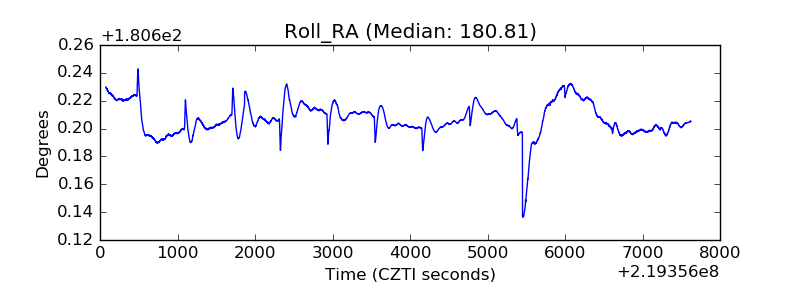 |
| Veto Counter | 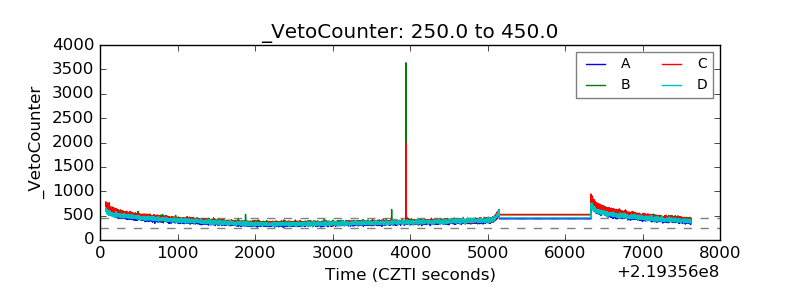 |