| Param | Original file | Final file |
|---|---|---|
| Filename | modeM0/AS1G05_246T04_9000000882_06556cztM0_level2.evt | modeM0/AS1G05_246T04_9000000882_06556cztM0_level2_quad_clean.evt |
| Size (bytes) | 446,863,680 | 109,391,040 |
| Size | 426.2 MB | 104.3 MB |
| Events in quadrant A | 3,112,444 | 717,295 |
| Events in quadrant B | 3,381,636 | 738,378 |
| Events in quadrant C | 3,043,022 | 725,327 |
| Events in quadrant D | 3,545,714 | 669,862 |
| Mode M0 | |||
|---|---|---|---|
| Quadrant | BADHDUFLAG | Total packets | Discarded packets |
| A | 0 | 13714 | 3 |
| B | 0 | 14482 | 2 |
| C | 0 | 13684 | 2 |
| D | 0 | 15388 | 2 |
| Mode SS | |||
|---|---|---|---|
| Quadrant | BADHDUFLAG | Total packets | Discarded packets |
| A | 0 | 134 | 0 |
| B | 0 | 134 | 0 |
| C | 0 | 134 | 0 |
| D | 0 | 134 | 0 |
| Mode M9 | |||
|---|---|---|---|
| Quadrant | BADHDUFLAG | Total packets | Discarded packets |
| A | 0 | 22 | 0 |
| B | 0 | 22 | 0 |
| C | 0 | 22 | 0 |
| D | 0 | 23 | 0 |
| Quadrant | Total seconds | Saturated seconds | Saturation percentage |
|---|---|---|---|
| A | 6629 | 19 | 0.286619% |
| B | 6629 | 46 | 0.693921% |
| C | 6629 | 12 | 0.181023% |
| D | 6629 | 181 | 2.730427% |
Noise dominated data is calculated using 1-second bins in cleaned event files. If a bin has >2000 counts, and if more than 50% of those come from <1% of pixels, then it is considered to be noise-dominated and hence unusable.
| Quadrant | # 1 sec bins | Bins with >0 counts | Bins with >2000 counts | High rate bins dominated by noise | Noise dominated (total time) | Noise dominated (detector-on time) | Marked lightcurve |
|---|---|---|---|---|---|---|---|
| A | 7959 | 6630 | 0 | 0 | 0.00% | 0.00% | 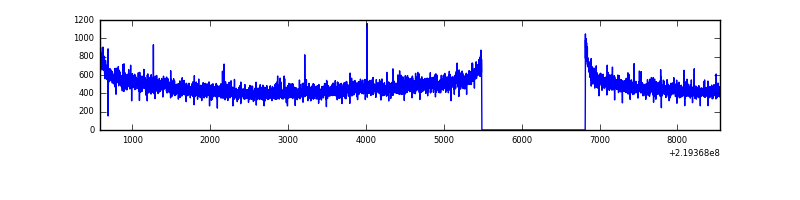 |
| B | 7959 | 6630 | 9 | 9 | 0.11% | 0.14% | 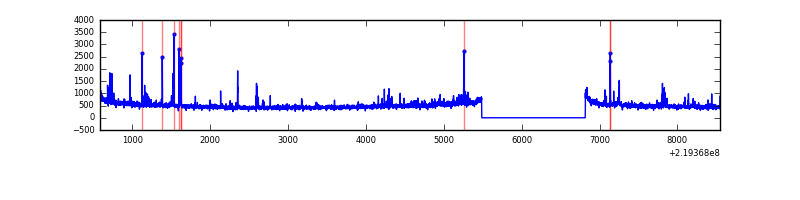 |
| C | 7959 | 6630 | 0 | 0 | 0.00% | 0.00% | 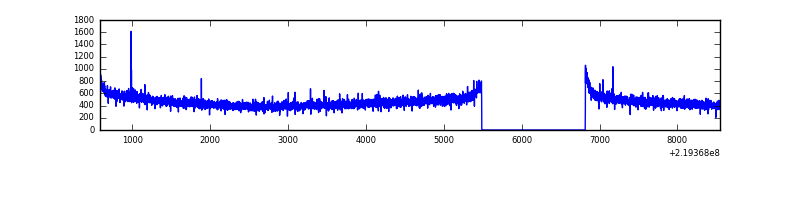 |
| D | 7959 | 6630 | 147 | 147 | 1.85% | 2.22% | 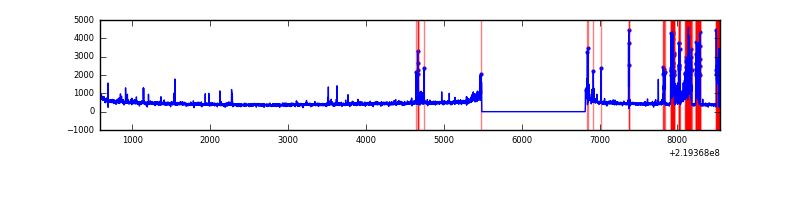 |
Top three noisy pixels from each quadrant. If the there are fewer than three noisy pixels in the level2.evt file, extra rows are filled as -1
| Pixel properties | Quadrant properties | ||||||
|---|---|---|---|---|---|---|---|
| Quadrant | DetID | PixID | Counts | Sigma | Mean | Median | Sigma |
| A | 8 | 15 | 68558 | 422.27 | 789 | 774 | 160.5 |
| A | 0 | 226 | 7533 | 42.11 | 789 | 774 | 160.5 |
| A | 12 | 194 | 7090 | 39.35 | 789 | 774 | 160.5 |
| B | 0 | 219 | 66357 | 434.05 | 804 | 788 | 151.1 |
| B | 4 | 81 | 54483 | 355.44 | 804 | 788 | 151.1 |
| B | 4 | 172 | 40998 | 266.18 | 804 | 788 | 151.1 |
| C | 8 | 128 | 6738 | 33.38 | 775 | 780 | 178.5 |
| C | 13 | 61 | 6265 | 30.73 | 775 | 780 | 178.5 |
| C | 9 | 54 | 4284 | 19.63 | 775 | 780 | 178.5 |
| D | 2 | 33 | 533018 | 2904.48 | 752 | 733 | 183.3 |
| D | 2 | 14 | 48967 | 263.19 | 752 | 733 | 183.3 |
| D | 13 | 137 | 38001 | 203.36 | 752 | 733 | 183.3 |
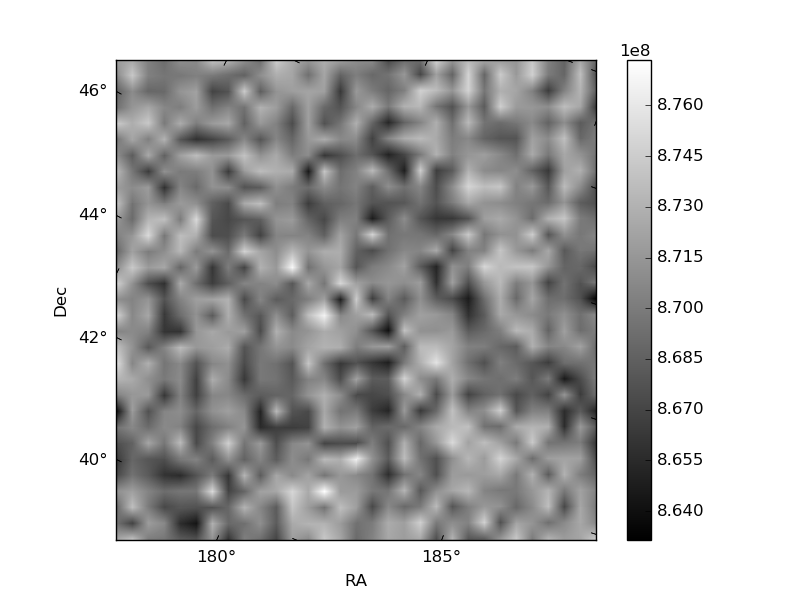
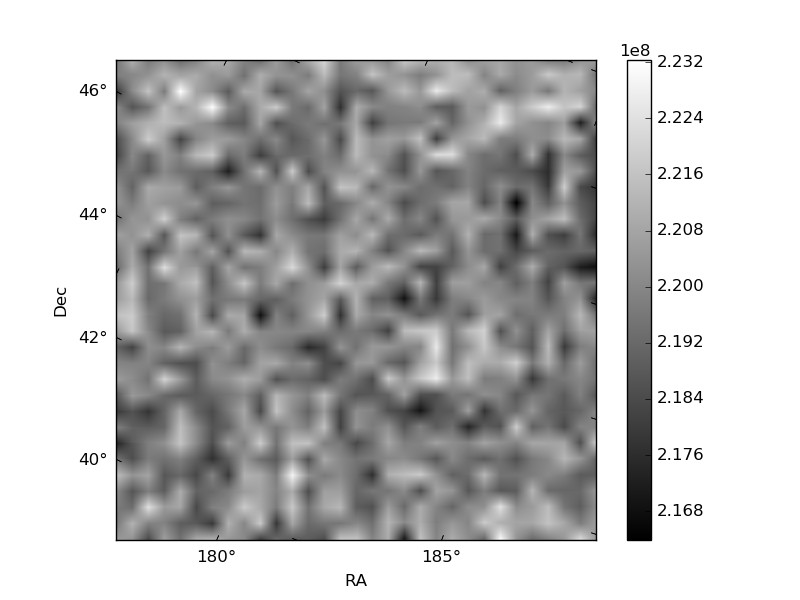
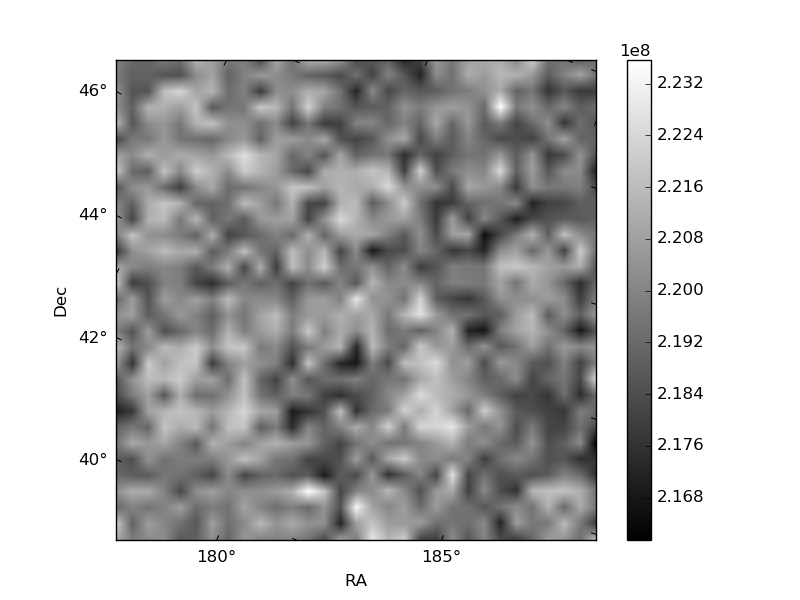
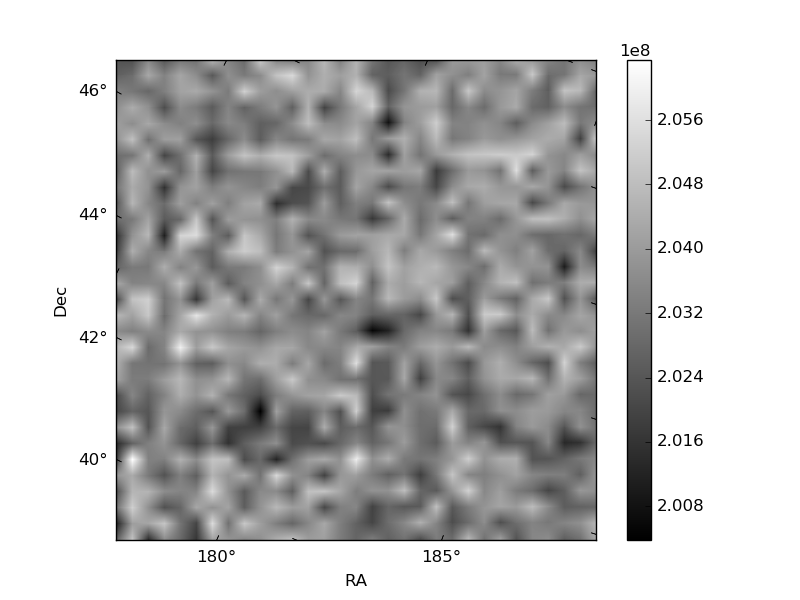
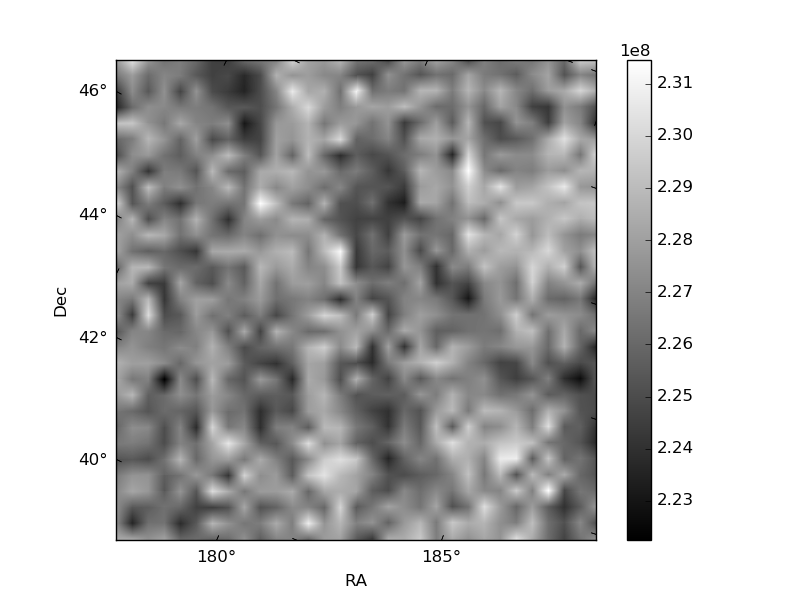
Histogram calculated using DETX and DETY for each event in the final _common_clean file
| Quadrant A | 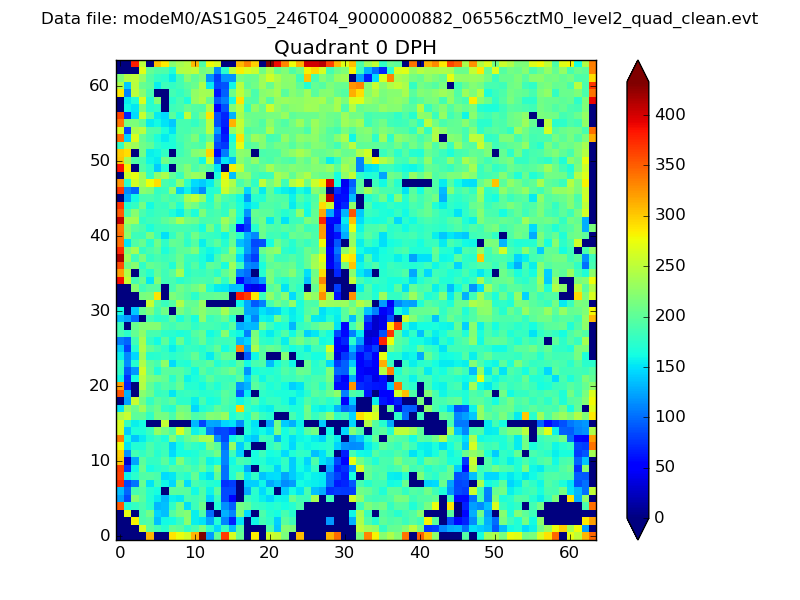 |
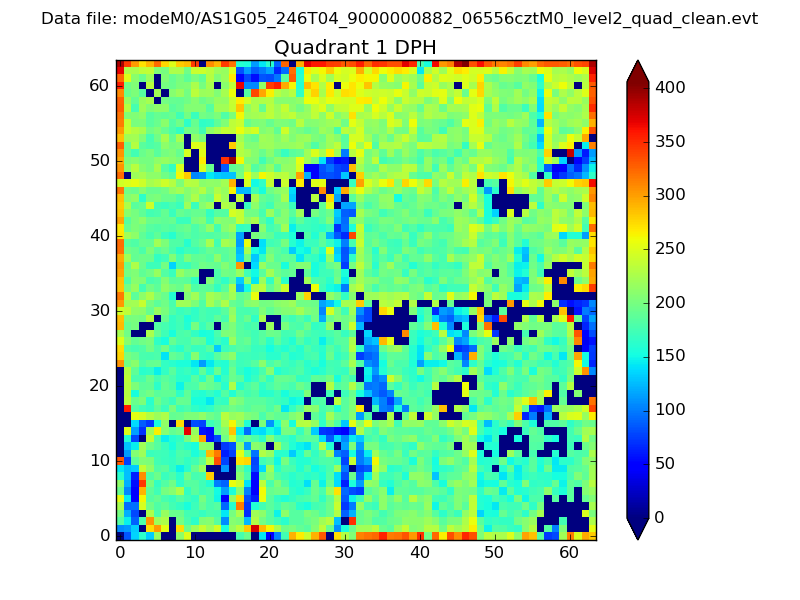 |
Quadrant B |
|---|---|---|---|
| Quadrant D | 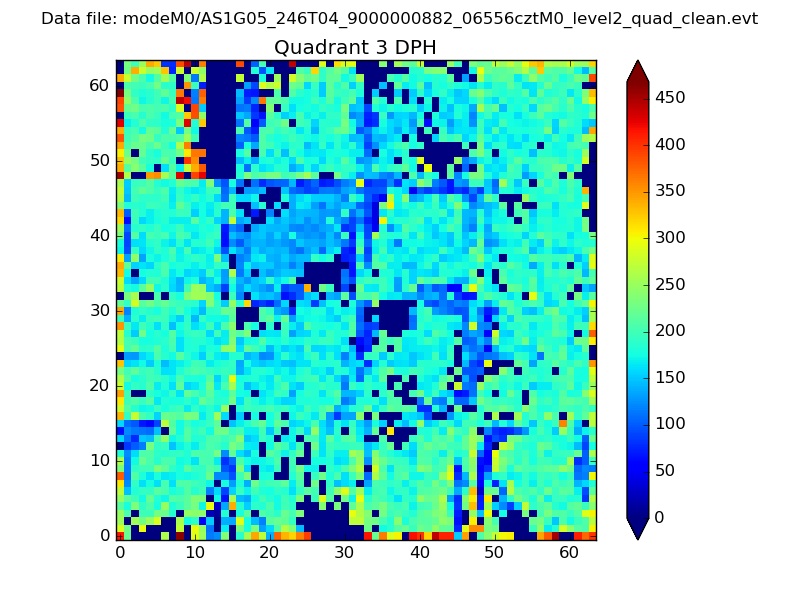 |
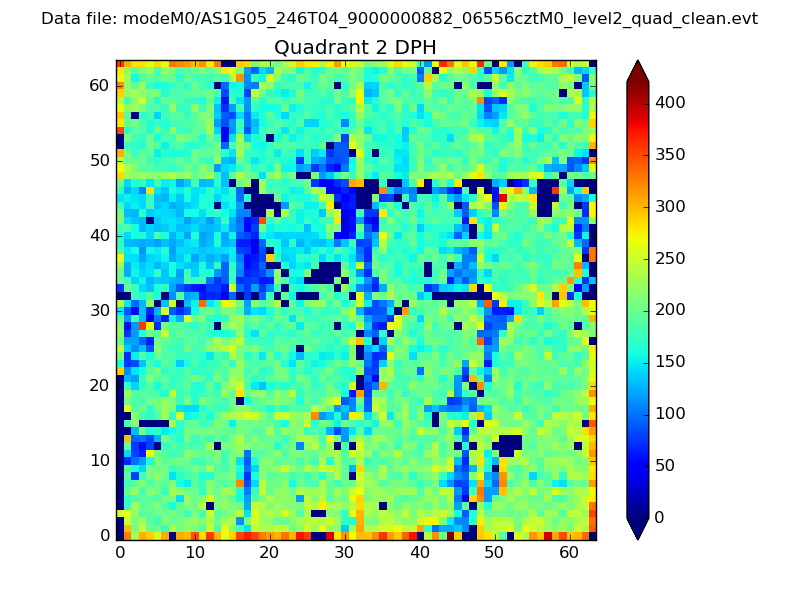 |
Quadrant C |
| Plot type | Count rate plots | Images |
|---|---|---|
| Comparison with Poisson distribution Blue bars denote a histogram of data divided into 1 sec bins. Red curve is a Poisson curve with rate = median count rate of data. |
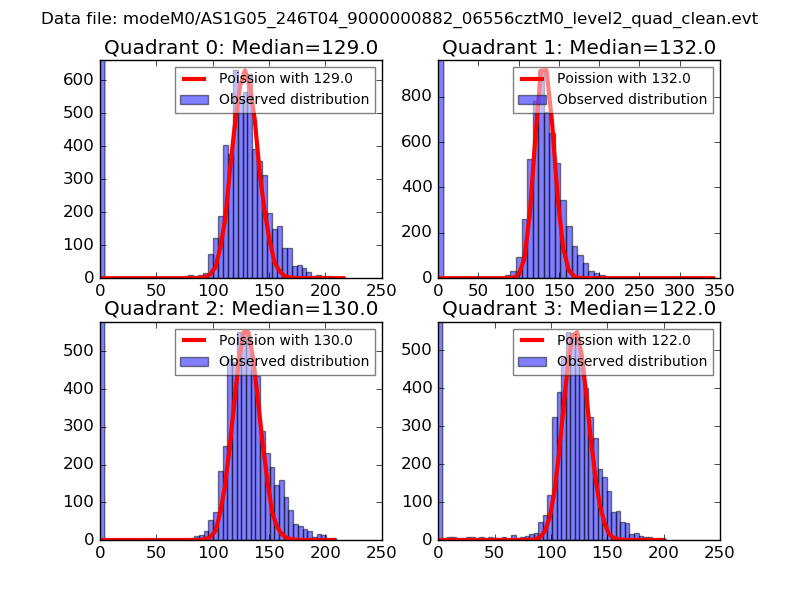 |
 |
| Quadrant-wise count rates Data is divided into 100 sec bins |
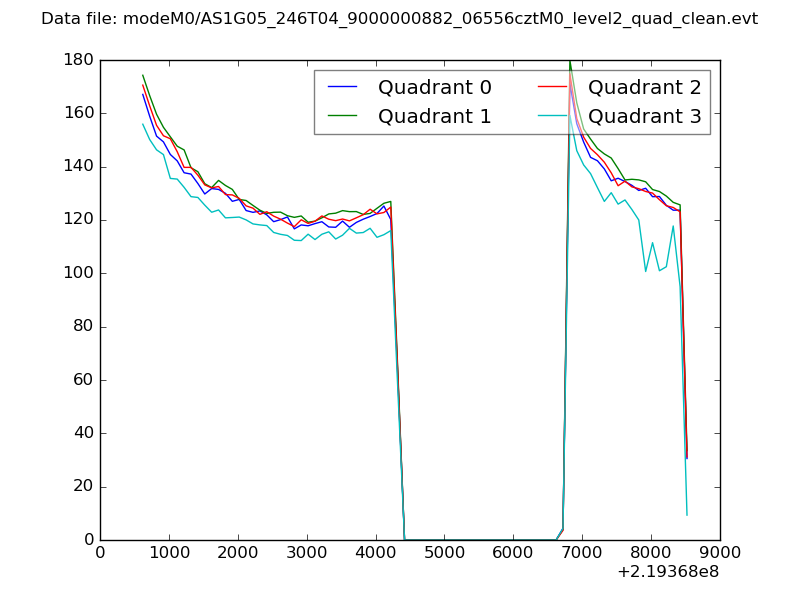 |
|
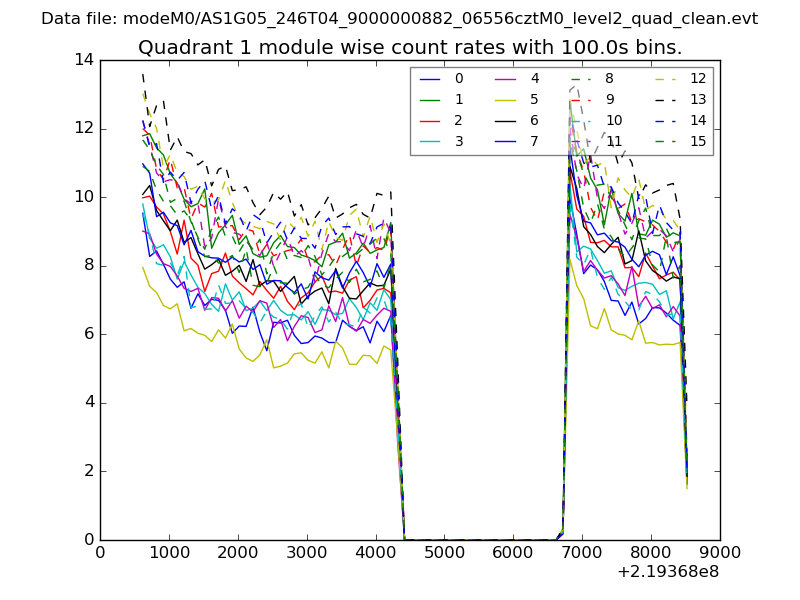
| Module-wise count rates for Quadrant A Data is divided into 100 sec bins |
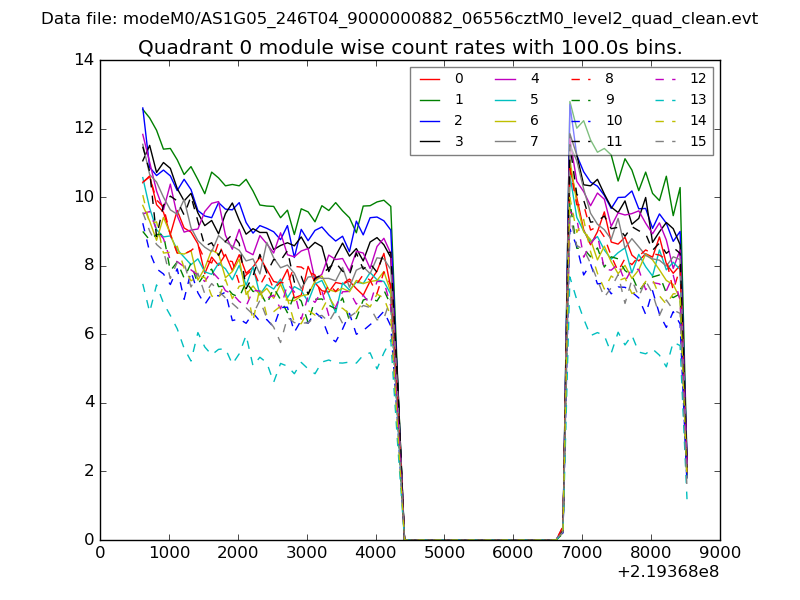 |
 |
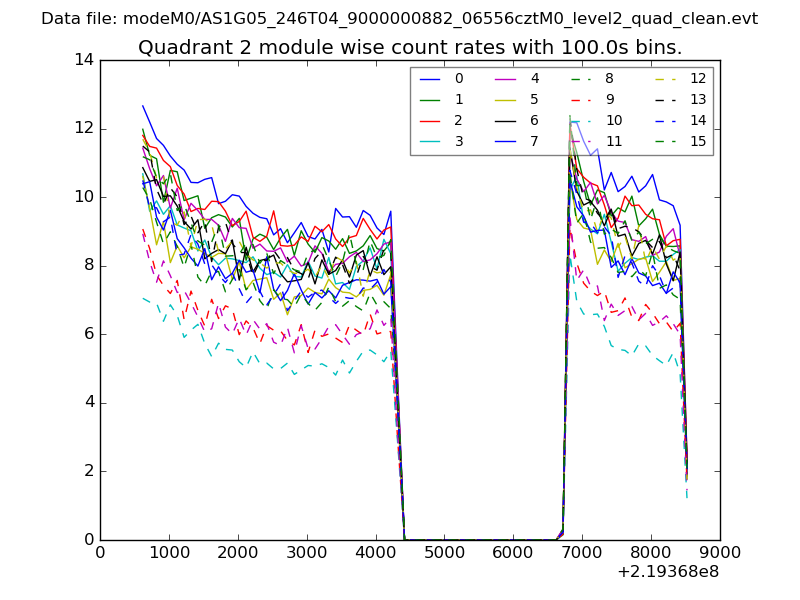
| Module-wise count rates for Quadrant B Data is divided into 100 sec bins |
 |
 |
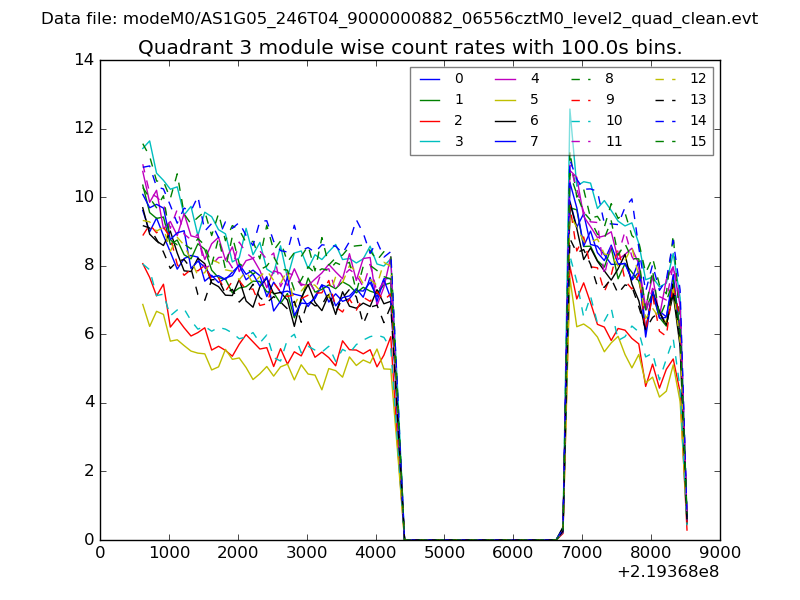
| Module-wise count rates for Quadrant C Data is divided into 100 sec bins |
 |
 |
| Module-wise count rates for Quadrant D Data is divided into 100 sec bins |
 |
 |
| Parameter | Plot |
|---|---|
| CZT HV Monitor | 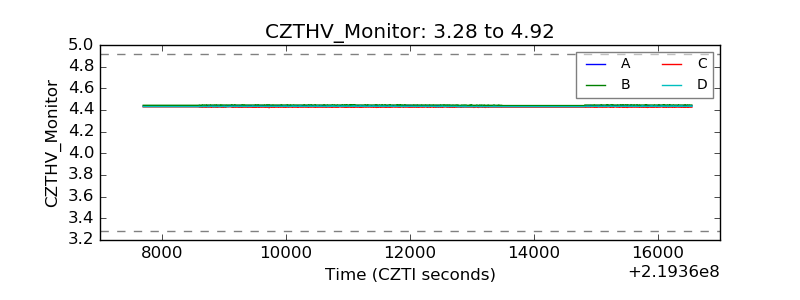 |
| D_VDD | 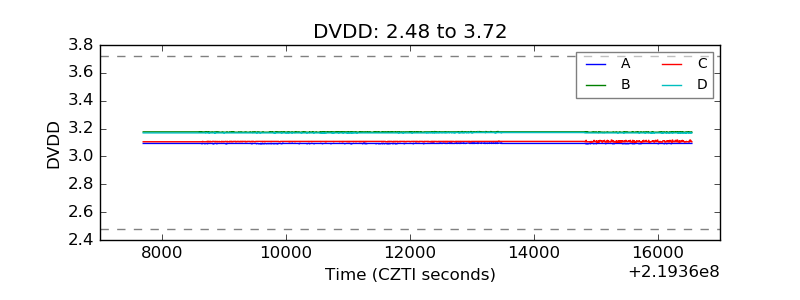 |
| Temperature 1 | 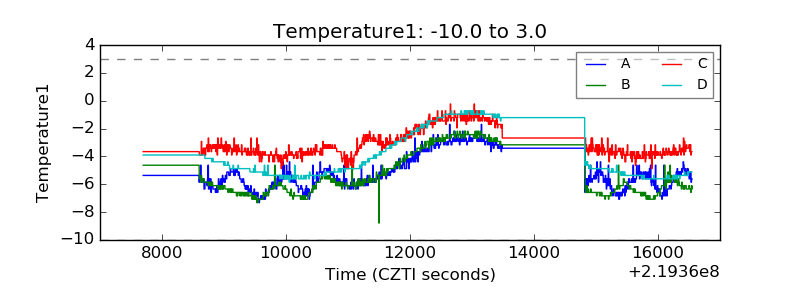 |
| Veto HV Monitor | 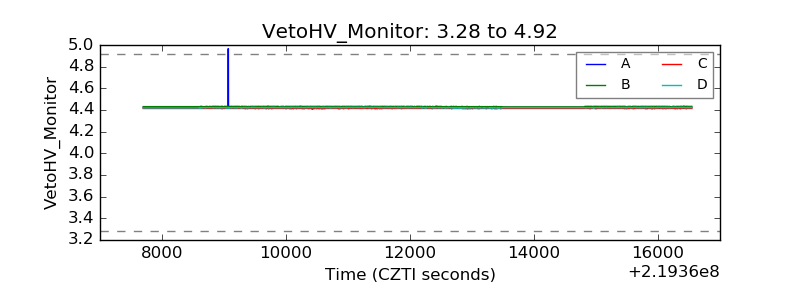 |
| Veto LLD | 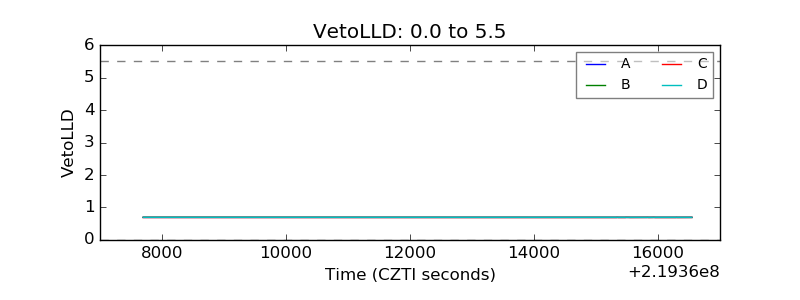 |
| Alpha Counter | 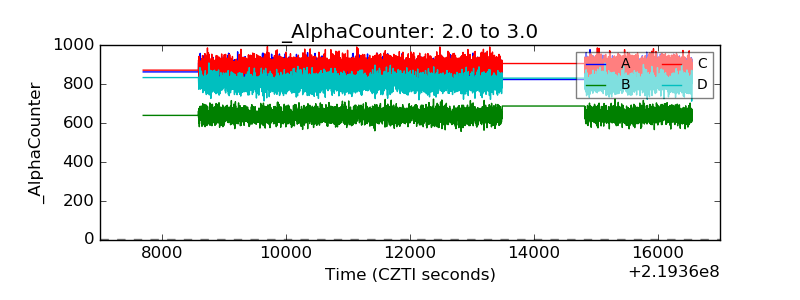 |
| _CPM_Rate | 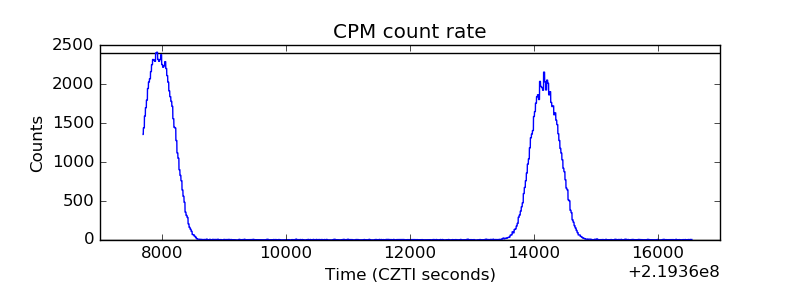 |
| CZT Counter | 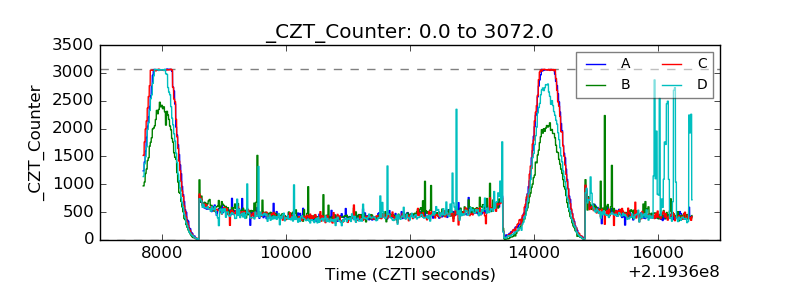 |
| +2.5 Volts monitor |  |
| +5 Volts monitor | 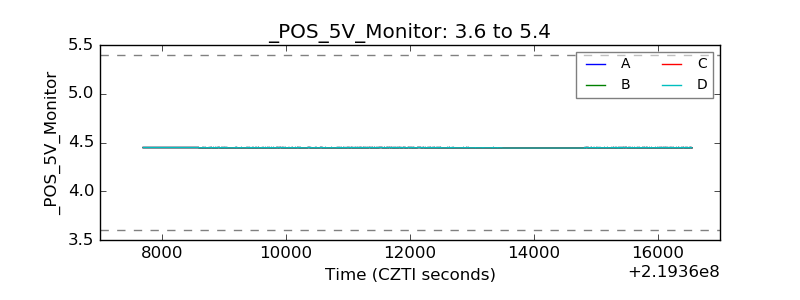 |
| _ROLL_ROT | 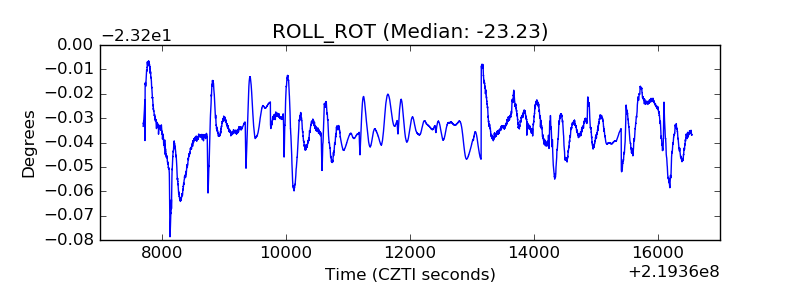 |
| _Roll_DEC | 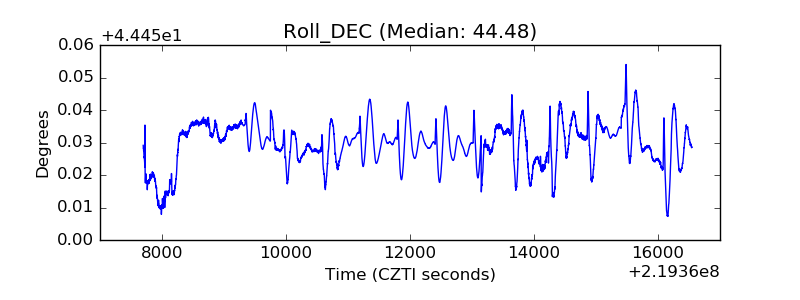 |
| _Roll_RA | 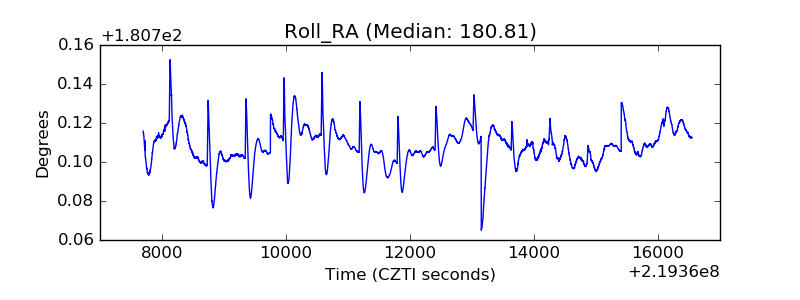 |
| Veto Counter | 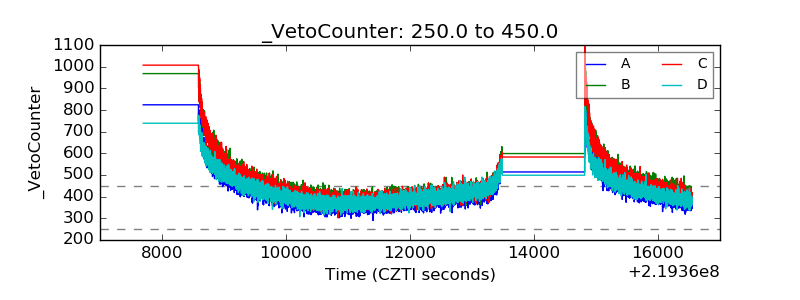 |