| Param | Original file | Final file |
|---|---|---|
| Filename | modeM0/AS1G05_246T04_9000000882_06559cztM0_level2.evt | modeM0/AS1G05_246T04_9000000882_06559cztM0_level2_quad_clean.evt |
| Size (bytes) | 434,770,560 | 75,574,080 |
| Size | 414.6 MB | 72.1 MB |
| Events in quadrant A | 2,752,421 | 469,552 |
| Events in quadrant B | 2,862,908 | 480,162 |
| Events in quadrant C | 2,643,506 | 473,143 |
| Events in quadrant D | 4,494,736 | 440,772 |
| Mode M0 | |||
|---|---|---|---|
| Quadrant | BADHDUFLAG | Total packets | Discarded packets |
| A | 0 | 12436 | 2 |
| B | 0 | 12746 | 1 |
| C | 0 | 12384 | 1 |
| D | 0 | 17603 | 1 |
| Mode SS | |||
|---|---|---|---|
| Quadrant | BADHDUFLAG | Total packets | Discarded packets |
| A | 0 | 124 | 0 |
| B | 0 | 124 | 0 |
| C | 0 | 124 | 0 |
| D | 0 | 124 | 0 |
| Mode M9 | |||
|---|---|---|---|
| Quadrant | BADHDUFLAG | Total packets | Discarded packets |
| A | 0 | 9 | 0 |
| B | 0 | 9 | 0 |
| C | 0 | 9 | 0 |
| D | 0 | 9 | 0 |
| Quadrant | Total seconds | Saturated seconds | Saturation percentage |
|---|---|---|---|
| A | 6080 | 47 | 0.773026% |
| B | 6080 | 59 | 0.970395% |
| C | 6080 | 14 | 0.230263% |
| D | 6080 | 230 | 3.782895% |
Noise dominated data is calculated using 1-second bins in cleaned event files. If a bin has >2000 counts, and if more than 50% of those come from <1% of pixels, then it is considered to be noise-dominated and hence unusable.
| Quadrant | # 1 sec bins | Bins with >0 counts | Bins with >2000 counts | High rate bins dominated by noise | Noise dominated (total time) | Noise dominated (detector-on time) | Marked lightcurve |
|---|---|---|---|---|---|---|---|
| A | 6930 | 6081 | 0 | 0 | 0.00% | 0.00% | 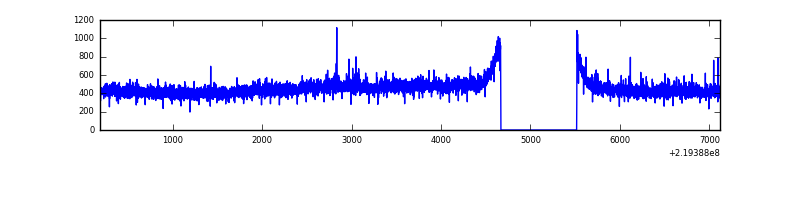 |
| B | 6930 | 6081 | 14 | 14 | 0.20% | 0.23% | 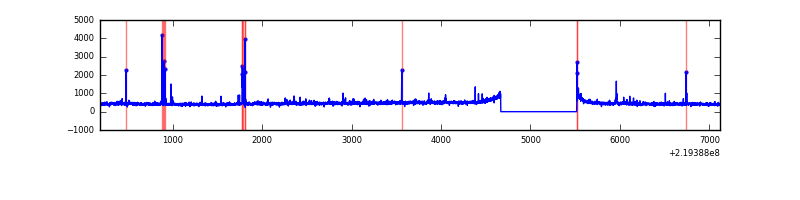 |
| C | 6930 | 6081 | 0 | 0 | 0.00% | 0.00% | 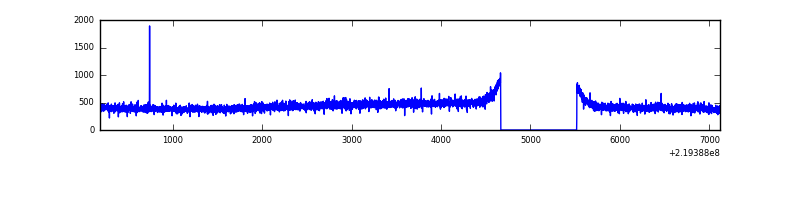 |
| D | 6930 | 6081 | 176 | 176 | 2.54% | 2.89% | 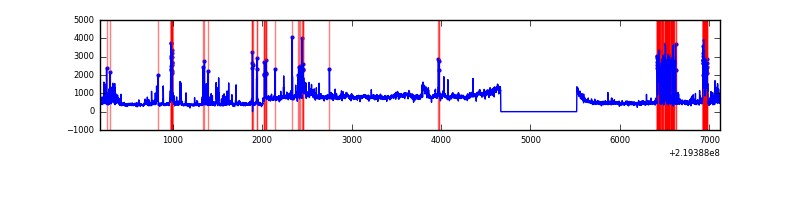 |
Top three noisy pixels from each quadrant. If the there are fewer than three noisy pixels in the level2.evt file, extra rows are filled as -1
| Pixel properties | Quadrant properties | ||||||
|---|---|---|---|---|---|---|---|
| Quadrant | DetID | PixID | Counts | Sigma | Mean | Median | Sigma |
| A | 8 | 15 | 68556 | 472.07 | 696 | 680 | 143.8 |
| A | 0 | 226 | 6596 | 41.15 | 696 | 680 | 143.8 |
| A | 12 | 194 | 6362 | 39.52 | 696 | 680 | 143.8 |
| B | 4 | 48 | 37277 | 269.2 | 699 | 682 | 135.9 |
| B | 4 | 172 | 34946 | 252.05 | 699 | 682 | 135.9 |
| B | 4 | 81 | 30984 | 222.91 | 699 | 682 | 135.9 |
| C | 13 | 61 | 5396 | 30.16 | 674 | 676 | 156.5 |
| C | 12 | 4 | 4634 | 25.29 | 674 | 676 | 156.5 |
| C | 9 | 54 | 3732 | 19.53 | 674 | 676 | 156.5 |
| D | 12 | 221 | 1135238 | 6912.28 | 665 | 644 | 164.1 |
| D | 2 | 33 | 718226 | 4371.72 | 665 | 644 | 164.1 |
| D | 10 | 172 | 39663 | 237.72 | 665 | 644 | 164.1 |
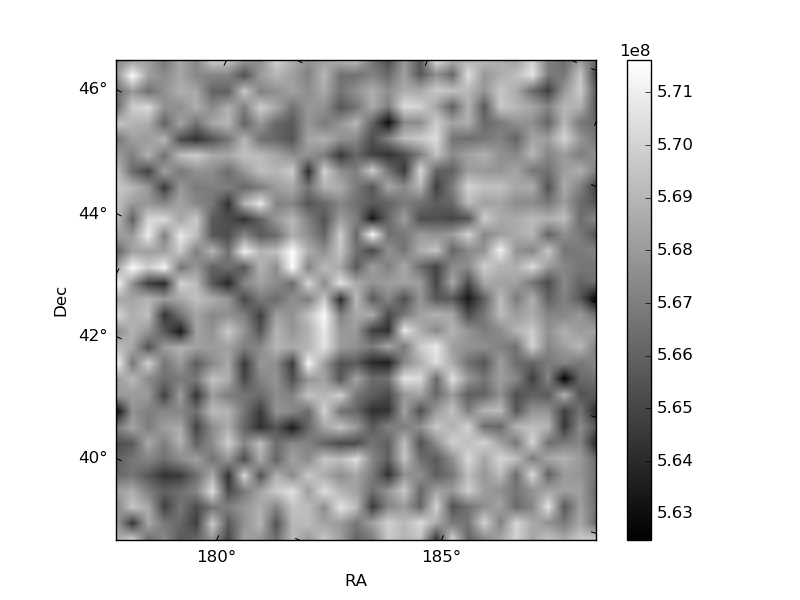
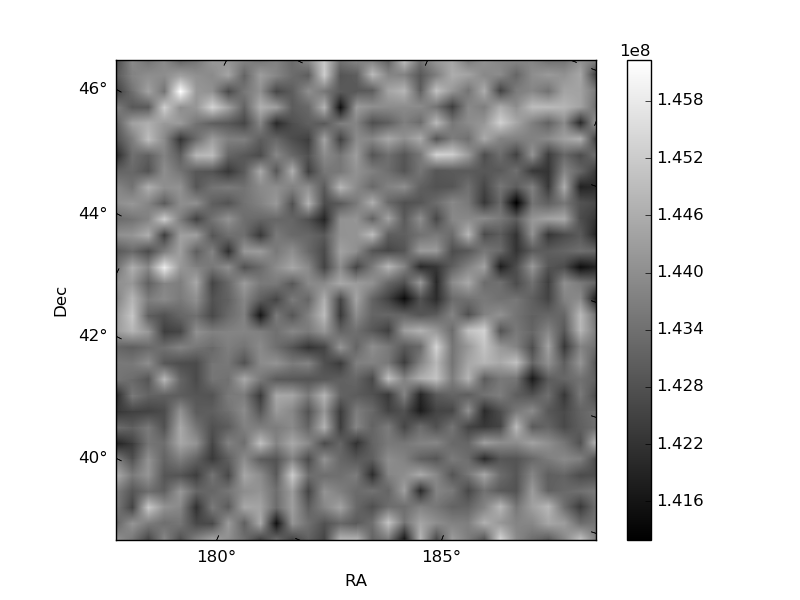
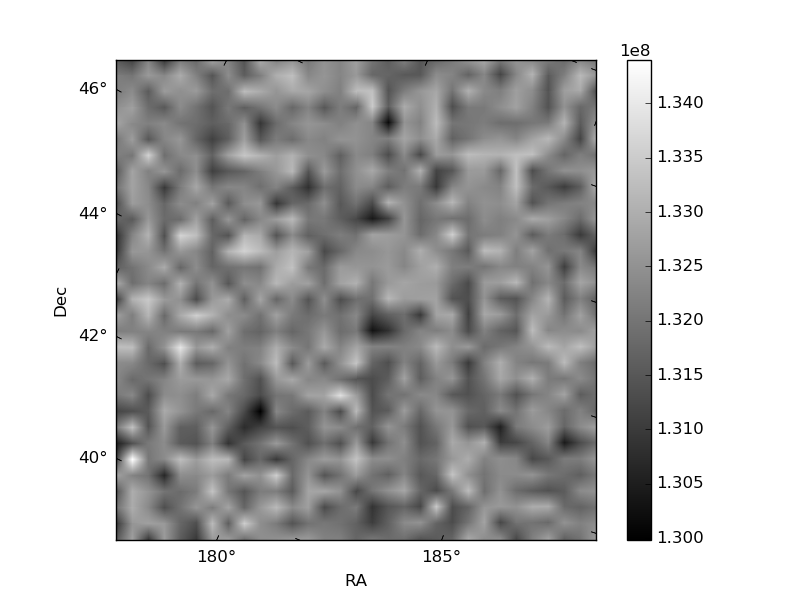
Histogram calculated using DETX and DETY for each event in the final _common_clean file
| Quadrant A | 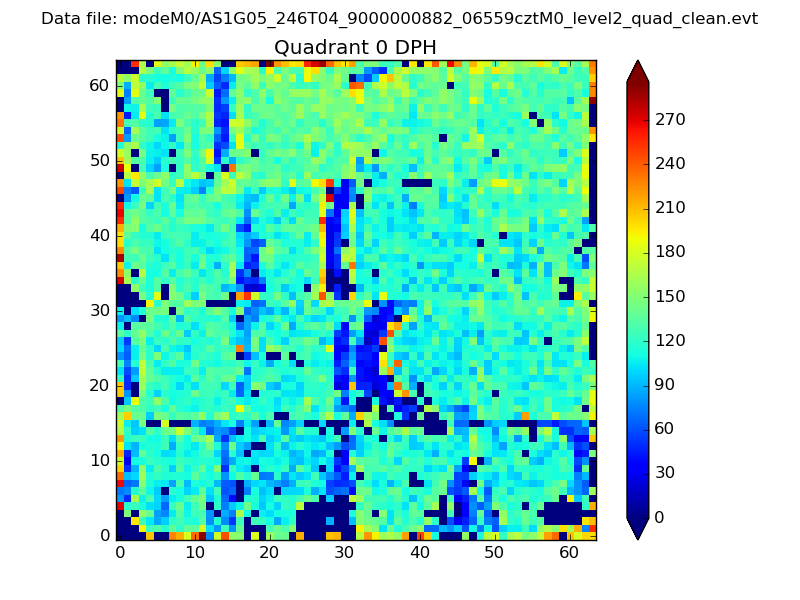 |
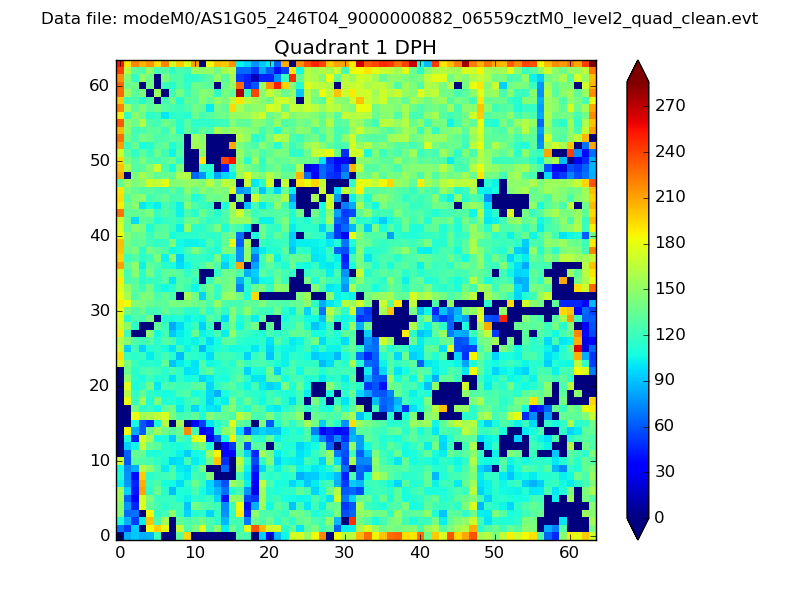 |
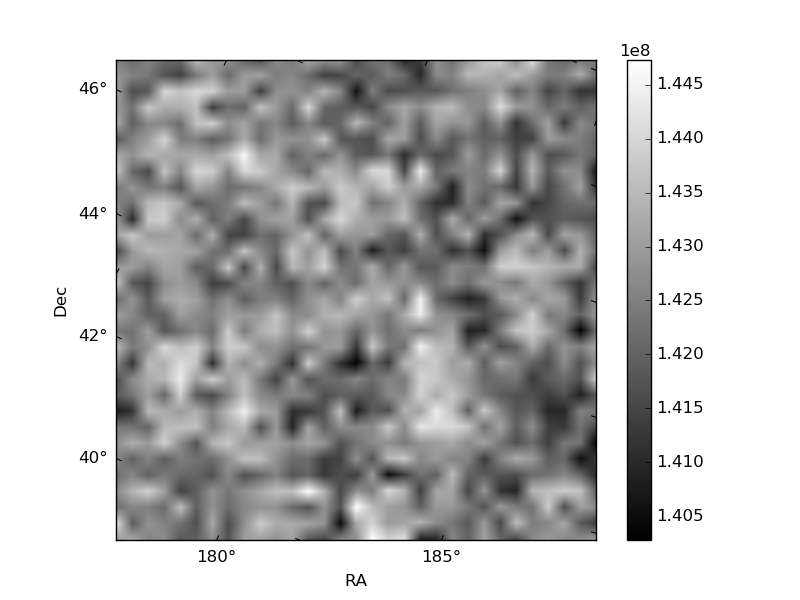
Quadrant B |
|---|---|---|---|
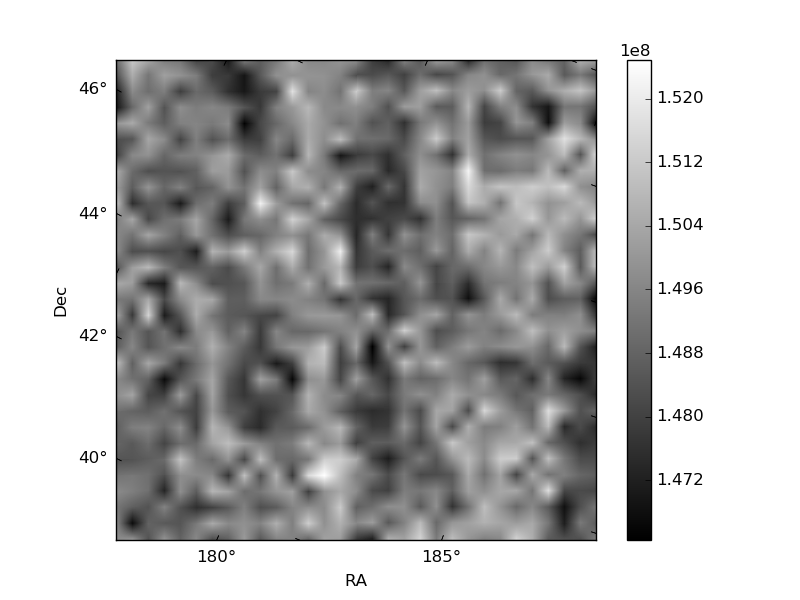
| Quadrant D | 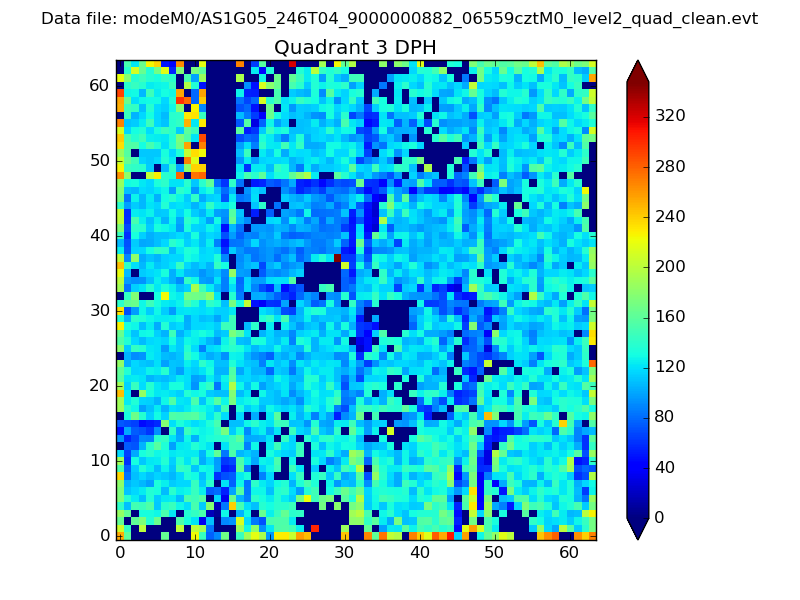 |
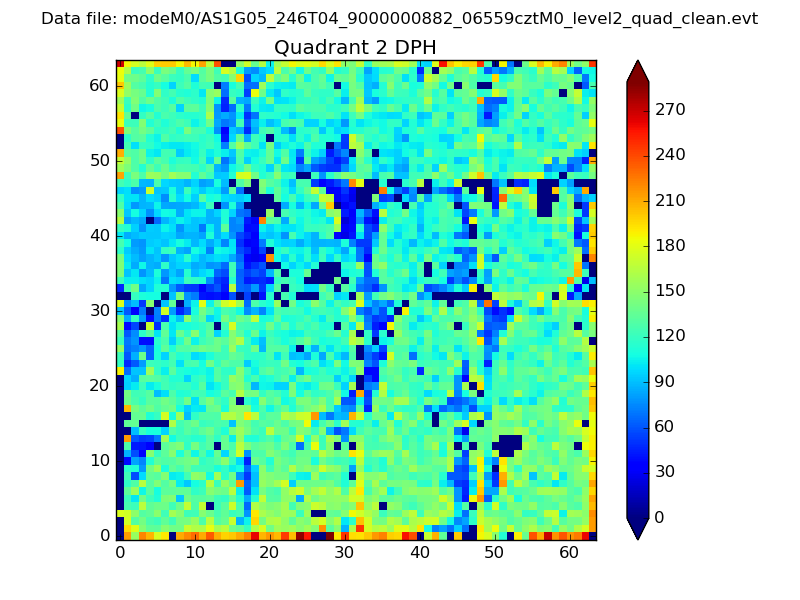 |
Quadrant C |
| Plot type | Count rate plots | Images |
|---|---|---|
| Comparison with Poisson distribution Blue bars denote a histogram of data divided into 1 sec bins. Red curve is a Poisson curve with rate = median count rate of data. |
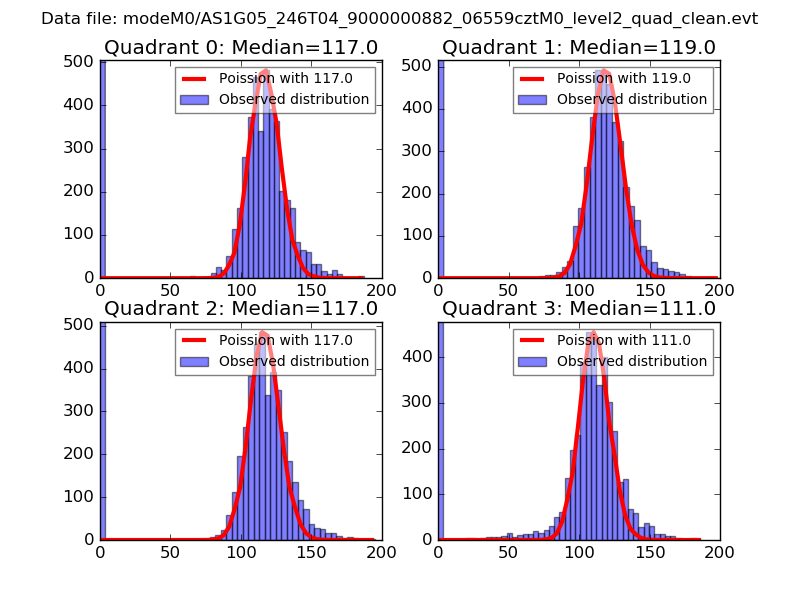 |
 |
| Quadrant-wise count rates Data is divided into 100 sec bins |
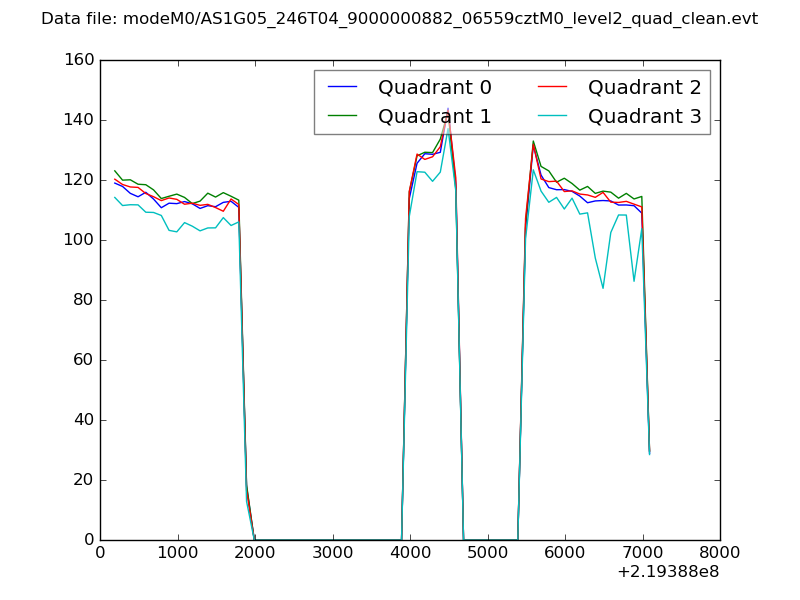 |
|
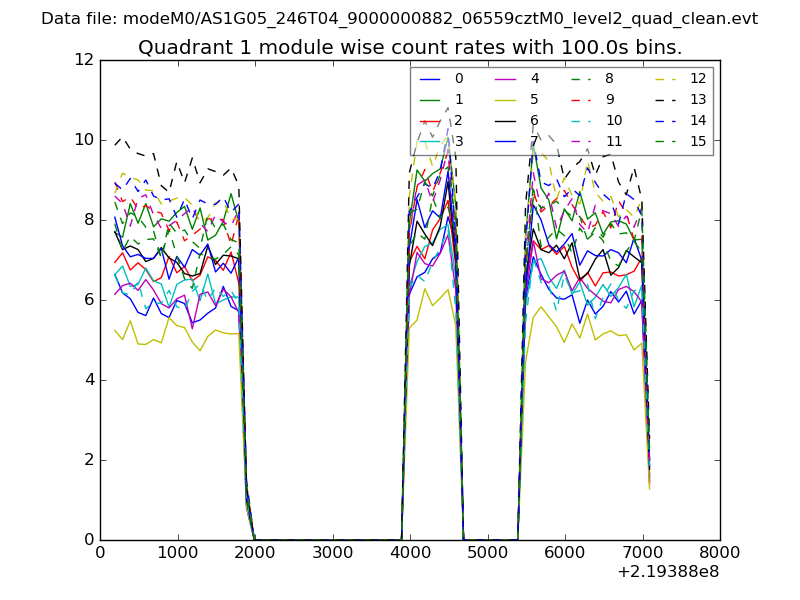
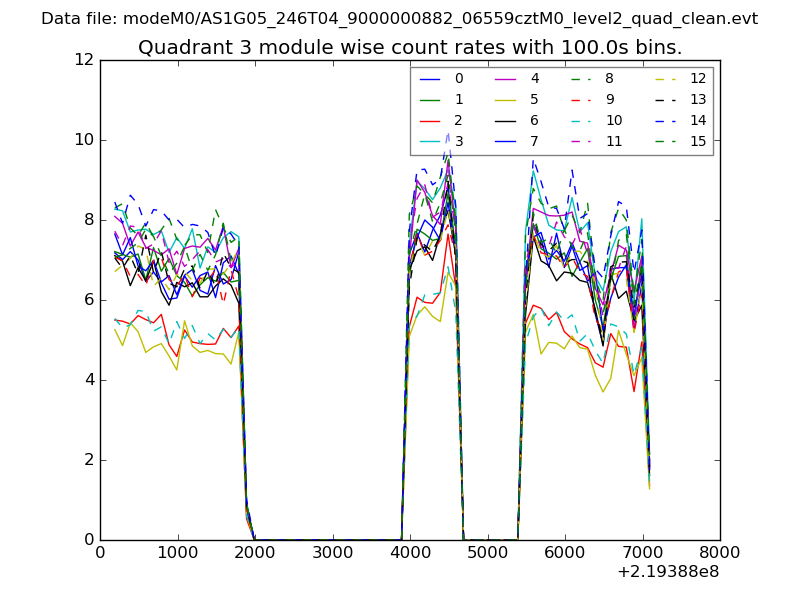
| Module-wise count rates for Quadrant A Data is divided into 100 sec bins |
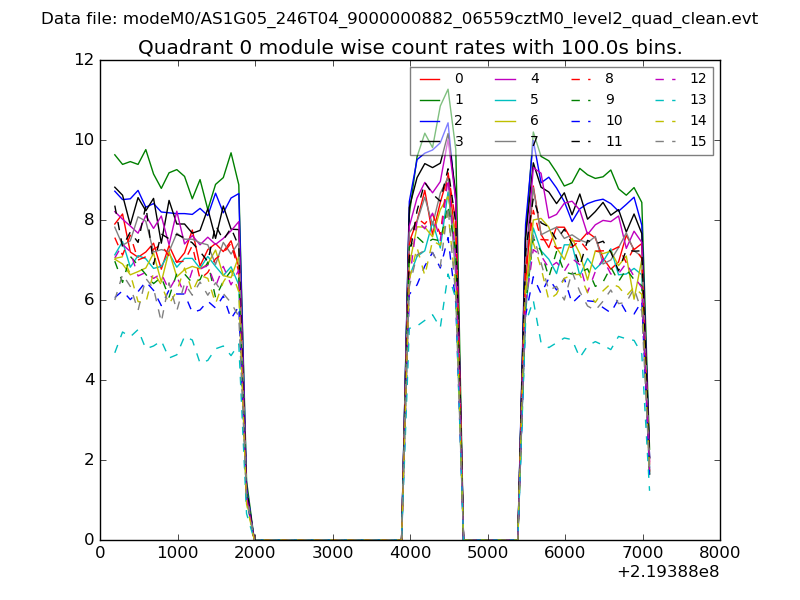 |
 |
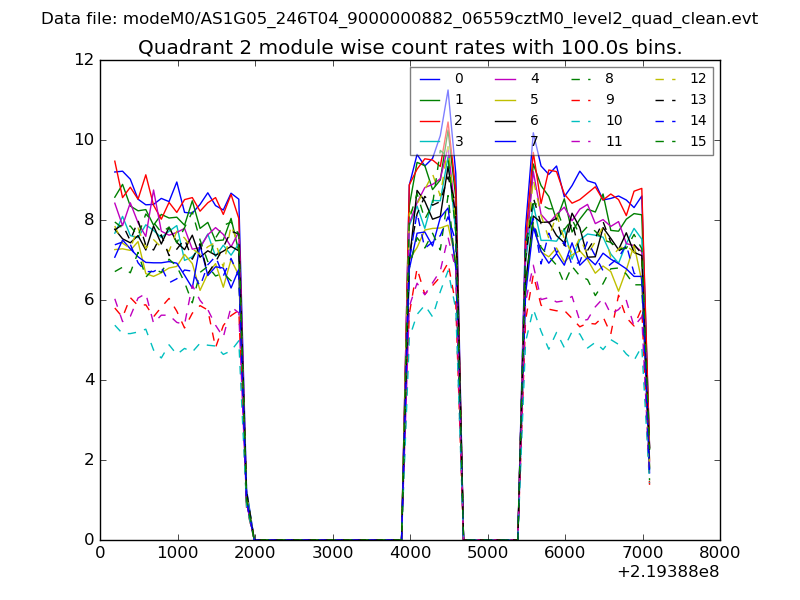
| Module-wise count rates for Quadrant B Data is divided into 100 sec bins |
 |
 |
| Module-wise count rates for Quadrant C Data is divided into 100 sec bins |
 |
 |
| Module-wise count rates for Quadrant D Data is divided into 100 sec bins |
 |
 |
| Parameter | Plot |
|---|---|
| CZT HV Monitor | 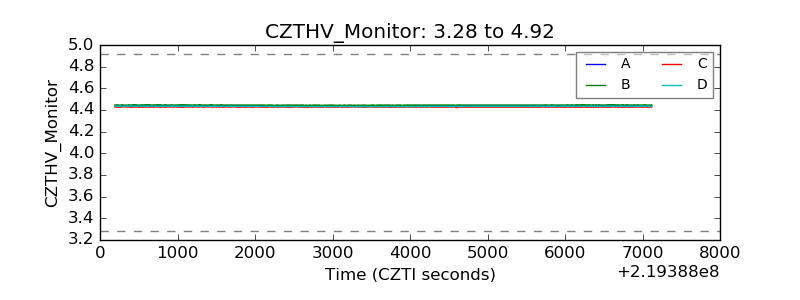 |
| D_VDD | 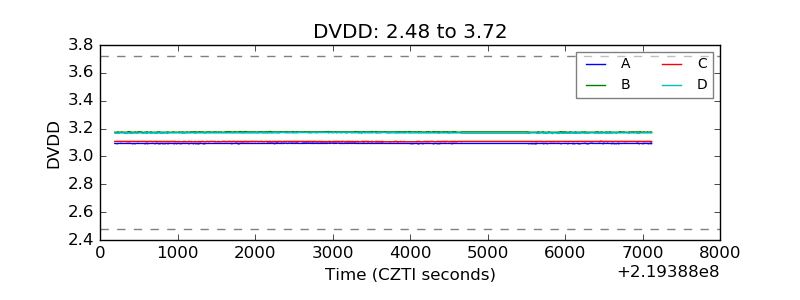 |
| Temperature 1 | 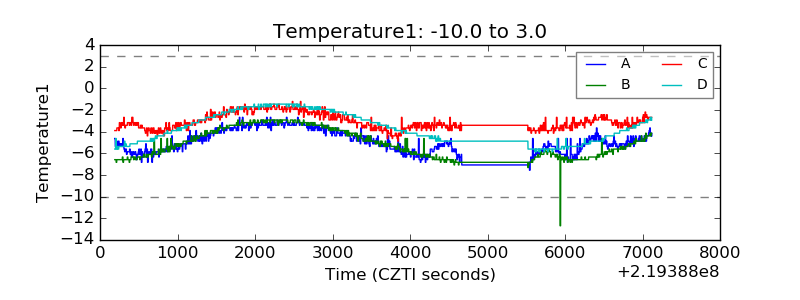 |
| Veto HV Monitor | 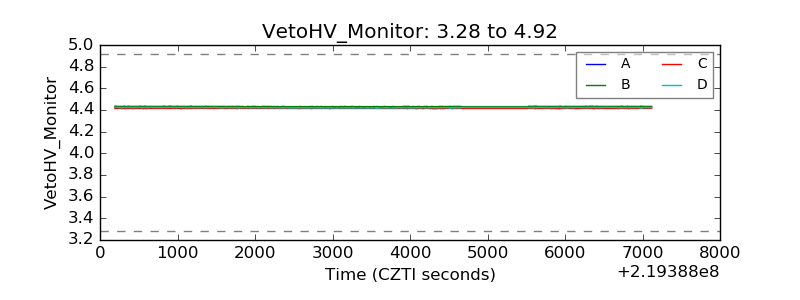 |
| Veto LLD | 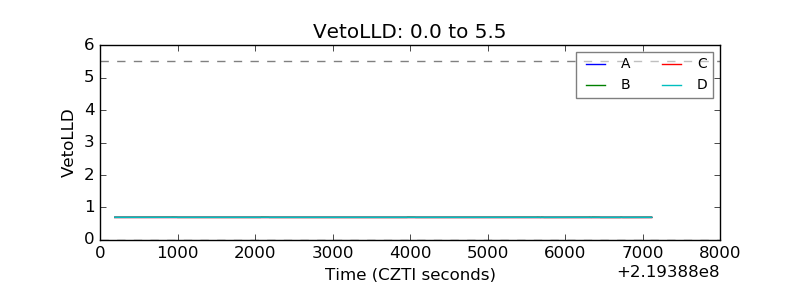 |
| Alpha Counter | 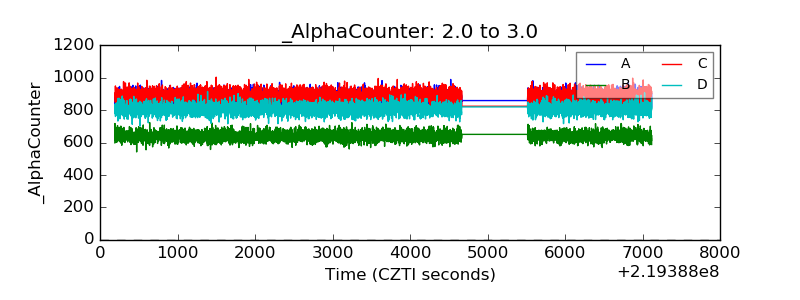 |
| _CPM_Rate | 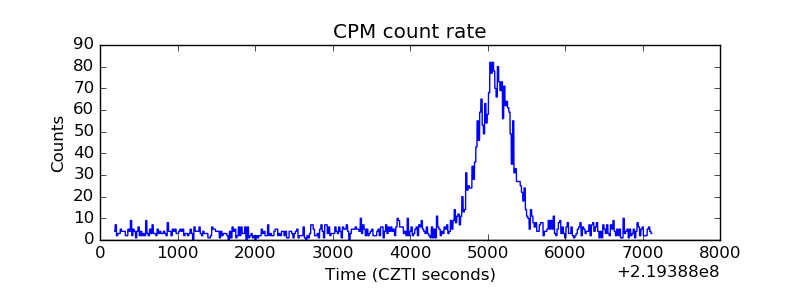 |
| CZT Counter | 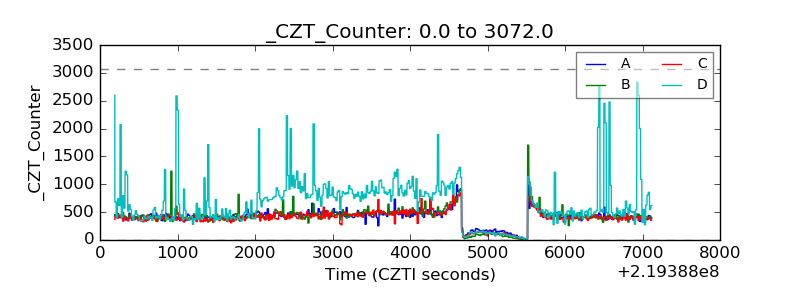 |
| +2.5 Volts monitor |  |
| +5 Volts monitor | 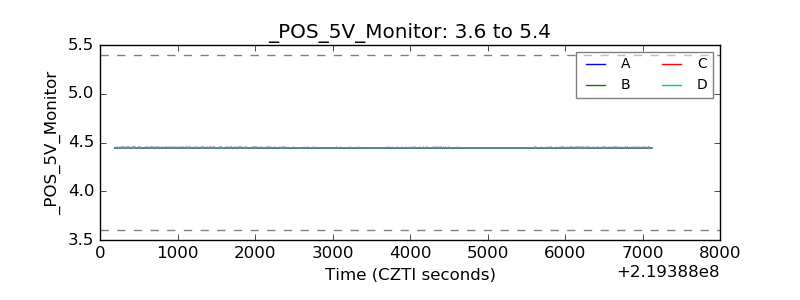 |
| _ROLL_ROT | 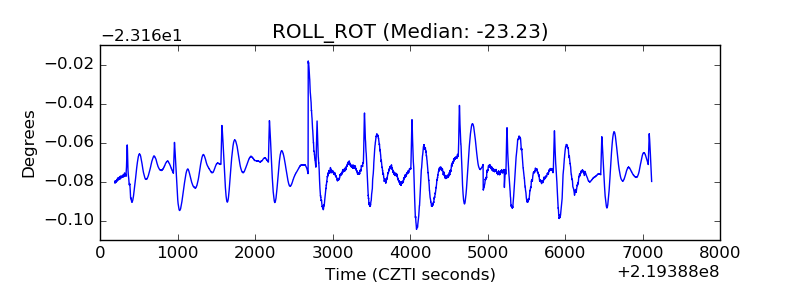 |
| _Roll_DEC | 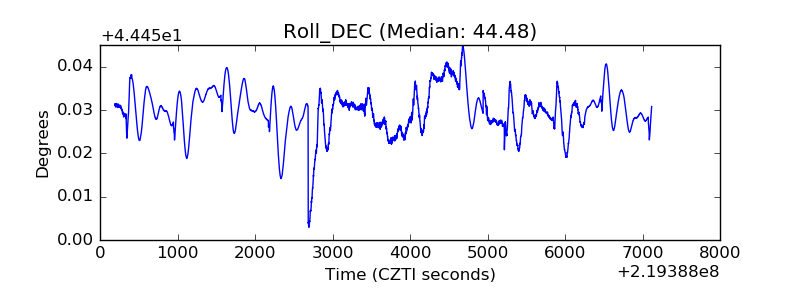 |
| _Roll_RA | 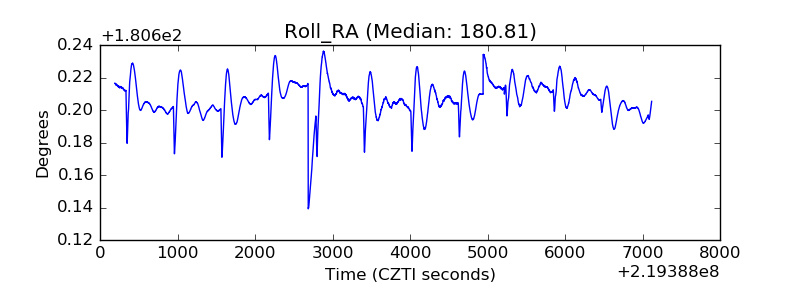 |
| Veto Counter | 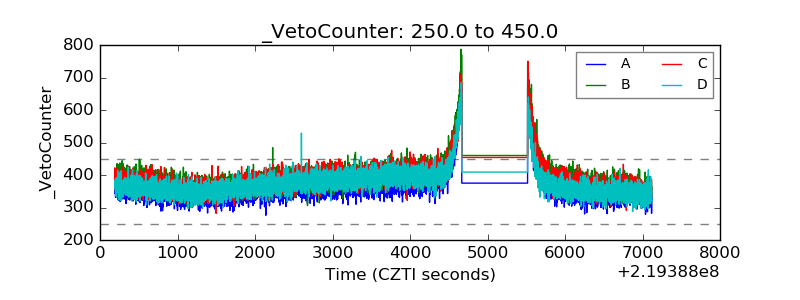 |