| Param | Original file | Final file |
|---|---|---|
| Filename | modeM0/AS1G05_246T04_9000000882_06561cztM0_level2.evt | modeM0/AS1G05_246T04_9000000882_06561cztM0_level2_quad_clean.evt |
| Size (bytes) | 497,350,080 | 101,275,200 |
| Size | 474.3 MB | 96.6 MB |
| Events in quadrant A | 3,509,568 | 637,546 |
| Events in quadrant B | 3,839,120 | 646,676 |
| Events in quadrant C | 3,453,863 | 640,717 |
| Events in quadrant D | 3,739,892 | 609,872 |
| Mode M0 | |||
|---|---|---|---|
| Quadrant | BADHDUFLAG | Total packets | Discarded packets |
| A | 0 | 15754 | 1 |
| B | 0 | 16627 | 0 |
| C | 0 | 15939 | 0 |
| D | 0 | 16758 | 0 |
| Mode SS | |||
|---|---|---|---|
| Quadrant | BADHDUFLAG | Total packets | Discarded packets |
| A | 0 | 154 | 0 |
| B | 0 | 154 | 0 |
| C | 0 | 154 | 0 |
| D | 0 | 154 | 0 |
| Quadrant | Total seconds | Saturated seconds | Saturation percentage |
|---|---|---|---|
| A | 7645 | 172 | 2.249836% |
| B | 7645 | 217 | 2.838457% |
| C | 7645 | 99 | 1.294964% |
| D | 7645 | 163 | 2.132112% |
Noise dominated data is calculated using 1-second bins in cleaned event files. If a bin has >2000 counts, and if more than 50% of those come from <1% of pixels, then it is considered to be noise-dominated and hence unusable.
| Quadrant | # 1 sec bins | Bins with >0 counts | Bins with >2000 counts | High rate bins dominated by noise | Noise dominated (total time) | Noise dominated (detector-on time) | Marked lightcurve |
|---|---|---|---|---|---|---|---|
| A | 7645 | 7645 | 0 | 0 | 0.00% | 0.00% |  |
| B | 7645 | 7645 | 51 | 51 | 0.67% | 0.67% |  |
| C | 7645 | 7645 | 15 | 15 | 0.20% | 0.20% |  |
| D | 7645 | 7645 | 42 | 42 | 0.55% | 0.55% |  |
Top three noisy pixels from each quadrant. If the there are fewer than three noisy pixels in the level2.evt file, extra rows are filled as -1
| Pixel properties | Quadrant properties | ||||||
|---|---|---|---|---|---|---|---|
| Quadrant | DetID | PixID | Counts | Sigma | Mean | Median | Sigma |
| A | 8 | 15 | 80285 | 437.48 | 883 | 862 | 181.5 |
| A | 13 | 251 | 24949 | 132.68 | 883 | 862 | 181.5 |
| A | 0 | 226 | 8493 | 42.03 | 883 | 862 | 181.5 |
| B | 4 | 48 | 183829 | 1075.93 | 883 | 861 | 170.1 |
| B | 4 | 172 | 71868 | 417.55 | 883 | 861 | 170.1 |
| B | 15 | 204 | 64850 | 376.28 | 883 | 861 | 170.1 |
| C | 9 | 237 | 103359 | 512.92 | 855 | 853 | 199.8 |
| C | 13 | 61 | 6735 | 29.43 | 855 | 853 | 199.8 |
| C | 8 | 128 | 6032 | 25.91 | 855 | 853 | 199.8 |
| D | 2 | 33 | 231875 | 1094.96 | 854 | 826 | 211.0 |
| D | 14 | 34 | 130922 | 616.54 | 854 | 826 | 211.0 |
| D | 2 | 14 | 48740 | 227.07 | 854 | 826 | 211.0 |
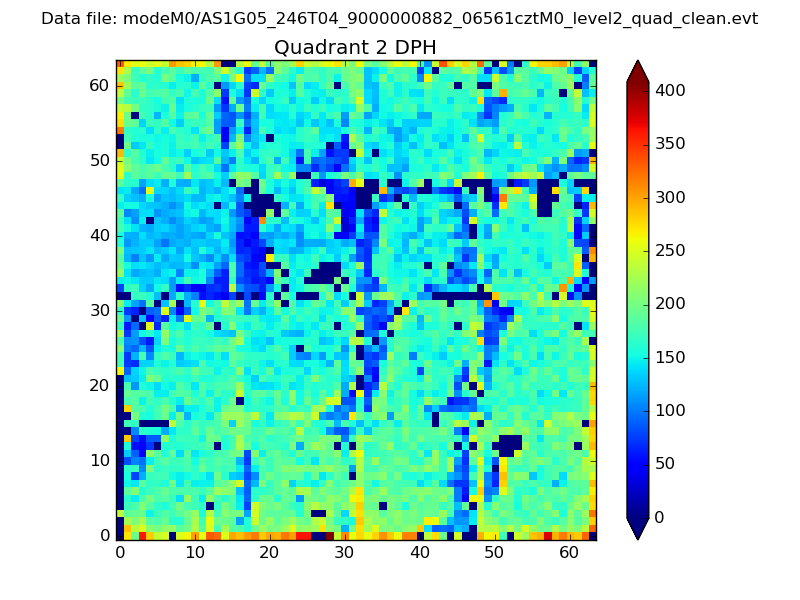
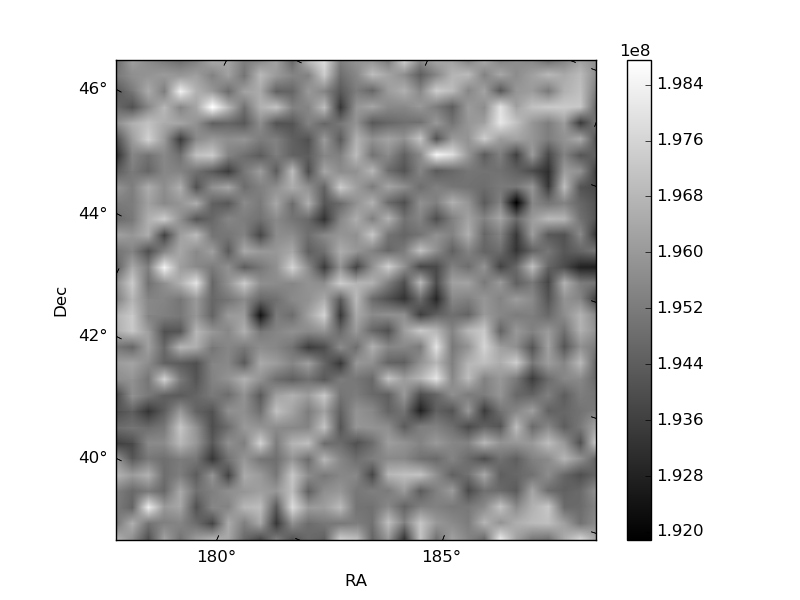
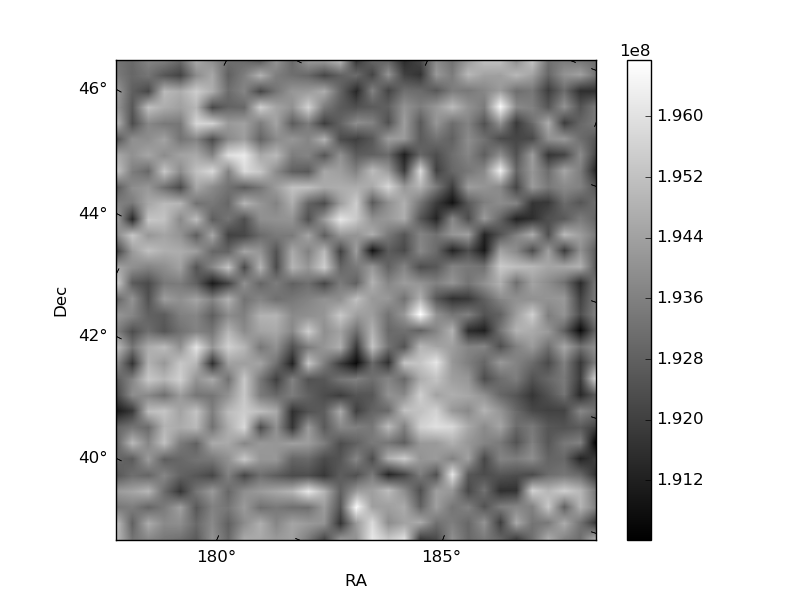
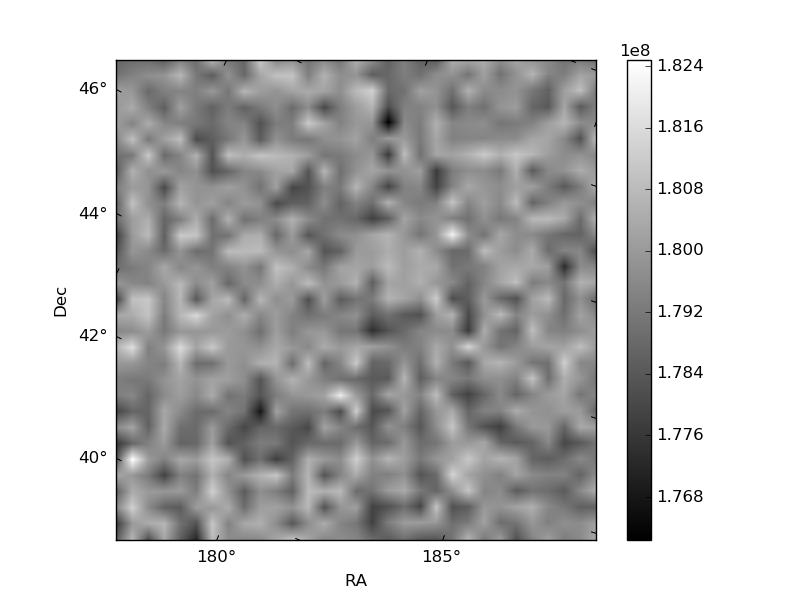
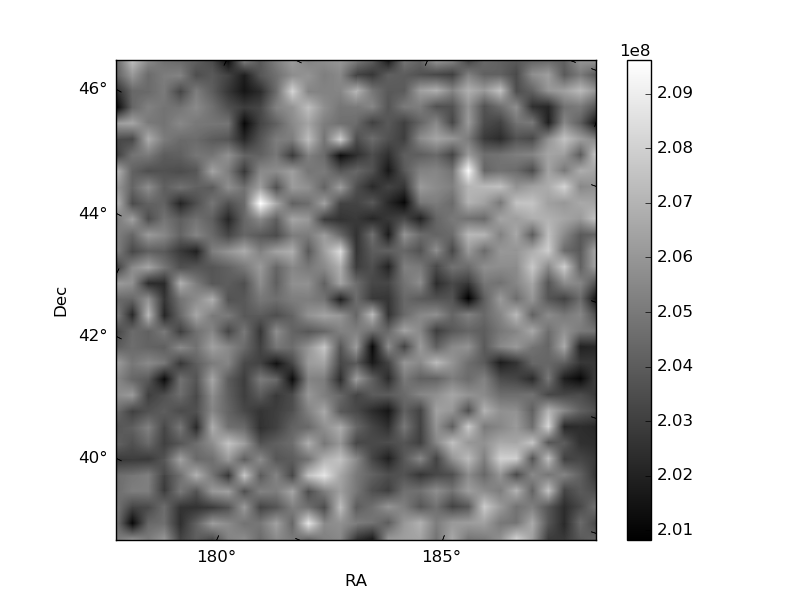
Histogram calculated using DETX and DETY for each event in the final _common_clean file
| Quadrant A | 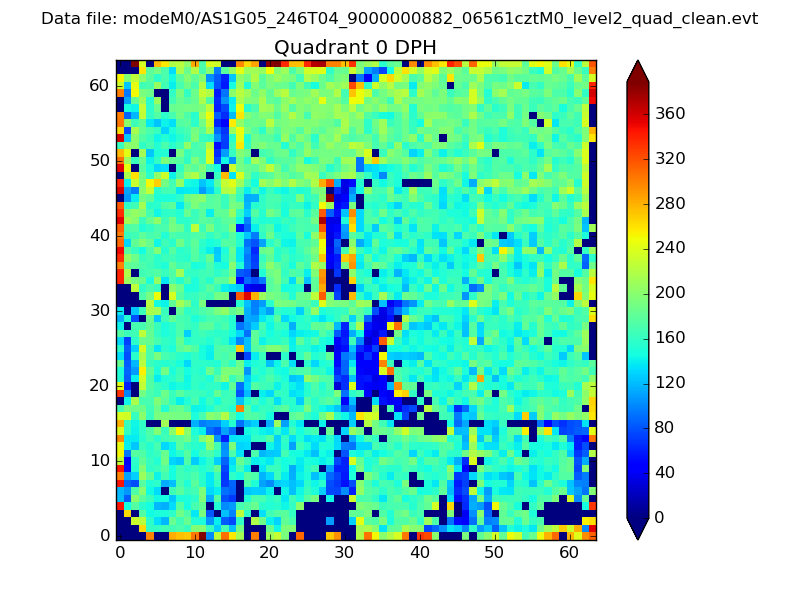 |
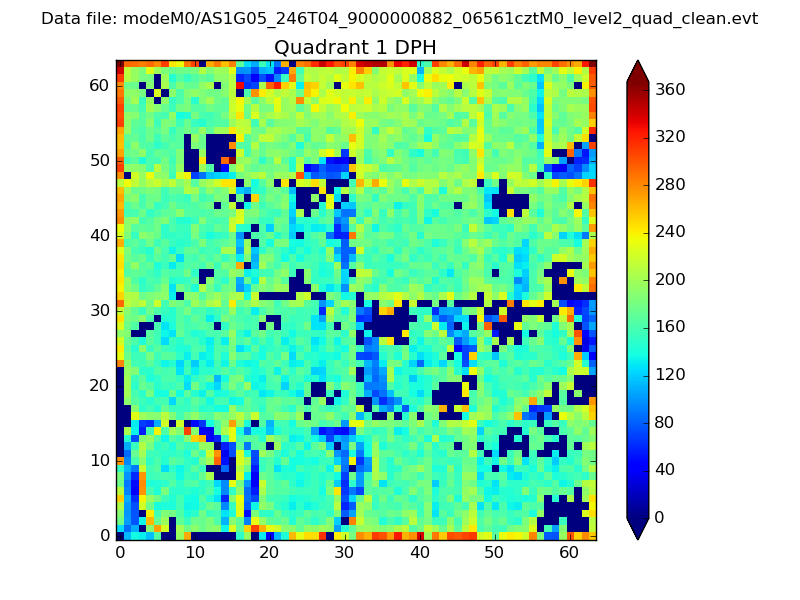 |
Quadrant B |
|---|---|---|---|
| Quadrant D | 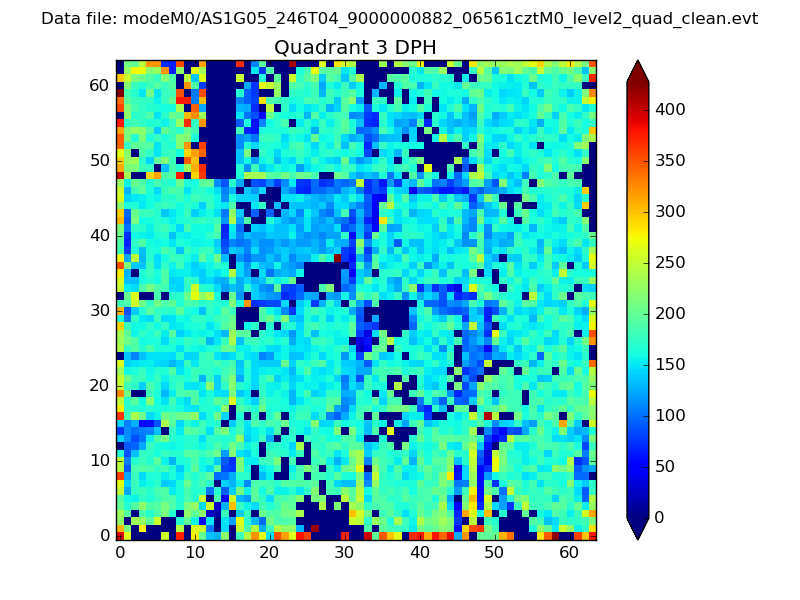 |
 |
Quadrant C |
| Plot type | Count rate plots | Images |
|---|---|---|
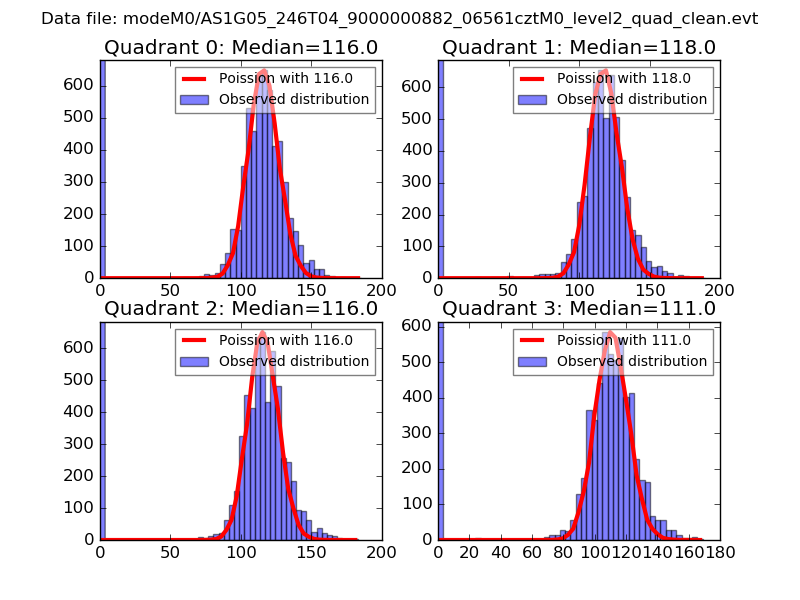
| Comparison with Poisson distribution Blue bars denote a histogram of data divided into 1 sec bins. Red curve is a Poisson curve with rate = median count rate of data. |
 |
 |
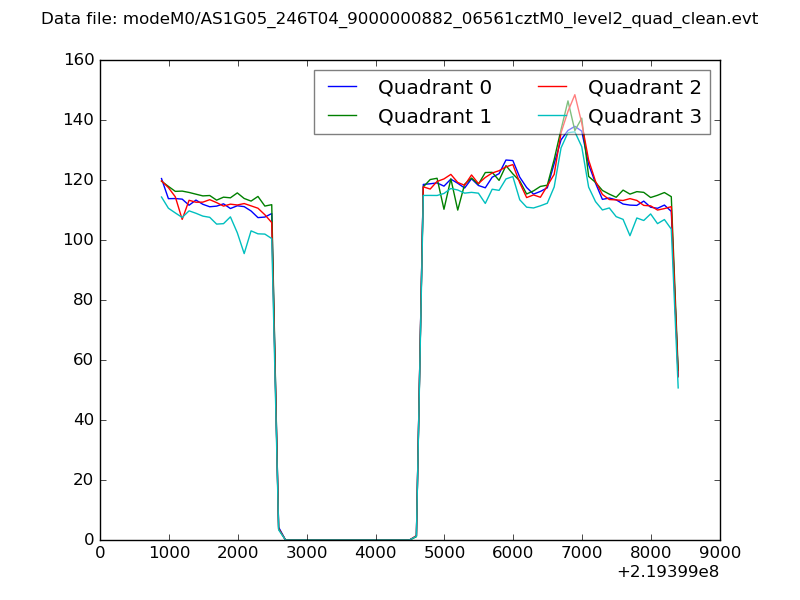
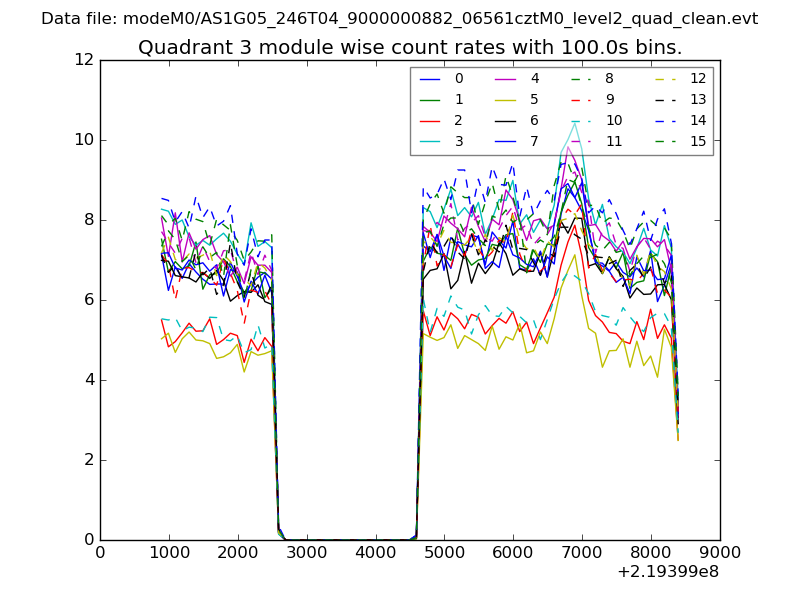
| Quadrant-wise count rates Data is divided into 100 sec bins |
 |
|
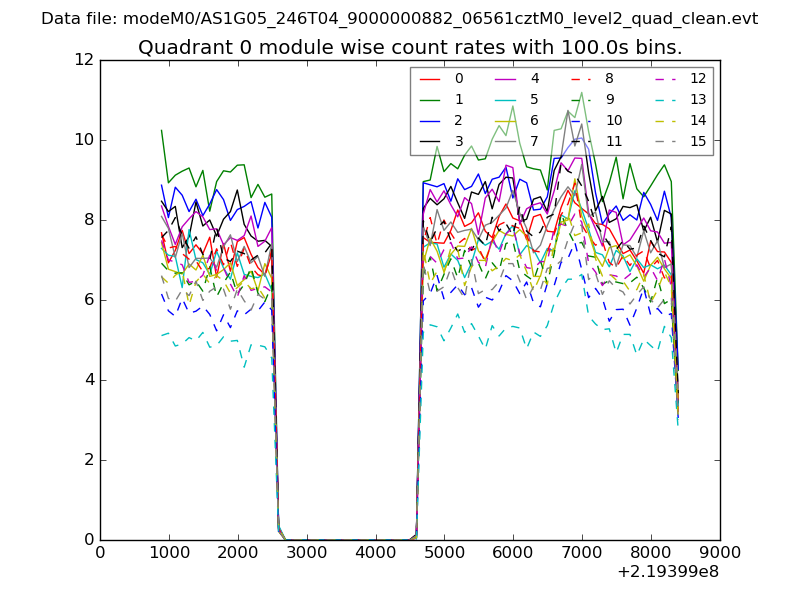
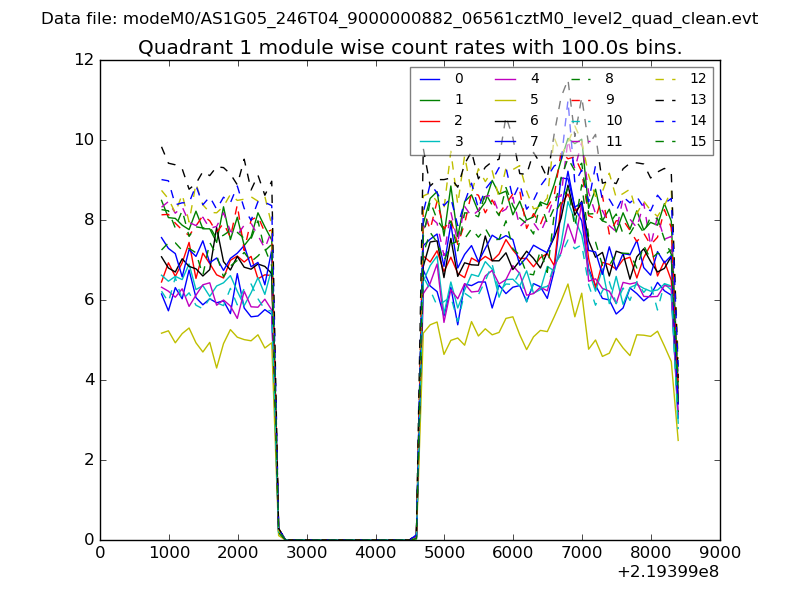
| Module-wise count rates for Quadrant A Data is divided into 100 sec bins |
 |
 |
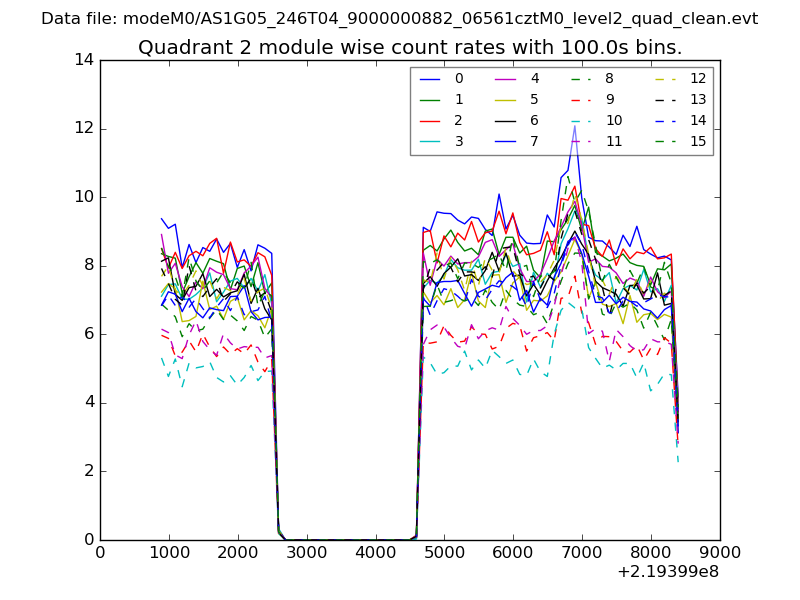
| Module-wise count rates for Quadrant B Data is divided into 100 sec bins |
 |
 |
| Module-wise count rates for Quadrant C Data is divided into 100 sec bins |
 |
 |
| Module-wise count rates for Quadrant D Data is divided into 100 sec bins |
 |
 |
| Parameter | Plot |
|---|---|
| CZT HV Monitor | 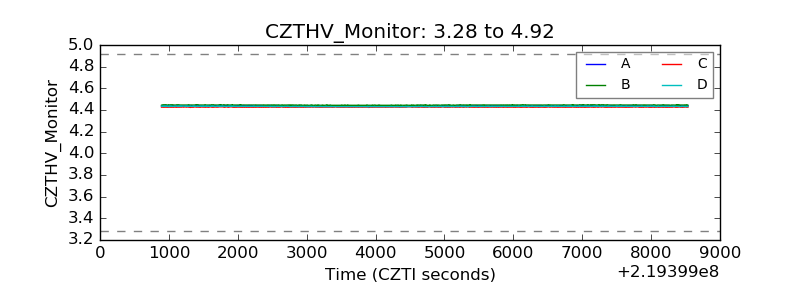 |
| D_VDD | 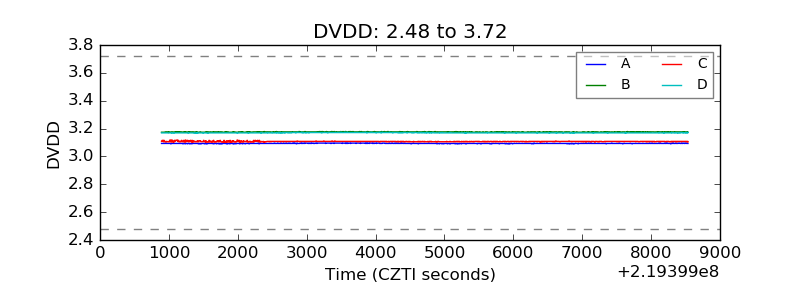 |
| Temperature 1 | 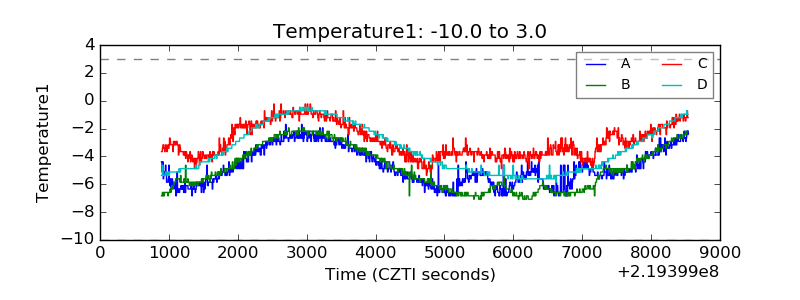 |
| Veto HV Monitor | 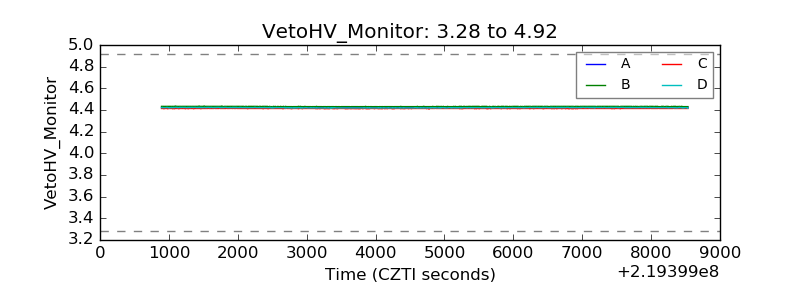 |
| Veto LLD |  |
| Alpha Counter | 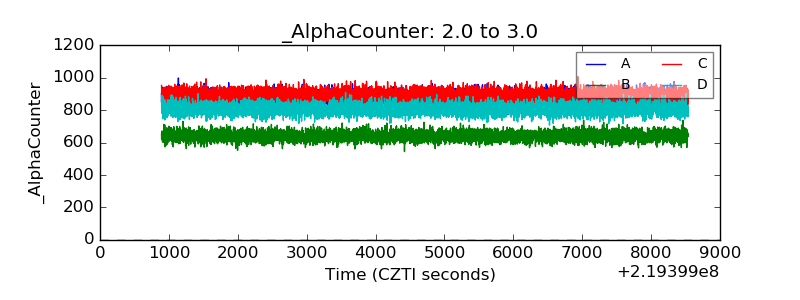 |
| _CPM_Rate | 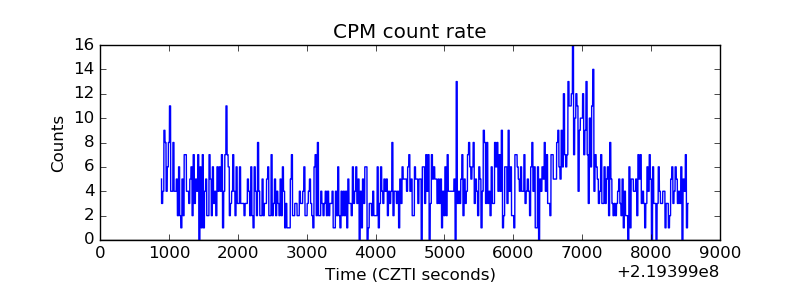 |
| CZT Counter | 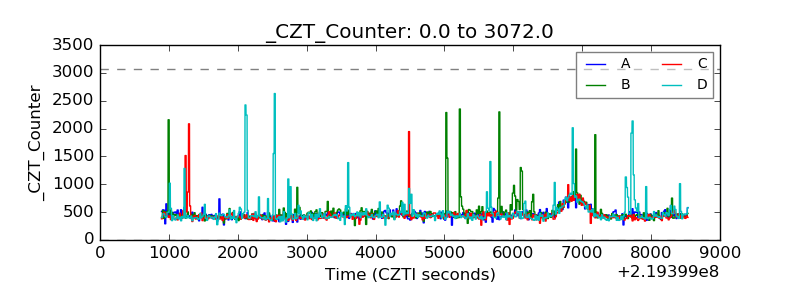 |
| +2.5 Volts monitor |  |
| +5 Volts monitor |  |
| _ROLL_ROT | 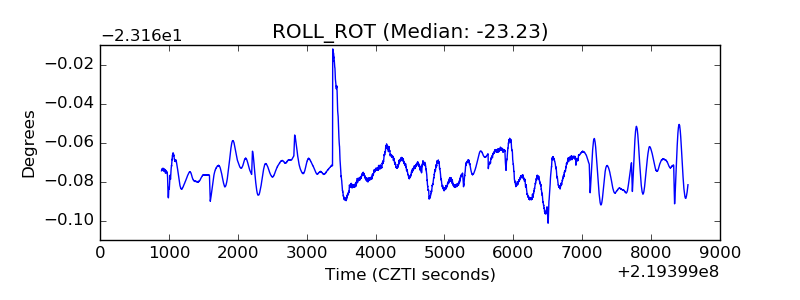 |
| _Roll_DEC | 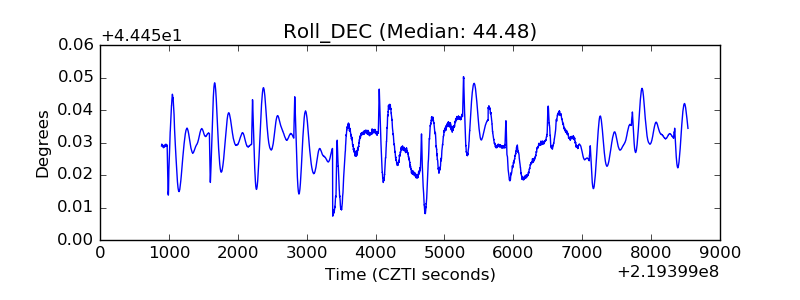 |
| _Roll_RA | 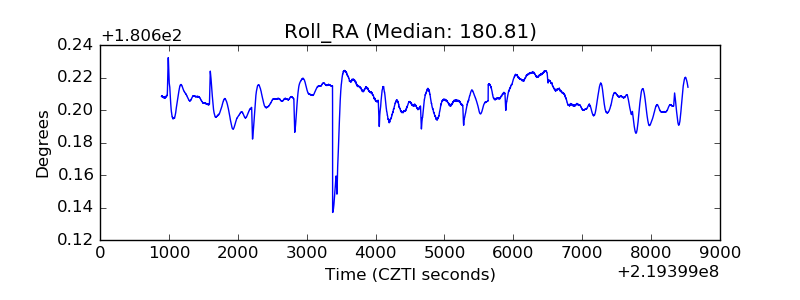 |
| Veto Counter | 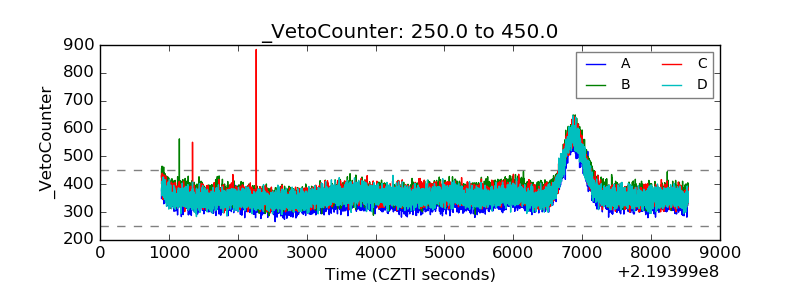 |