| Param | Original file | Final file |
|---|---|---|
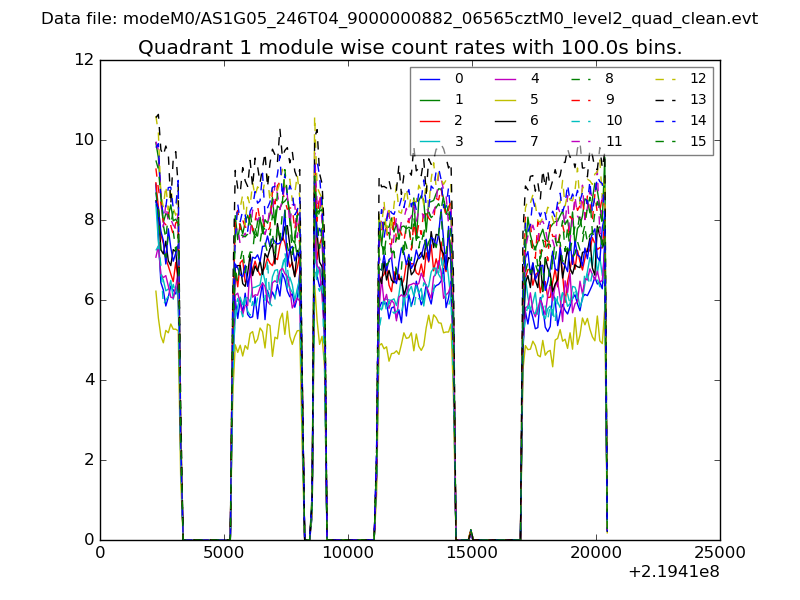
| Filename | modeM0/AS1G05_246T04_9000000882_06565cztM0_level2.evt | modeM0/AS1G05_246T04_9000000882_06565cztM0_level2_quad_clean.evt |
| Size (bytes) | 1,405,270,080 | 205,652,160 |
| Size | 1.3 GB | 196.1 MB |
| Events in quadrant A | 8,495,023 | 1,252,372 |
| Events in quadrant B | 9,137,791 | 1,265,653 |
| Events in quadrant C | 8,289,567 | 1,253,576 |
| Events in quadrant D | 15,379,668 | 1,173,695 |
| Mode M0 | |||
|---|---|---|---|
| Quadrant | BADHDUFLAG | Total packets | Discarded packets |
| A | 0 | 37954 | 5 |
| B | 0 | 39580 | 4 |
| C | 0 | 37962 | 4 |
| D | 0 | 58664 | 4 |
| Mode SS | |||
|---|---|---|---|
| Quadrant | BADHDUFLAG | Total packets | Discarded packets |
| A | 0 | 380 | 0 |
| B | 0 | 380 | 0 |
| C | 0 | 380 | 0 |
| D | 0 | 380 | 0 |
| Mode M9 | |||
|---|---|---|---|
| Quadrant | BADHDUFLAG | Total packets | Discarded packets |
| A | 0 | 18 | 0 |
| B | 0 | 18 | 0 |
| C | 0 | 18 | 0 |
| D | 0 | 18 | 0 |
| Quadrant | Total seconds | Saturated seconds | Saturation percentage |
|---|---|---|---|
| A | 18608 | 216 | 1.160791% |
| B | 18608 | 292 | 1.569218% |
| C | 18608 | 173 | 0.929708% |
| D | 18608 | 870 | 4.675408% |
Noise dominated data is calculated using 1-second bins in cleaned event files. If a bin has >2000 counts, and if more than 50% of those come from <1% of pixels, then it is considered to be noise-dominated and hence unusable.
| Quadrant | # 1 sec bins | Bins with >0 counts | Bins with >2000 counts | High rate bins dominated by noise | Noise dominated (total time) | Noise dominated (detector-on time) | Marked lightcurve |
|---|---|---|---|---|---|---|---|
| A | 20518 | 18611 | 0 | 0 | 0.00% | 0.00% | 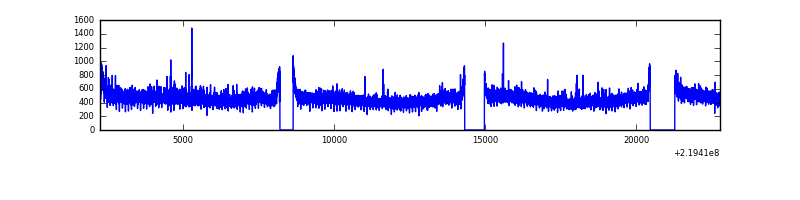 |
| B | 20518 | 18611 | 35 | 35 | 0.17% | 0.19% | 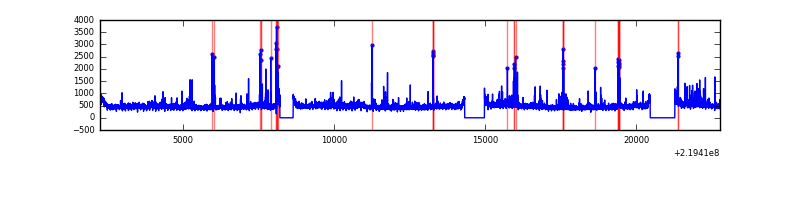 |
| C | 20518 | 18611 | 0 | 0 | 0.00% | 0.00% | 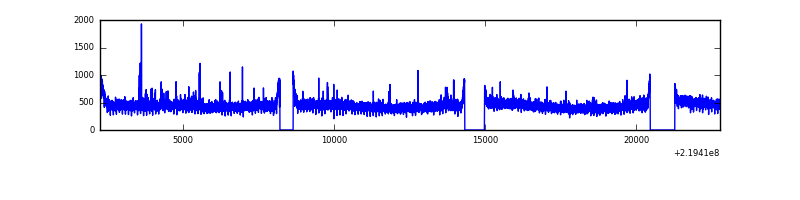 |
| D | 20518 | 18611 | 422 | 422 | 2.06% | 2.27% | 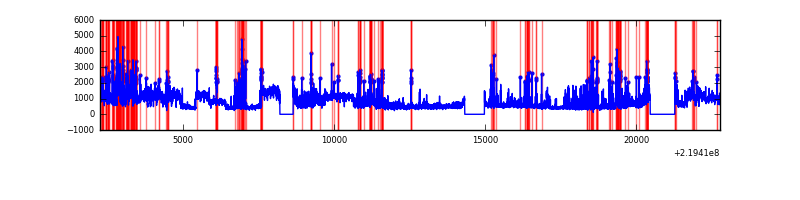 |
Top three noisy pixels from each quadrant. If the there are fewer than three noisy pixels in the level2.evt file, extra rows are filled as -1
| Pixel properties | Quadrant properties | ||||||
|---|---|---|---|---|---|---|---|
| Quadrant | DetID | PixID | Counts | Sigma | Mean | Median | Sigma |
| A | 8 | 15 | 168681 | 379.51 | 2152 | 2099 | 438.9 |
| A | 15 | 222 | 33839 | 72.31 | 2152 | 2099 | 438.9 |
| A | 0 | 226 | 20412 | 41.72 | 2152 | 2099 | 438.9 |
| B | 4 | 81 | 127811 | 304.45 | 2163 | 2115 | 412.9 |
| B | 15 | 204 | 109910 | 261.09 | 2163 | 2115 | 412.9 |
| B | 0 | 219 | 108338 | 257.28 | 2163 | 2115 | 412.9 |
| C | 9 | 237 | 69154 | 138.46 | 2092 | 2101 | 484.3 |
| C | 13 | 61 | 16622 | 29.98 | 2092 | 2101 | 484.3 |
| C | 8 | 128 | 16512 | 29.76 | 2092 | 2101 | 484.3 |
| D | 12 | 221 | 5391676 | 10617.44 | 2064 | 1998 | 507.6 |
| D | 14 | 34 | 939332 | 1846.51 | 2064 | 1998 | 507.6 |
| D | 2 | 33 | 514256 | 1009.13 | 2064 | 1998 | 507.6 |
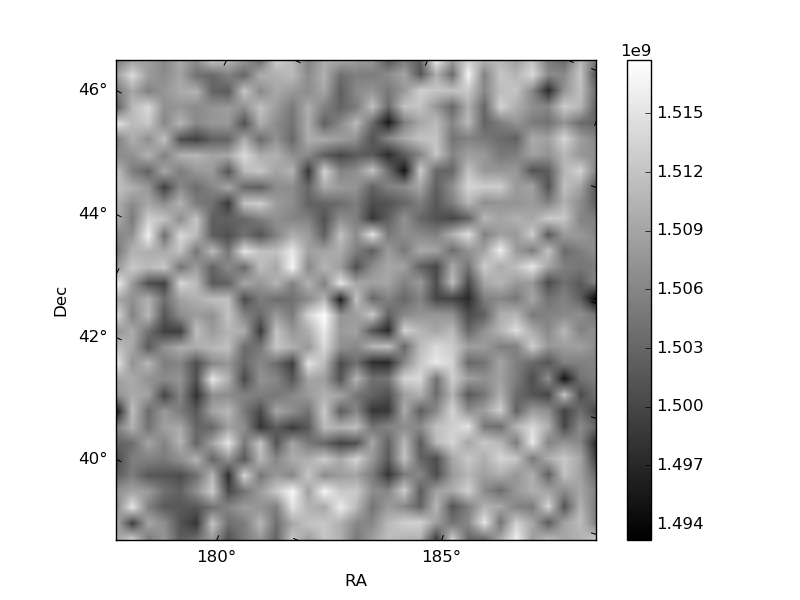
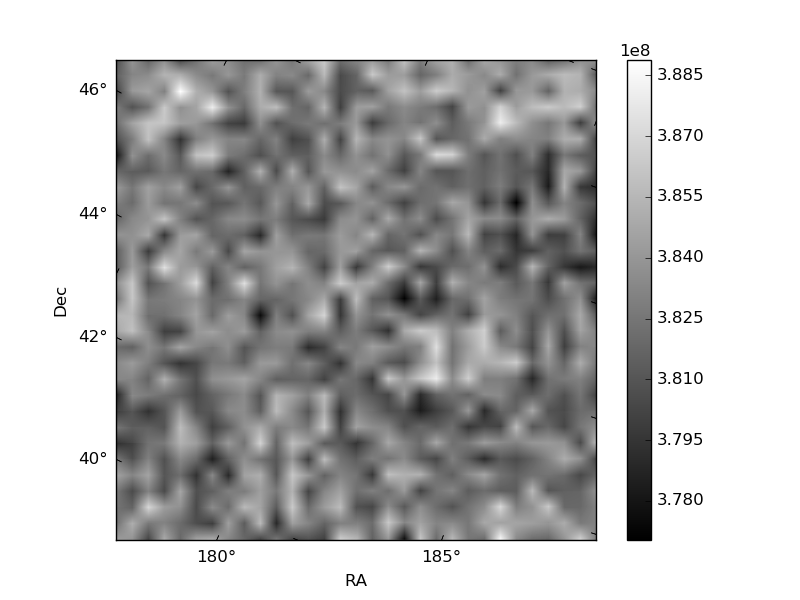
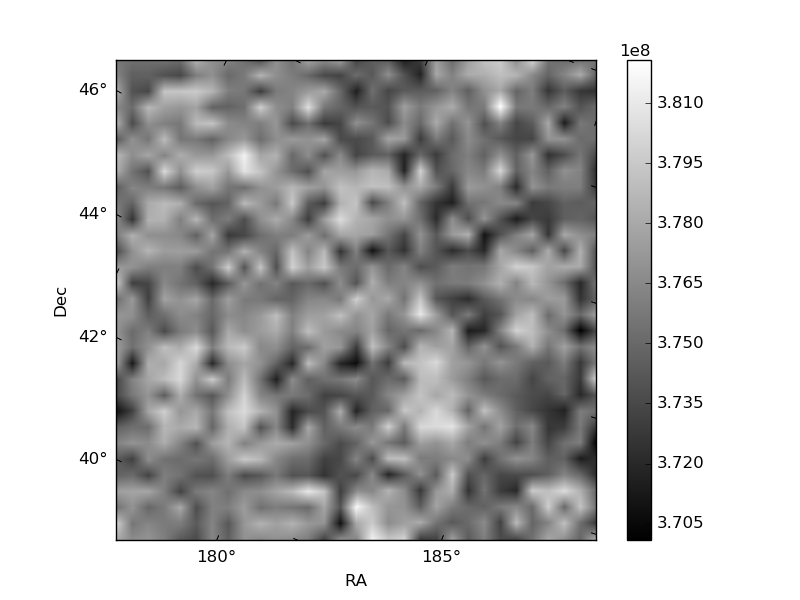
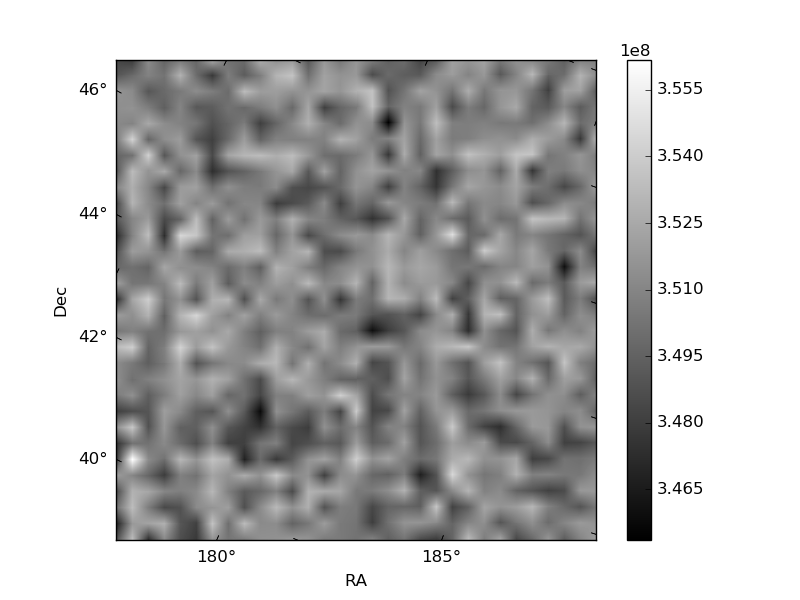
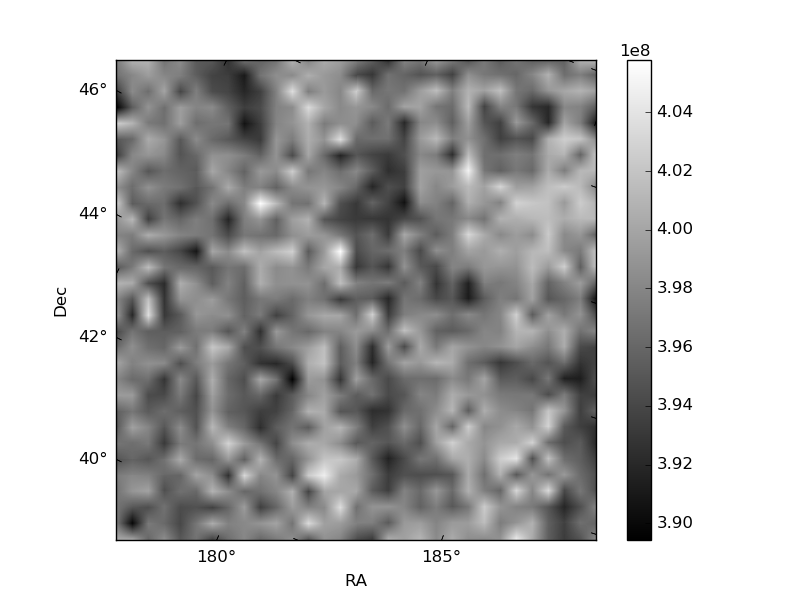
Histogram calculated using DETX and DETY for each event in the final _common_clean file
| Quadrant A | 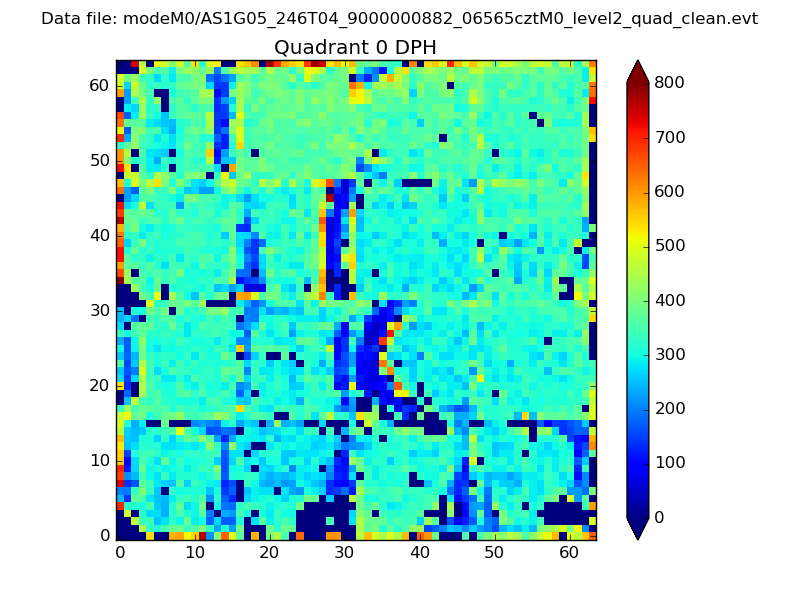 |
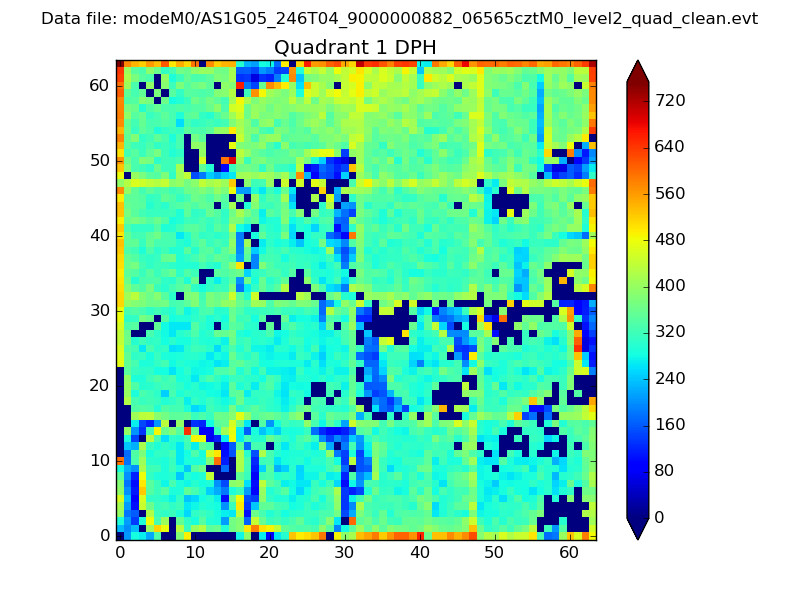 |
Quadrant B |
|---|---|---|---|
| Quadrant D | 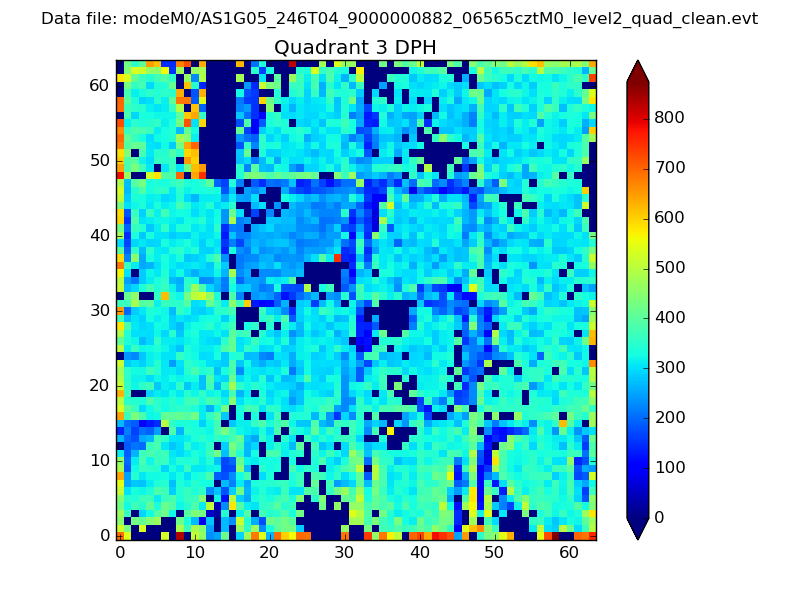 |
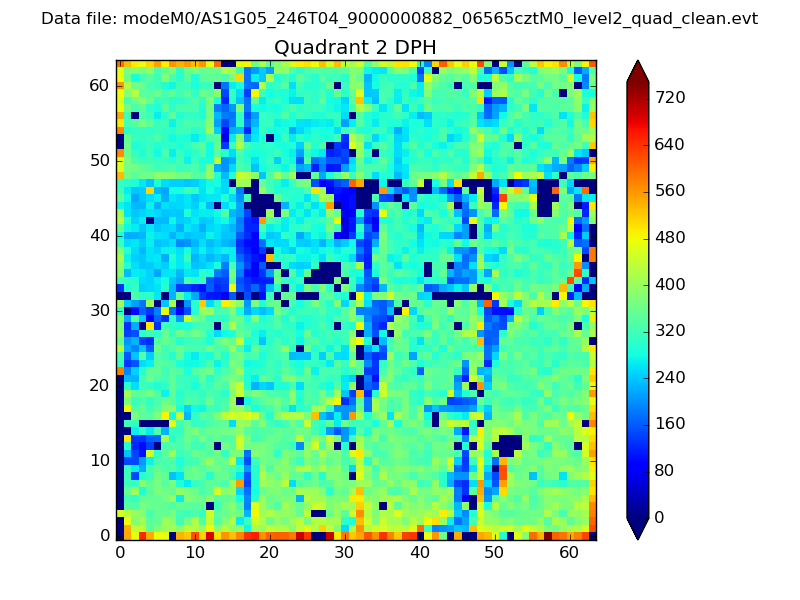 |
Quadrant C |
| Plot type | Count rate plots | Images |
|---|---|---|
| Comparison with Poisson distribution Blue bars denote a histogram of data divided into 1 sec bins. Red curve is a Poisson curve with rate = median count rate of data. |
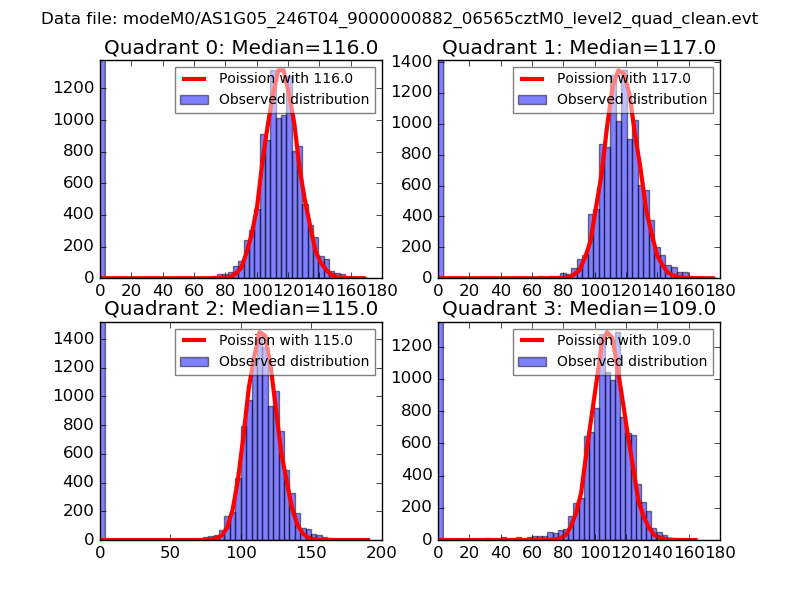 |
 |
| Quadrant-wise count rates Data is divided into 100 sec bins |
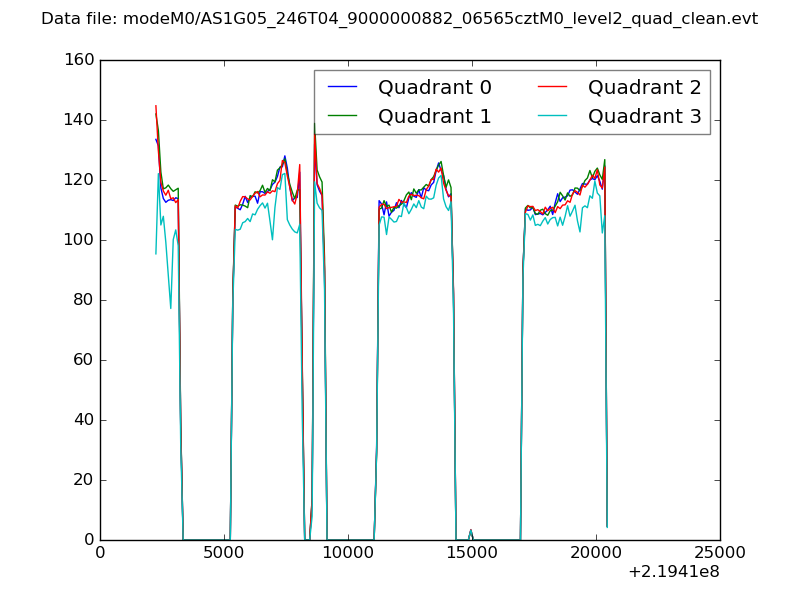 |
|
| Module-wise count rates for Quadrant A Data is divided into 100 sec bins |
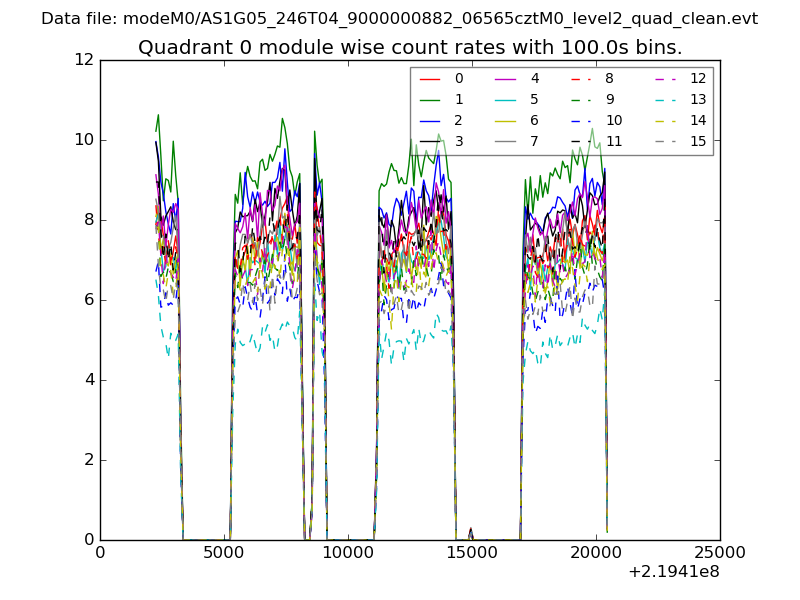 |
 |
| Module-wise count rates for Quadrant B Data is divided into 100 sec bins |
 |
 |
| Module-wise count rates for Quadrant C Data is divided into 100 sec bins |
 |
 |
| Module-wise count rates for Quadrant D Data is divided into 100 sec bins |
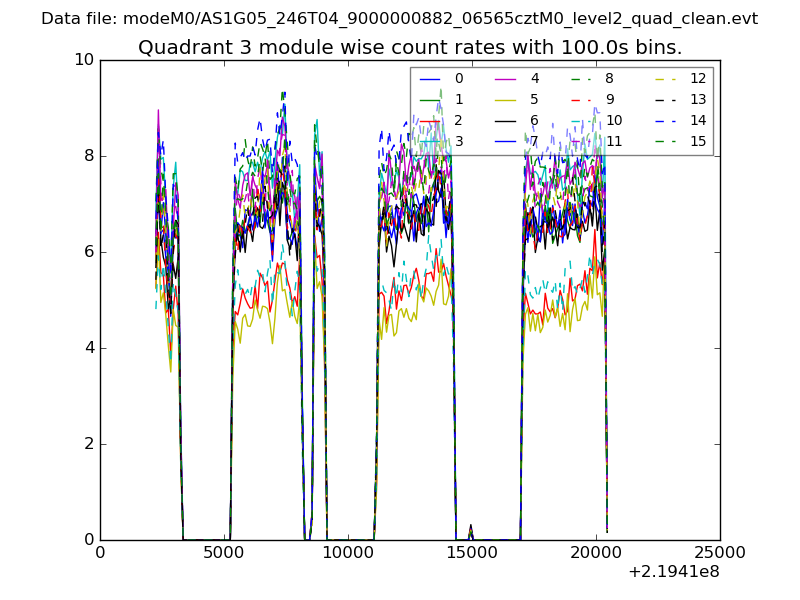 |
 |
| Parameter | Plot |
|---|---|
| CZT HV Monitor | 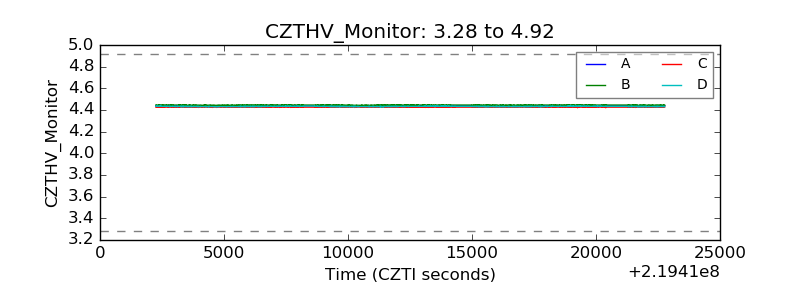 |
| D_VDD | 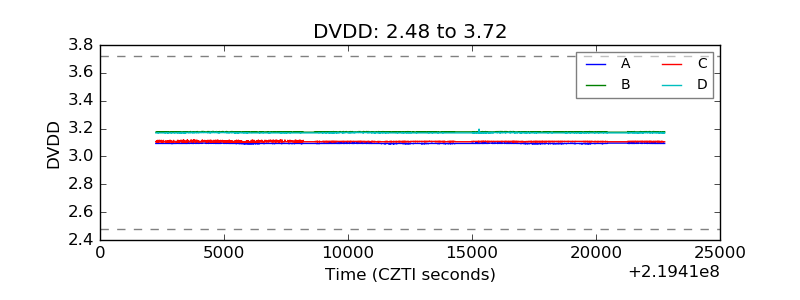 |
| Temperature 1 | 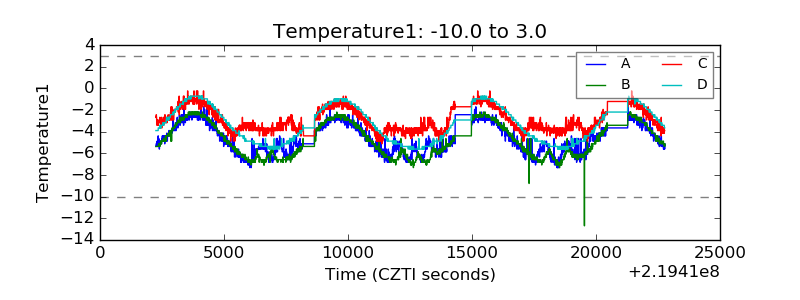 |
| Veto HV Monitor | 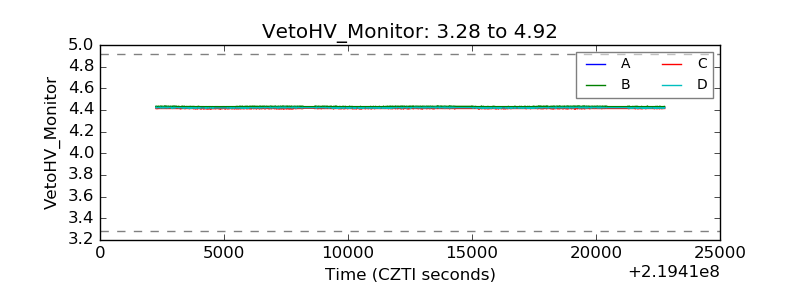 |
| Veto LLD | 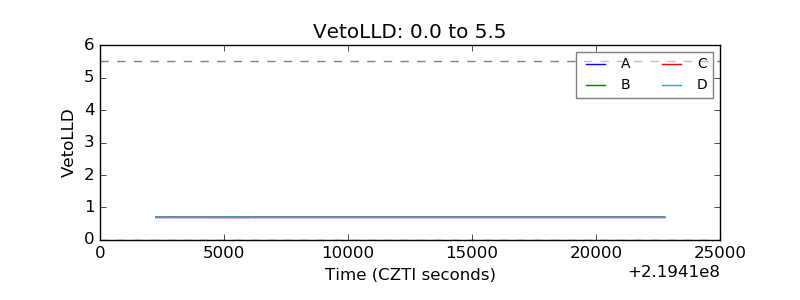 |
| Alpha Counter | 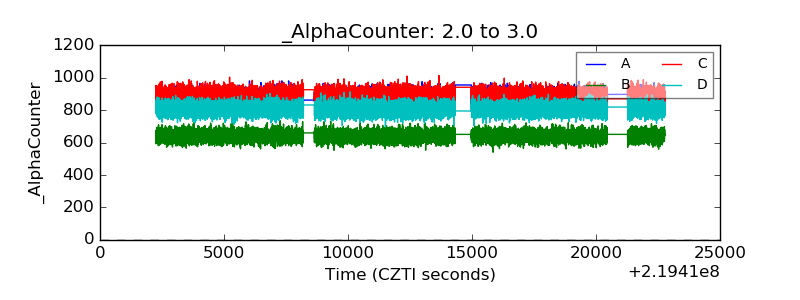 |
| _CPM_Rate | 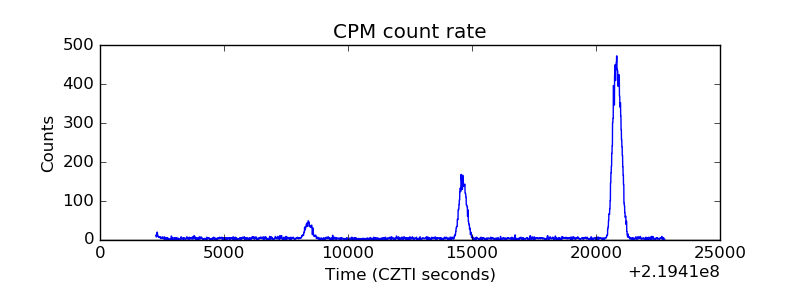 |
| CZT Counter | 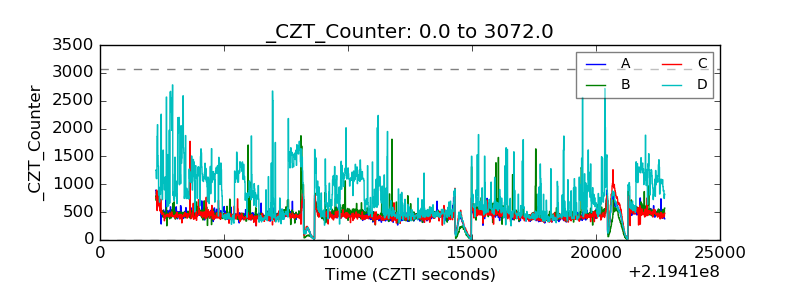 |
| +2.5 Volts monitor |  |
| +5 Volts monitor | 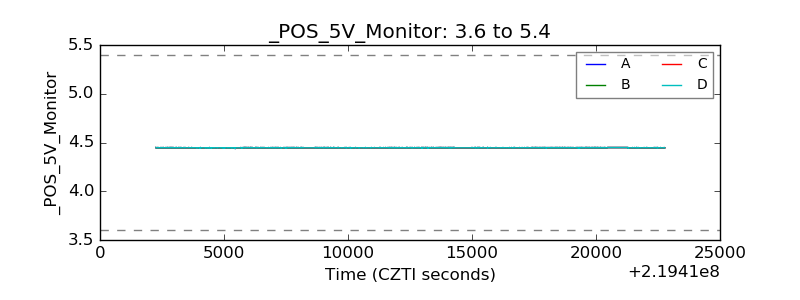 |
| _ROLL_ROT | 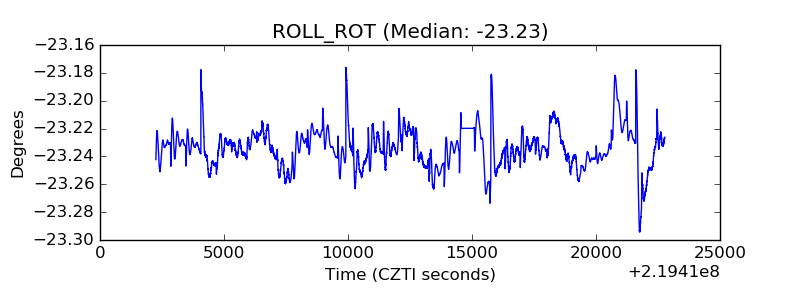 |
| _Roll_DEC | 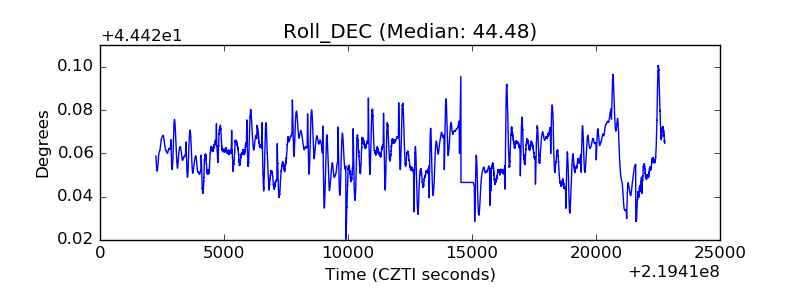 |
| _Roll_RA | 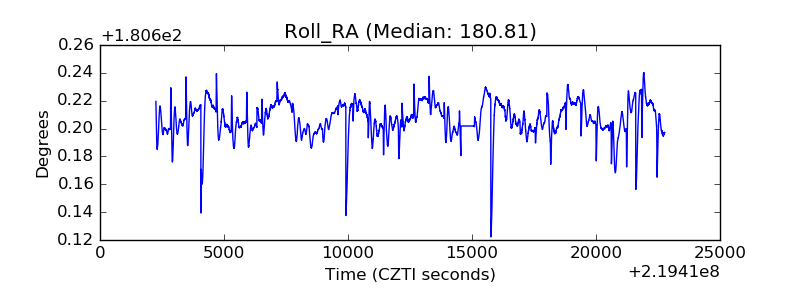 |
| Veto Counter | 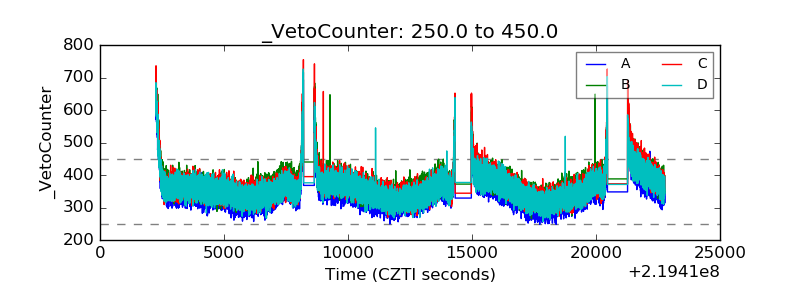 |