| Param | Original file | Final file |
|---|---|---|
| Filename | modeM0/AS1G05_246T04_9000000882_06568cztM0_level2.evt | modeM0/AS1G05_246T04_9000000882_06568cztM0_level2_quad_clean.evt |
| Size (bytes) | 457,231,680 | 80,746,560 |
| Size | 436.1 MB | 77.0 MB |
| Events in quadrant A | 2,954,316 | 500,257 |
| Events in quadrant B | 3,311,258 | 505,664 |
| Events in quadrant C | 2,971,877 | 505,012 |
| Events in quadrant D | 4,172,797 | 485,290 |
| Mode M0 | |||
|---|---|---|---|
| Quadrant | BADHDUFLAG | Total packets | Discarded packets |
| A | 0 | 13269 | 3 |
| B | 0 | 14247 | 2 |
| C | 0 | 13345 | 2 |
| D | 0 | 16799 | 2 |
| Mode SS | |||
|---|---|---|---|
| Quadrant | BADHDUFLAG | Total packets | Discarded packets |
| A | 0 | 132 | 0 |
| B | 0 | 132 | 0 |
| C | 0 | 132 | 0 |
| D | 0 | 132 | 0 |
| Mode M9 | |||
|---|---|---|---|
| Quadrant | BADHDUFLAG | Total packets | Discarded packets |
| A | 0 | 11 | 0 |
| B | 0 | 11 | 0 |
| C | 0 | 11 | 0 |
| D | 0 | 11 | 0 |
| Quadrant | Total seconds | Saturated seconds | Saturation percentage |
|---|---|---|---|
| A | 6429 | 19 | 0.295536% |
| B | 6429 | 112 | 1.742106% |
| C | 6429 | 16 | 0.248872% |
| D | 6430 | 92 | 1.430793% |
Noise dominated data is calculated using 1-second bins in cleaned event files. If a bin has >2000 counts, and if more than 50% of those come from <1% of pixels, then it is considered to be noise-dominated and hence unusable.
| Quadrant | # 1 sec bins | Bins with >0 counts | Bins with >2000 counts | High rate bins dominated by noise | Noise dominated (total time) | Noise dominated (detector-on time) | Marked lightcurve |
|---|---|---|---|---|---|---|---|
| A | 7569 | 6430 | 0 | 0 | 0.00% | 0.00% | 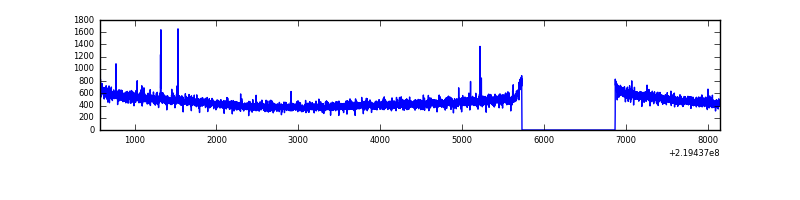 |
| B | 7569 | 6430 | 51 | 51 | 0.67% | 0.79% | 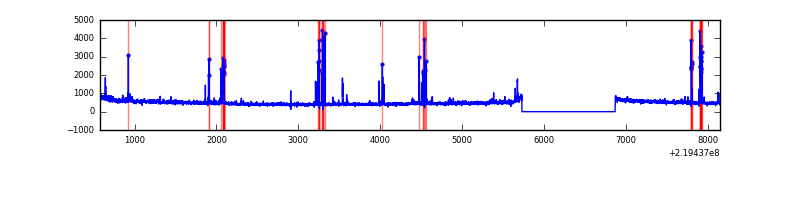 |
| C | 7569 | 6430 | 0 | 0 | 0.00% | 0.00% | 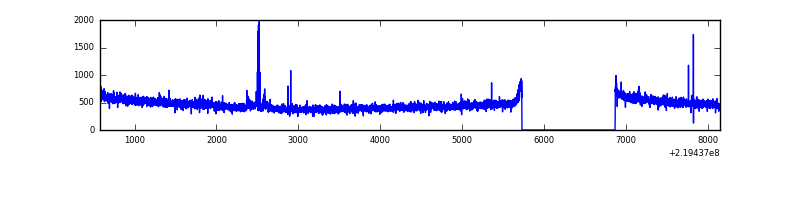 |
| D | 7570 | 6431 | 28 | 28 | 0.37% | 0.44% | 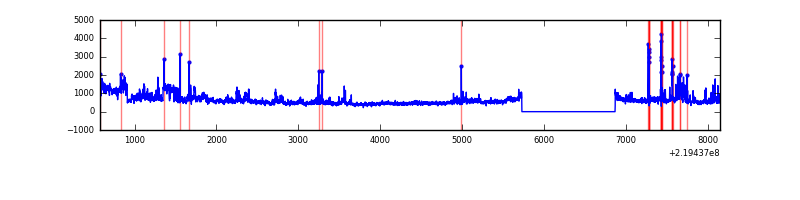 |
Top three noisy pixels from each quadrant. If the there are fewer than three noisy pixels in the level2.evt file, extra rows are filled as -1
| Pixel properties | Quadrant properties | ||||||
|---|---|---|---|---|---|---|---|
| Quadrant | DetID | PixID | Counts | Sigma | Mean | Median | Sigma |
| A | 14 | 111 | 10483 | 62.45 | 761 | 744 | 155.9 |
| A | 8 | 15 | 9199 | 54.22 | 761 | 744 | 155.9 |
| A | 0 | 226 | 7393 | 42.64 | 761 | 744 | 155.9 |
| B | 0 | 219 | 138312 | 938.06 | 768 | 750 | 146.6 |
| B | 4 | 172 | 67457 | 454.89 | 768 | 750 | 146.6 |
| B | 4 | 48 | 32185 | 214.36 | 768 | 750 | 146.6 |
| C | 10 | 22 | 41344 | 234.14 | 748 | 751 | 173.4 |
| C | 13 | 61 | 6003 | 30.29 | 748 | 751 | 173.4 |
| C | 14 | 67 | 2976 | 12.83 | 748 | 751 | 173.4 |
| D | 12 | 221 | 941167 | 5074.71 | 743 | 719 | 185.3 |
| D | 8 | 195 | 156375 | 839.93 | 743 | 719 | 185.3 |
| D | 2 | 33 | 93354 | 499.86 | 743 | 719 | 185.3 |
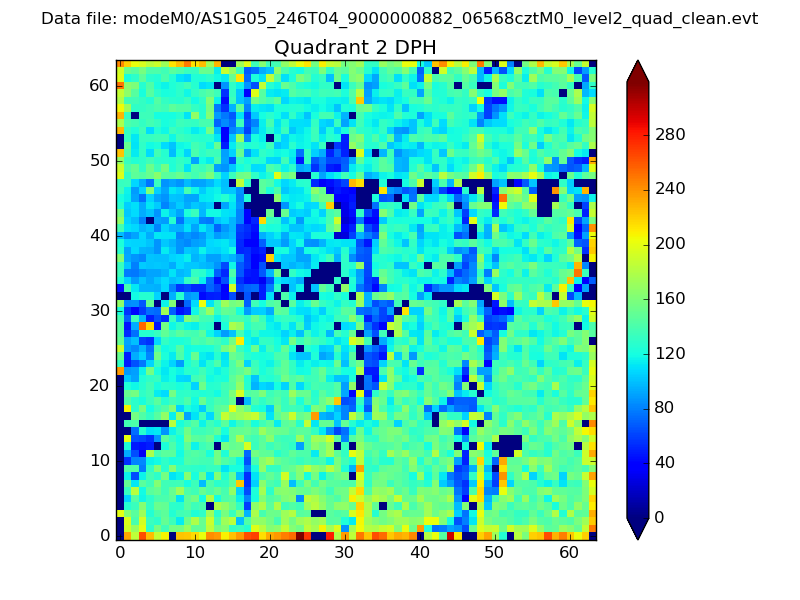
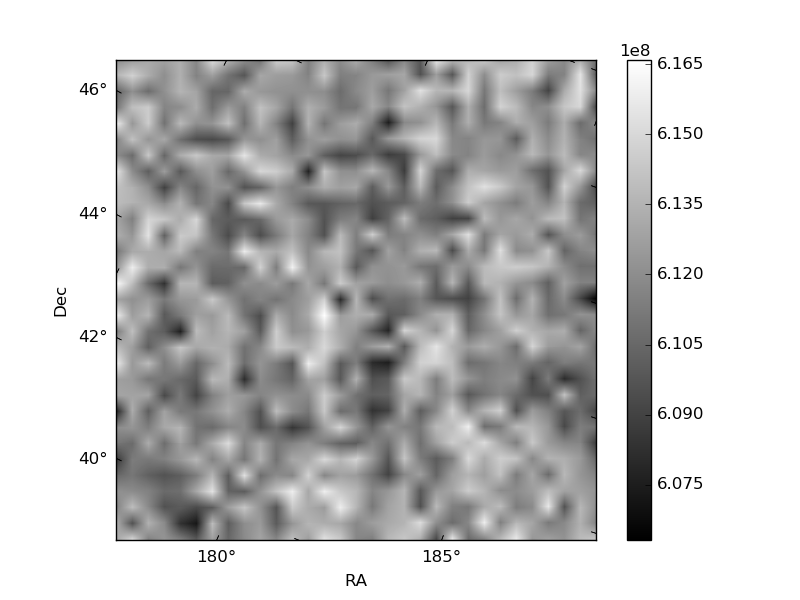
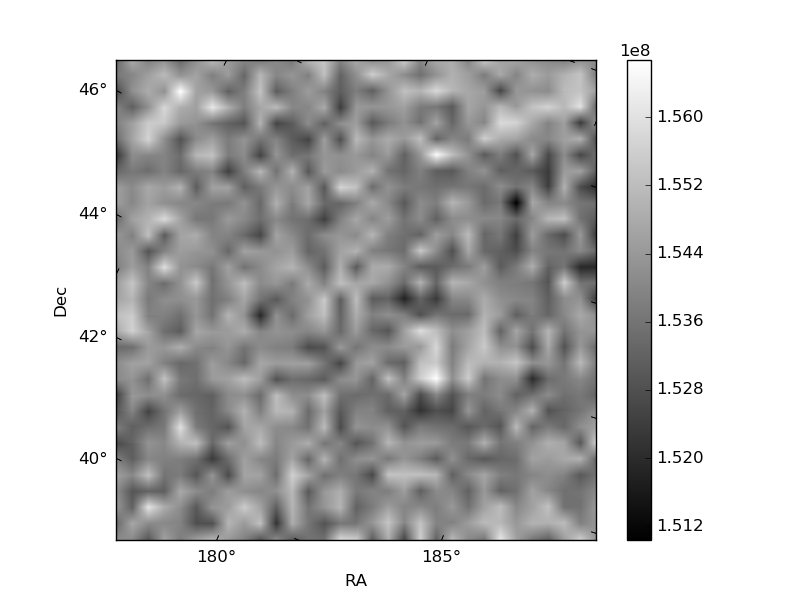
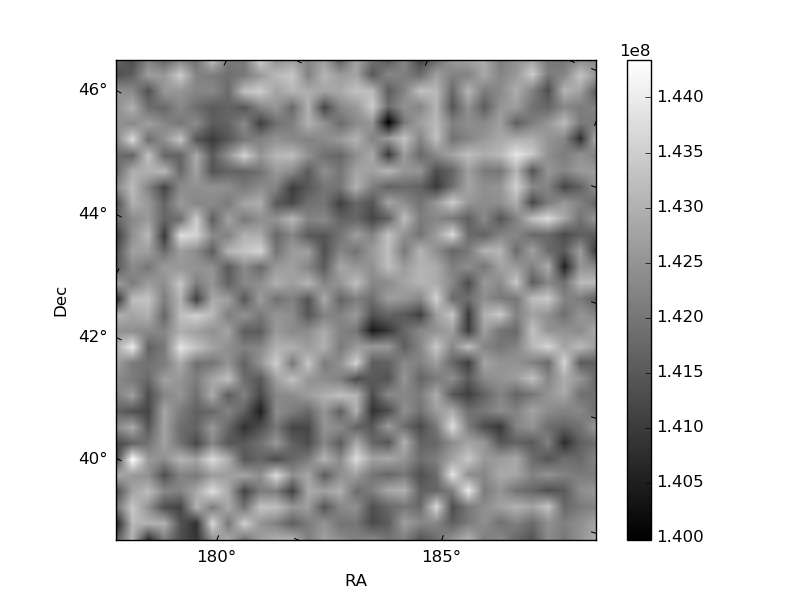
Histogram calculated using DETX and DETY for each event in the final _common_clean file
| Quadrant A | 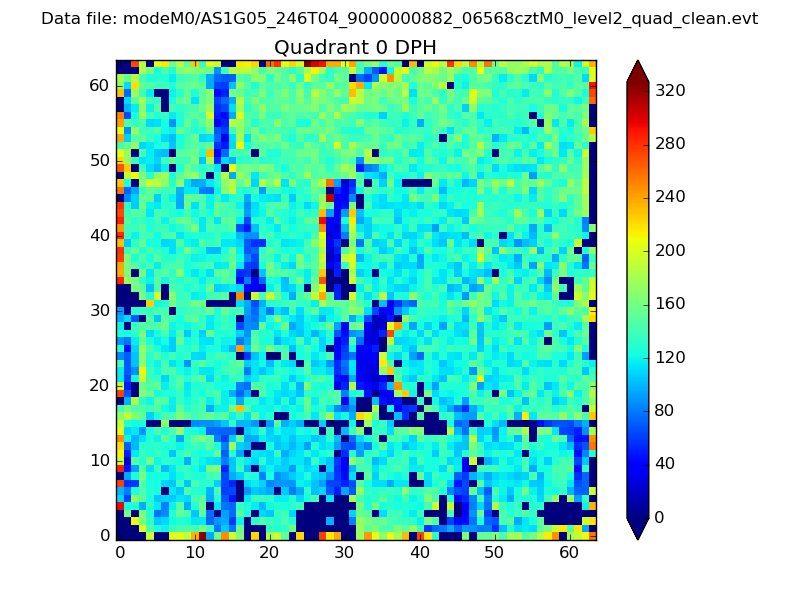 |
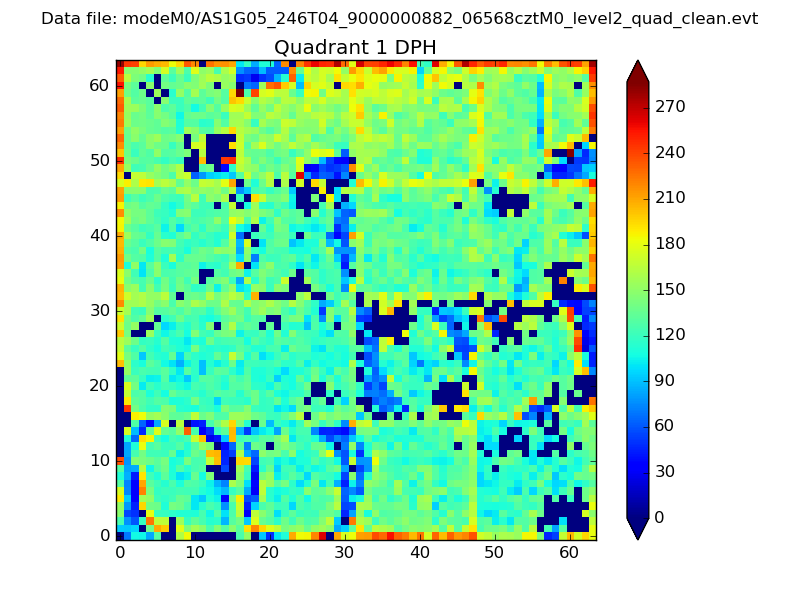 |
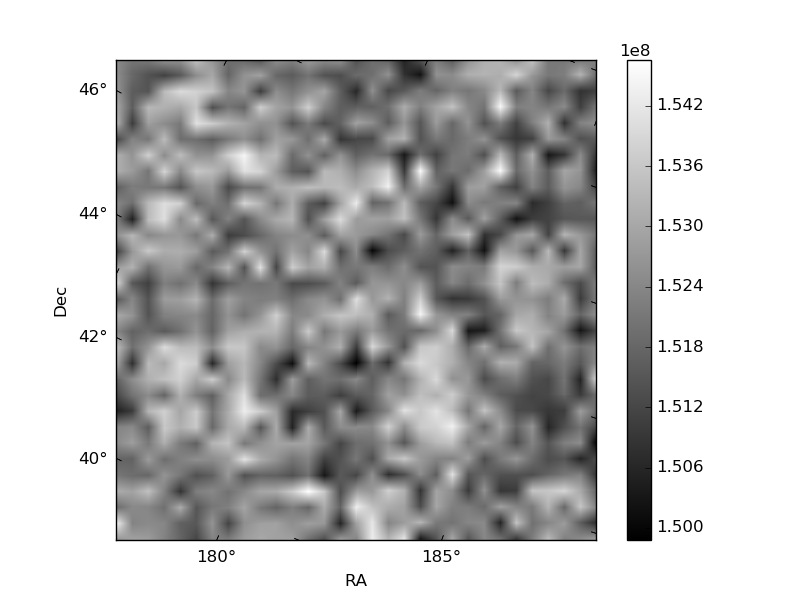
Quadrant B |
|---|---|---|---|
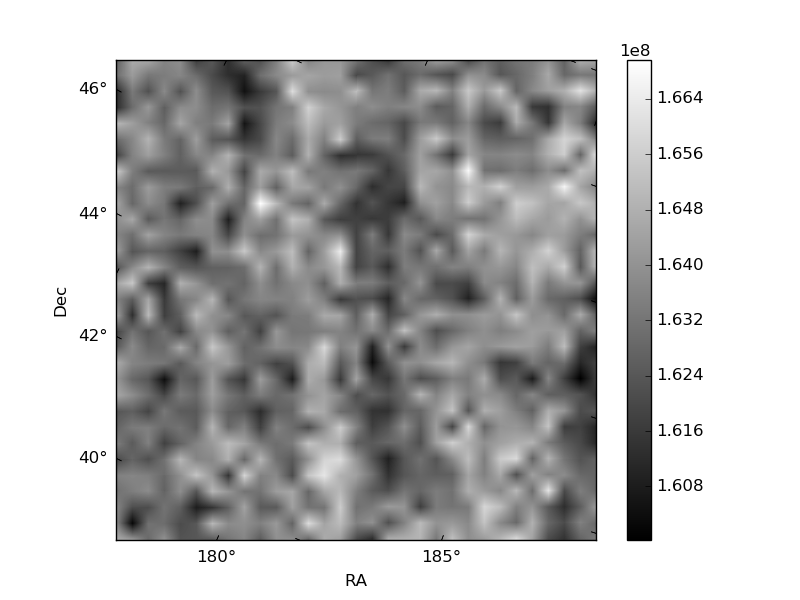
| Quadrant D | 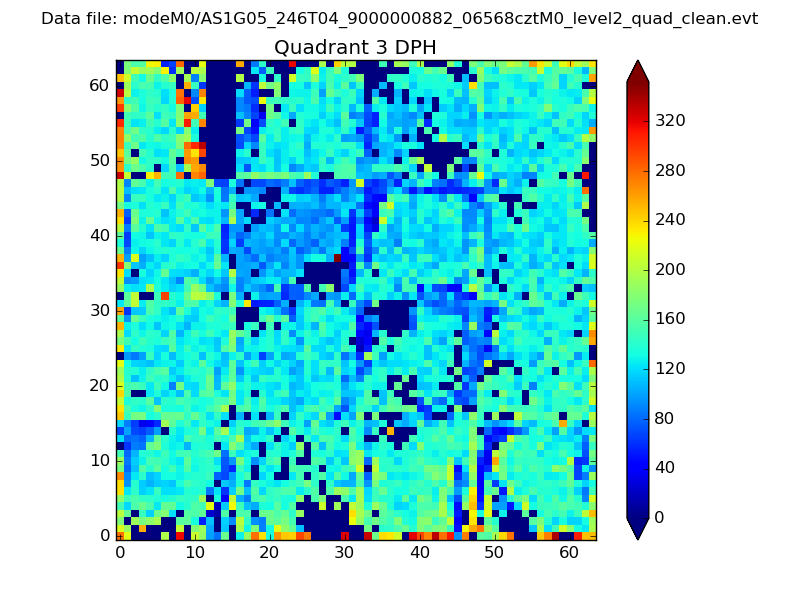 |
 |
Quadrant C |
| Plot type | Count rate plots | Images |
|---|---|---|
| Comparison with Poisson distribution Blue bars denote a histogram of data divided into 1 sec bins. Red curve is a Poisson curve with rate = median count rate of data. |
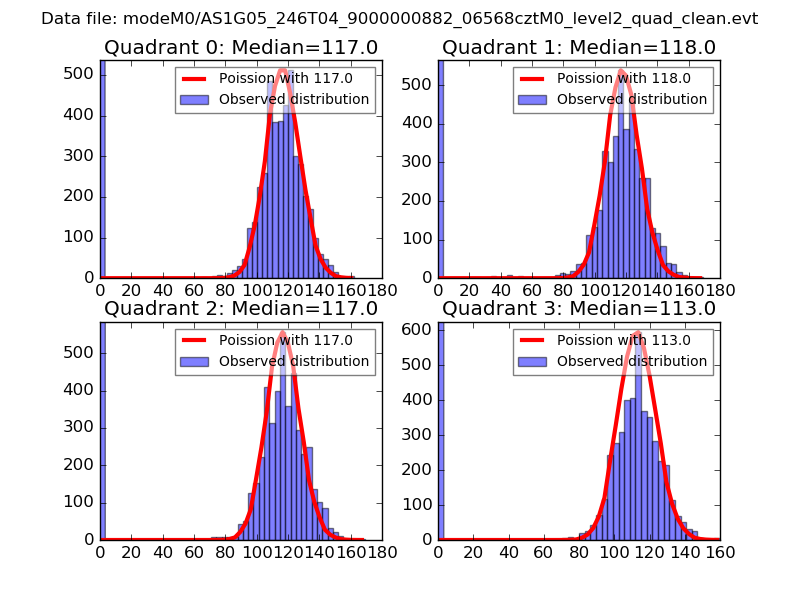 |
 |
| Quadrant-wise count rates Data is divided into 100 sec bins |
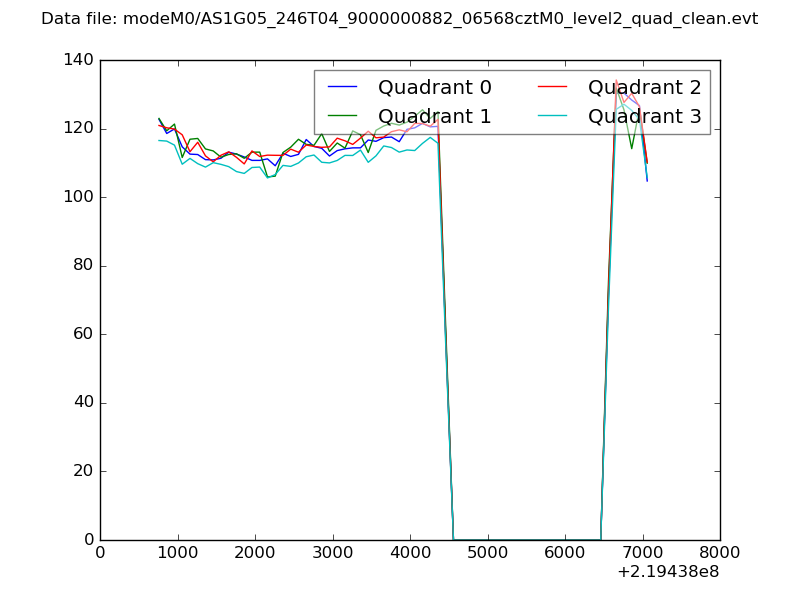 |
|
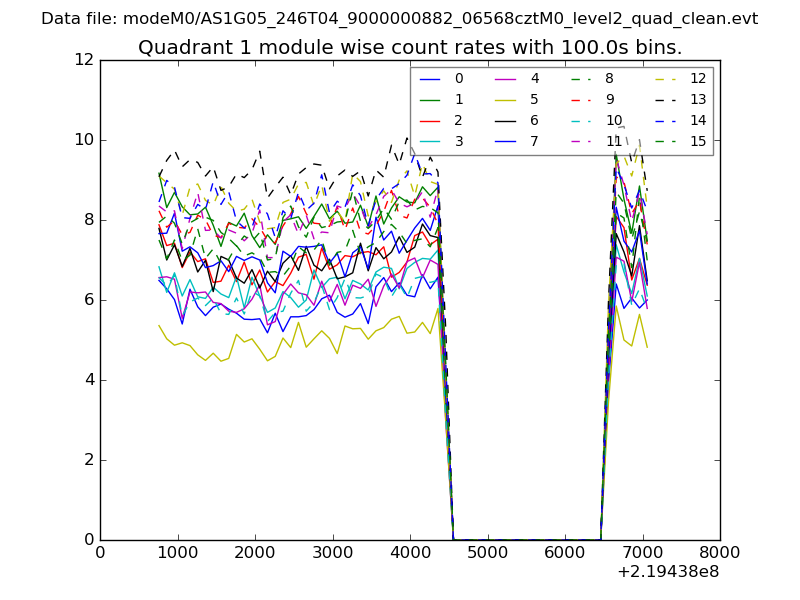
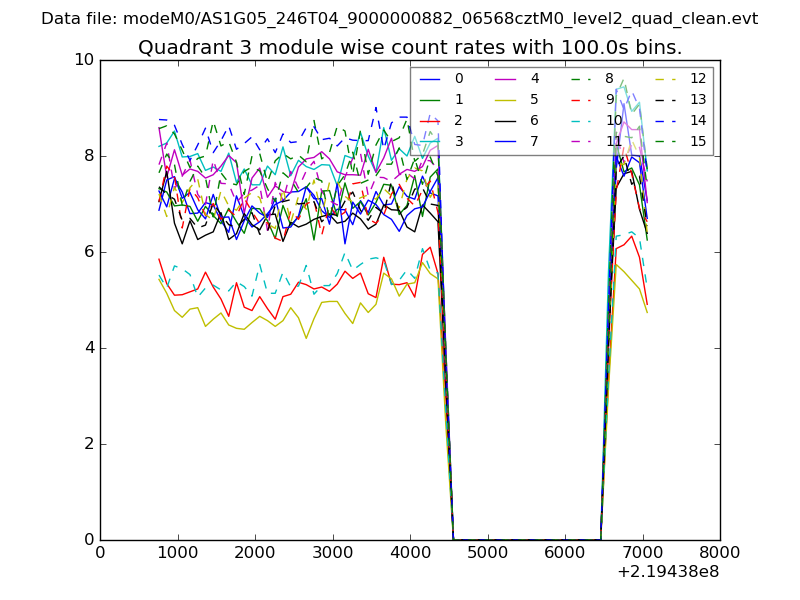
| Module-wise count rates for Quadrant A Data is divided into 100 sec bins |
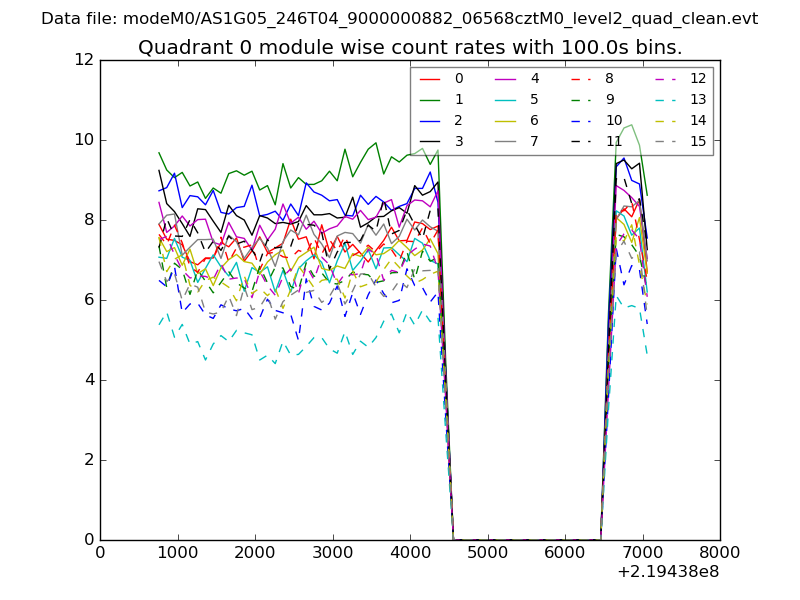 |
 |
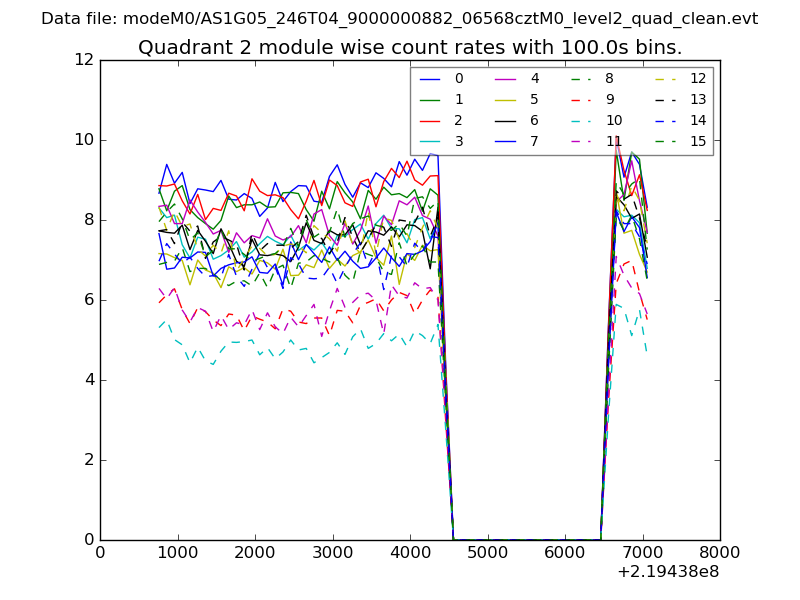
| Module-wise count rates for Quadrant B Data is divided into 100 sec bins |
 |
 |
| Module-wise count rates for Quadrant C Data is divided into 100 sec bins |
 |
 |
| Module-wise count rates for Quadrant D Data is divided into 100 sec bins |
 |
 |
| Parameter | Plot |
|---|---|
| CZT HV Monitor | 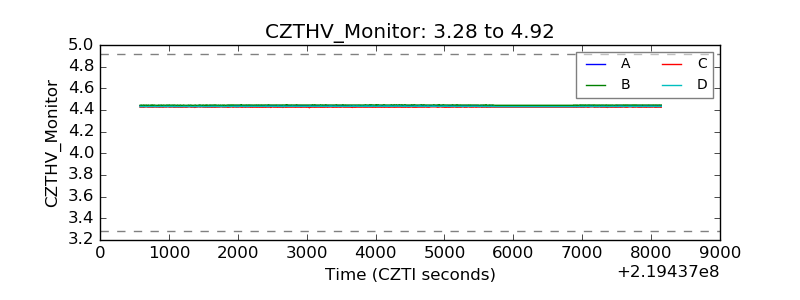 |
| D_VDD | 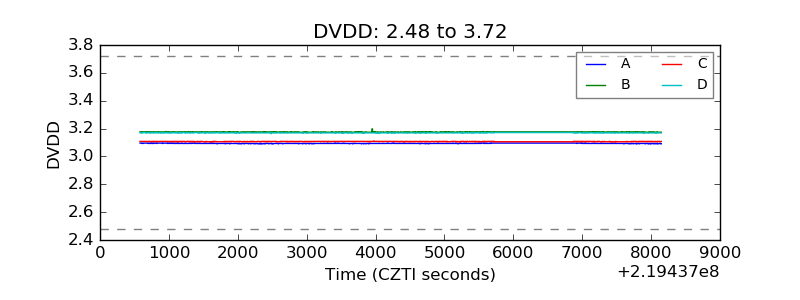 |
| Temperature 1 | 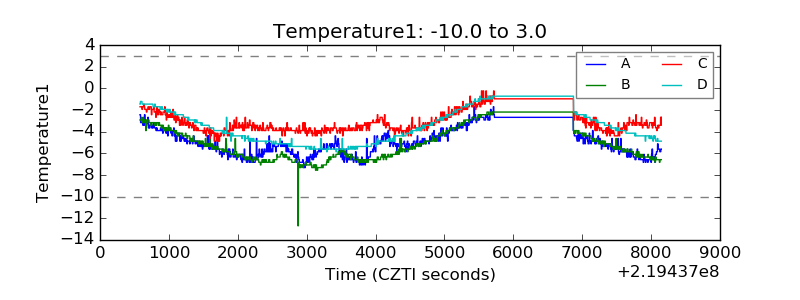 |
| Veto HV Monitor | 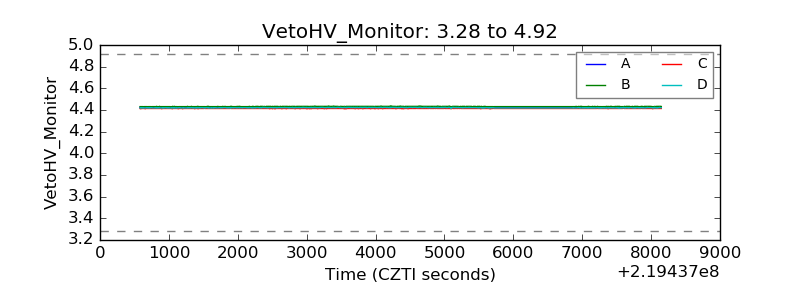 |
| Veto LLD | 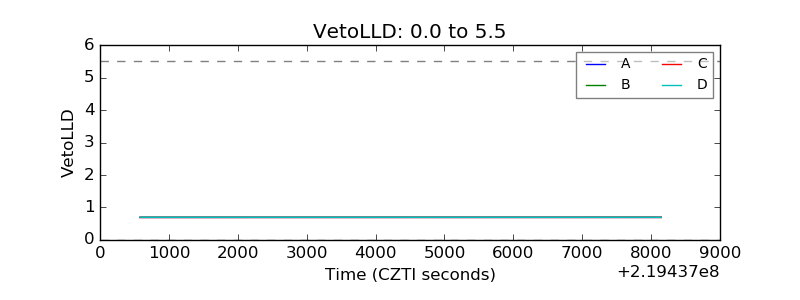 |
| Alpha Counter | 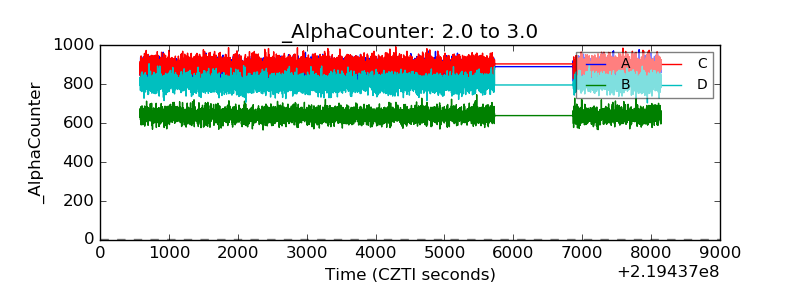 |
| _CPM_Rate | 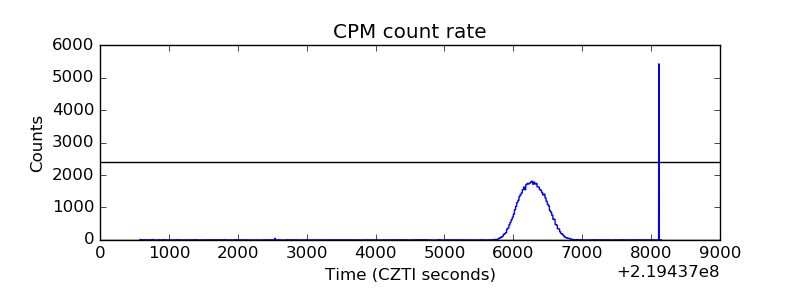 |
| CZT Counter | 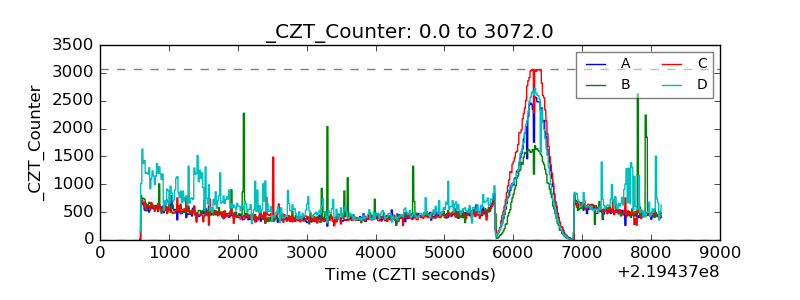 |
| +2.5 Volts monitor | 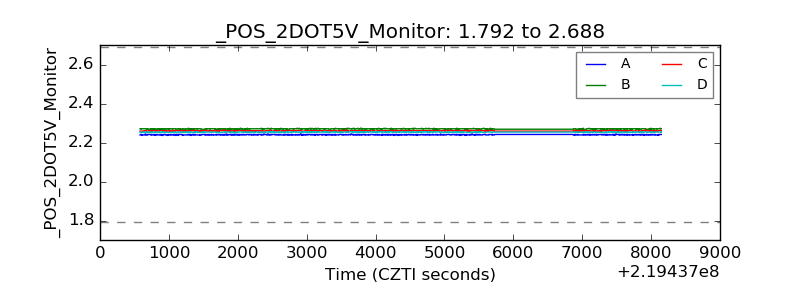 |
| +5 Volts monitor | 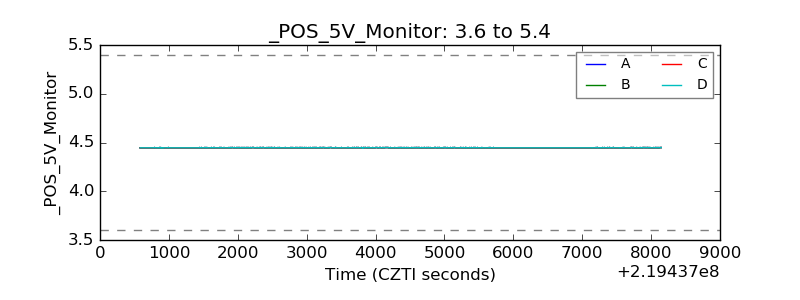 |
| _ROLL_ROT | 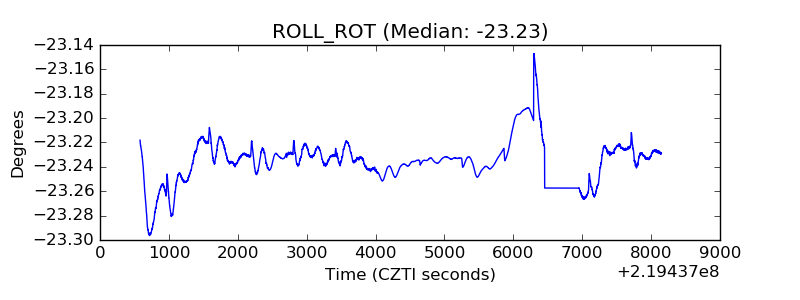 |
| _Roll_DEC | 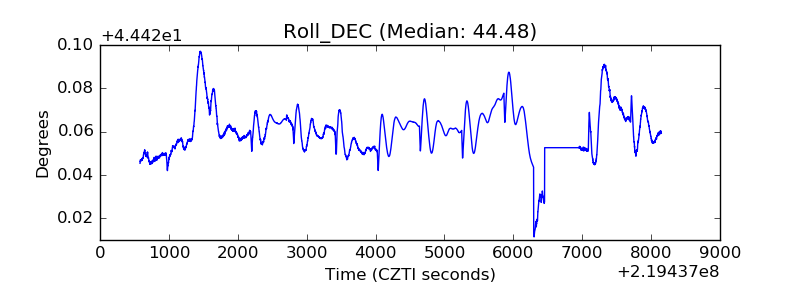 |
| _Roll_RA |  |
| Veto Counter | 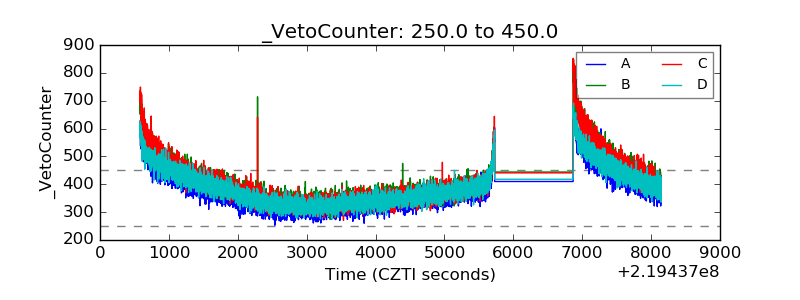 |