| Param | Original file | Final file |
|---|---|---|
| Filename | modeM0/AS1G05_246T04_9000000882_06569cztM0_level2.evt | modeM0/AS1G05_246T04_9000000882_06569cztM0_level2_quad_clean.evt |
| Size (bytes) | 439,554,240 | 89,953,920 |
| Size | 419.2 MB | 85.8 MB |
| Events in quadrant A | 2,849,536 | 575,867 |
| Events in quadrant B | 3,281,874 | 582,166 |
| Events in quadrant C | 2,845,416 | 582,762 |
| Events in quadrant D | 3,914,202 | 550,944 |
| Mode M0 | |||
|---|---|---|---|
| Quadrant | BADHDUFLAG | Total packets | Discarded packets |
| A | 0 | 12749 | 2 |
| B | 0 | 13979 | 1 |
| C | 0 | 12822 | 1 |
| D | 0 | 15906 | 1 |
| Mode SS | |||
|---|---|---|---|
| Quadrant | BADHDUFLAG | Total packets | Discarded packets |
| A | 0 | 124 | 0 |
| B | 0 | 124 | 0 |
| C | 0 | 124 | 0 |
| D | 0 | 124 | 0 |
| Mode M9 | |||
|---|---|---|---|
| Quadrant | BADHDUFLAG | Total packets | Discarded packets |
| A | 0 | 13 | 0 |
| B | 0 | 13 | 0 |
| C | 0 | 13 | 0 |
| D | 0 | 13 | 0 |
| Quadrant | Total seconds | Saturated seconds | Saturation percentage |
|---|---|---|---|
| A | 6201 | 19 | 0.306402% |
| B | 6201 | 115 | 1.854540% |
| C | 6201 | 8 | 0.129011% |
| D | 6201 | 116 | 1.870666% |
Noise dominated data is calculated using 1-second bins in cleaned event files. If a bin has >2000 counts, and if more than 50% of those come from <1% of pixels, then it is considered to be noise-dominated and hence unusable.
| Quadrant | # 1 sec bins | Bins with >0 counts | Bins with >2000 counts | High rate bins dominated by noise | Noise dominated (total time) | Noise dominated (detector-on time) | Marked lightcurve |
|---|---|---|---|---|---|---|---|
| A | 7441 | 6202 | 0 | 0 | 0.00% | 0.00% | 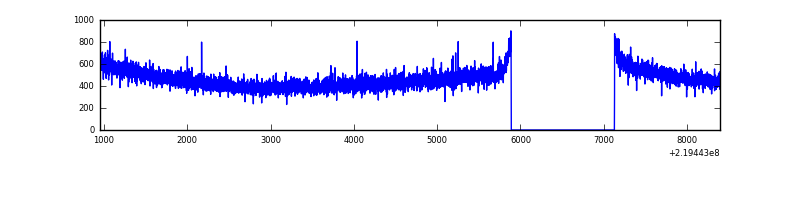 |
| B | 7441 | 6202 | 59 | 59 | 0.79% | 0.95% |  |
| C | 7441 | 6202 | 0 | 0 | 0.00% | 0.00% | 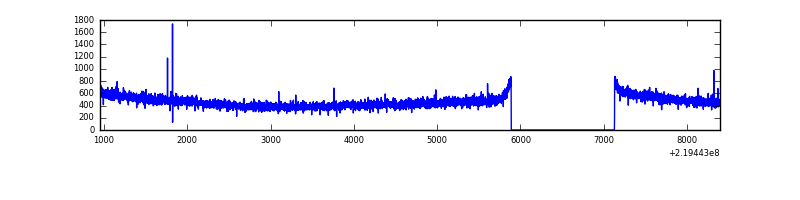 |
| D | 7441 | 6202 | 86 | 86 | 1.16% | 1.39% | 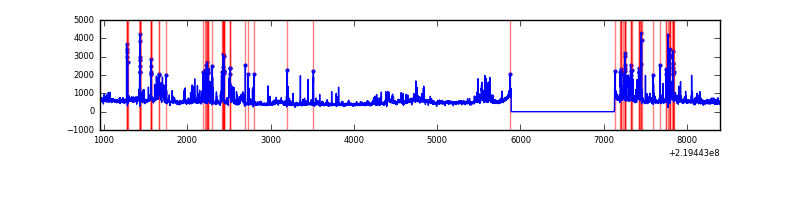 |
Top three noisy pixels from each quadrant. If the there are fewer than three noisy pixels in the level2.evt file, extra rows are filled as -1
| Pixel properties | Quadrant properties | ||||||
|---|---|---|---|---|---|---|---|
| Quadrant | DetID | PixID | Counts | Sigma | Mean | Median | Sigma |
| A | 8 | 15 | 9003 | 54.82 | 737 | 720 | 151.1 |
| A | 0 | 226 | 7046 | 41.87 | 737 | 720 | 151.1 |
| A | 12 | 194 | 6606 | 38.96 | 737 | 720 | 151.1 |
| B | 0 | 219 | 166315 | 1179.83 | 742 | 727 | 140.3 |
| B | 4 | 48 | 95658 | 676.39 | 742 | 727 | 140.3 |
| B | 4 | 172 | 41099 | 287.65 | 742 | 727 | 140.3 |
| C | 13 | 61 | 5851 | 30.41 | 726 | 729 | 168.4 |
| C | 10 | 22 | 4573 | 22.82 | 726 | 729 | 168.4 |
| C | 7 | 235 | 3760 | 18.0 | 726 | 729 | 168.4 |
| D | 14 | 34 | 567429 | 3260.83 | 713 | 692 | 173.8 |
| D | 12 | 221 | 257593 | 1478.13 | 713 | 692 | 173.8 |
| D | 2 | 33 | 174772 | 1001.6 | 713 | 692 | 173.8 |
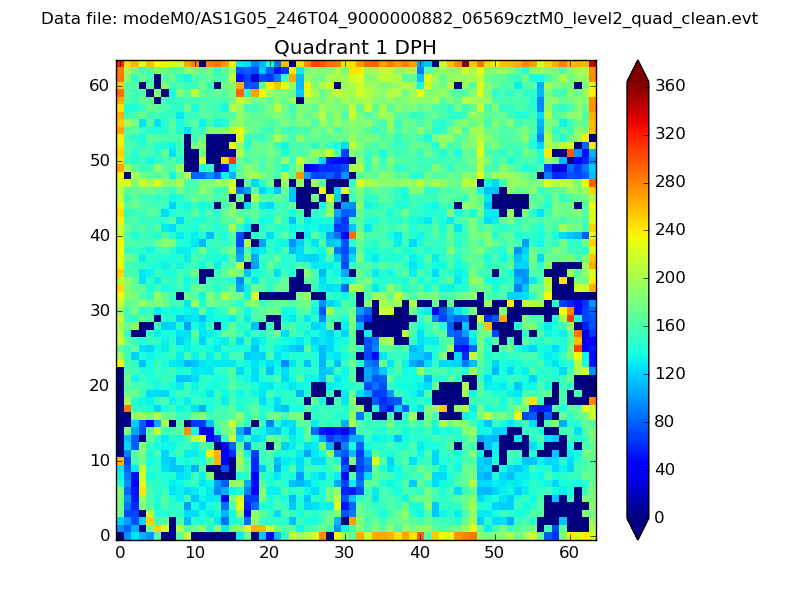
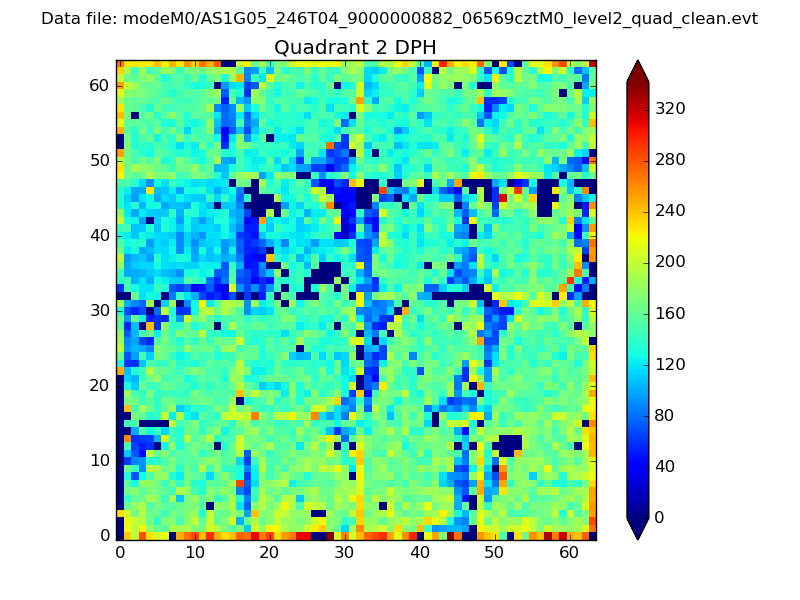
Histogram calculated using DETX and DETY for each event in the final _common_clean file
| Quadrant A | 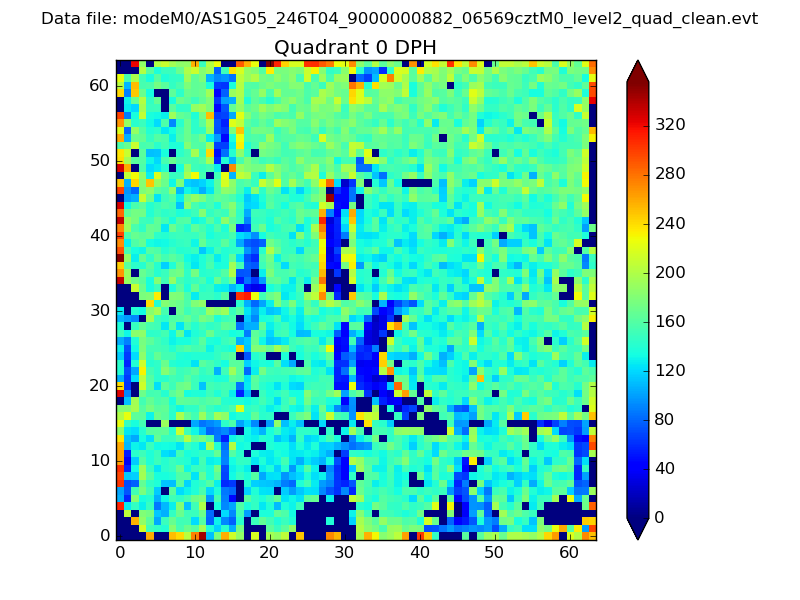 |
 |
Quadrant B |
|---|---|---|---|
| Quadrant D | 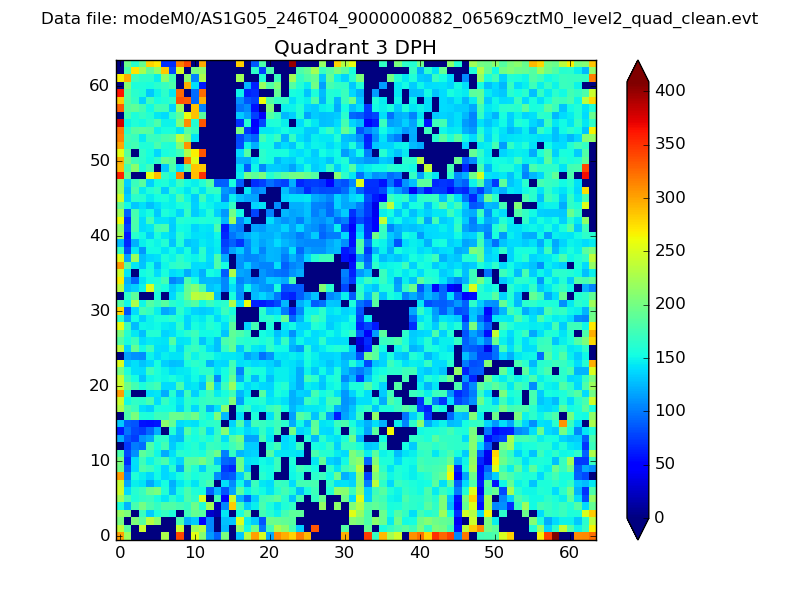 |
 |
Quadrant C |
| Plot type | Count rate plots | Images |
|---|---|---|
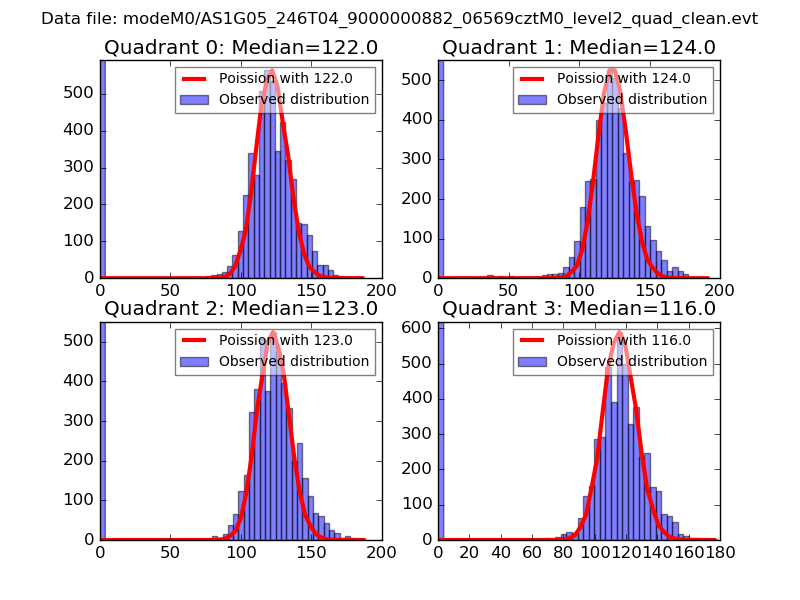
| Comparison with Poisson distribution Blue bars denote a histogram of data divided into 1 sec bins. Red curve is a Poisson curve with rate = median count rate of data. |
 |
 |
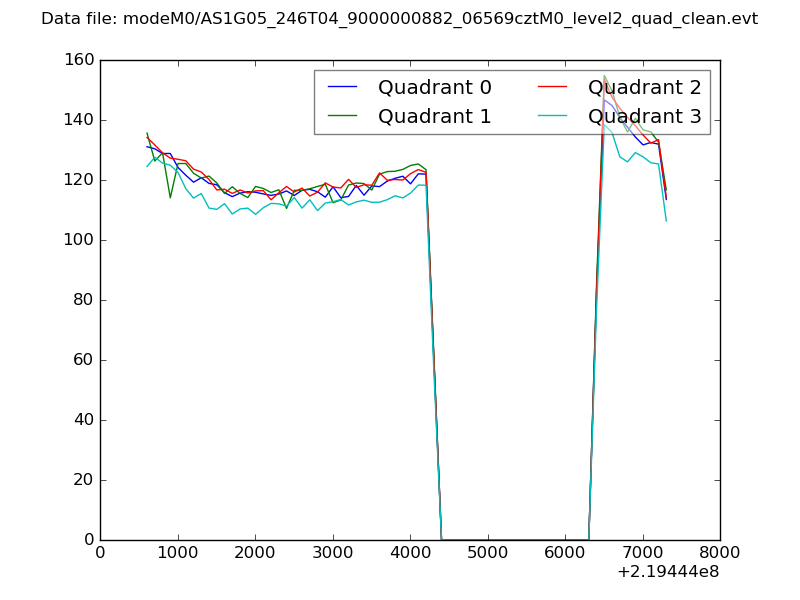
| Quadrant-wise count rates Data is divided into 100 sec bins |
 |
|
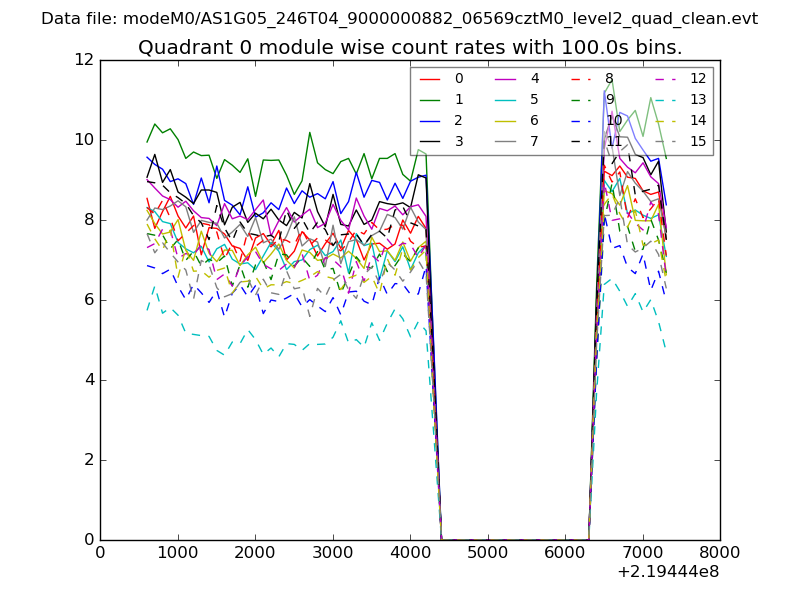
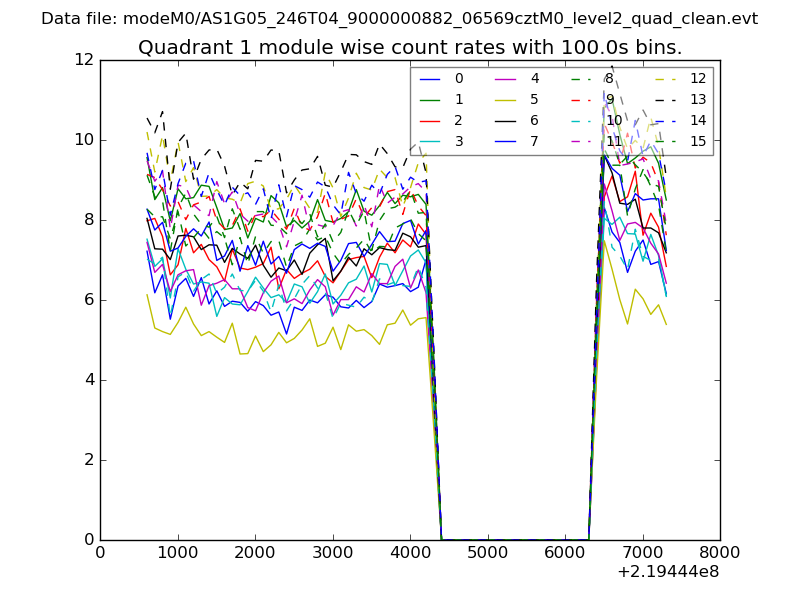
| Module-wise count rates for Quadrant A Data is divided into 100 sec bins |
 |
 |
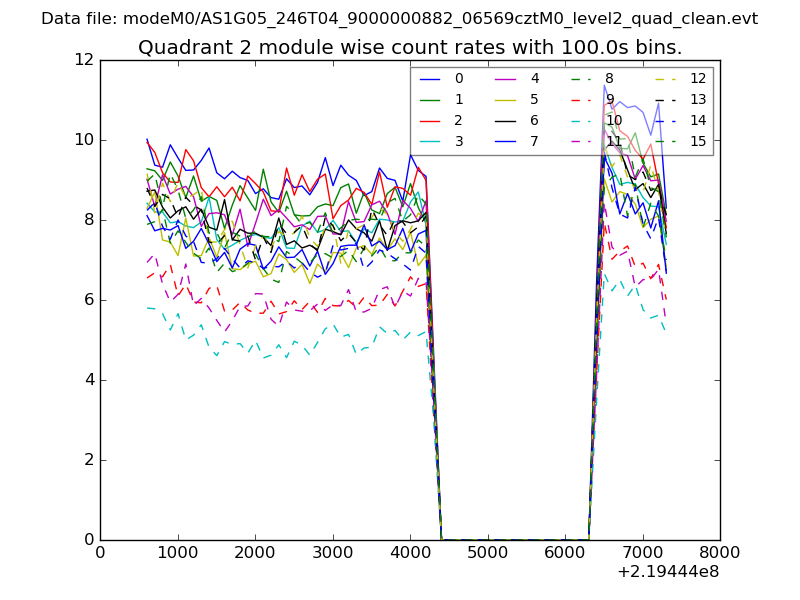
| Module-wise count rates for Quadrant B Data is divided into 100 sec bins |
 |
 |
| Module-wise count rates for Quadrant C Data is divided into 100 sec bins |
 |
 |
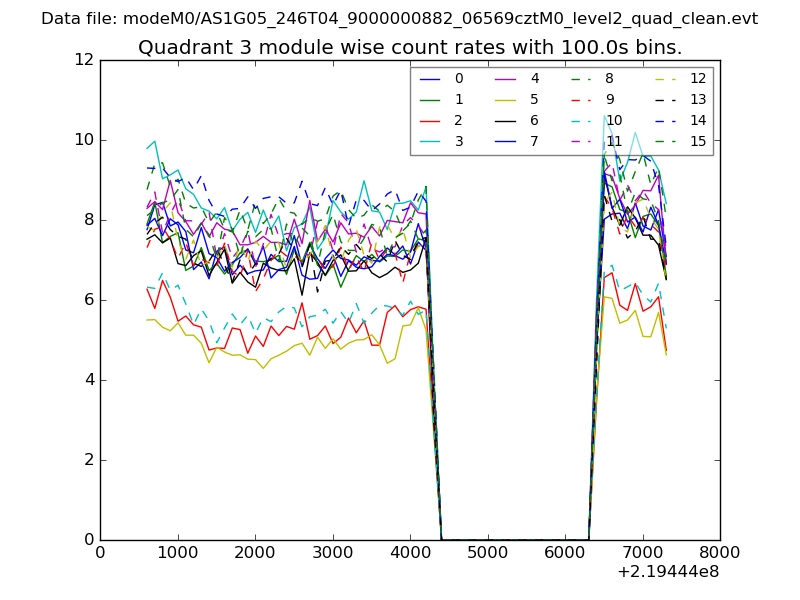
| Module-wise count rates for Quadrant D Data is divided into 100 sec bins |
 |
 |
| Parameter | Plot |
|---|---|
| CZT HV Monitor | 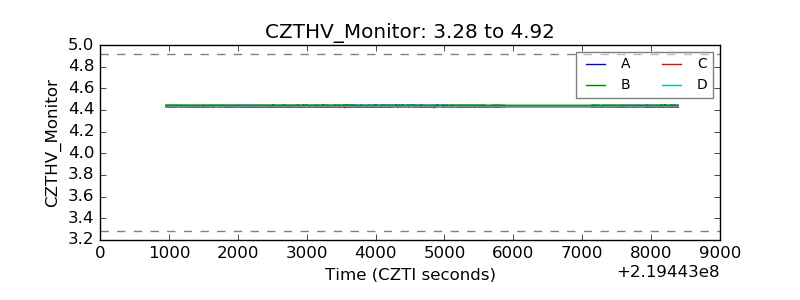 |
| D_VDD | 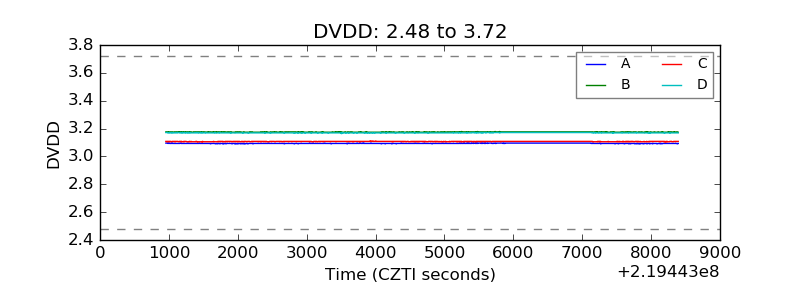 |
| Temperature 1 | 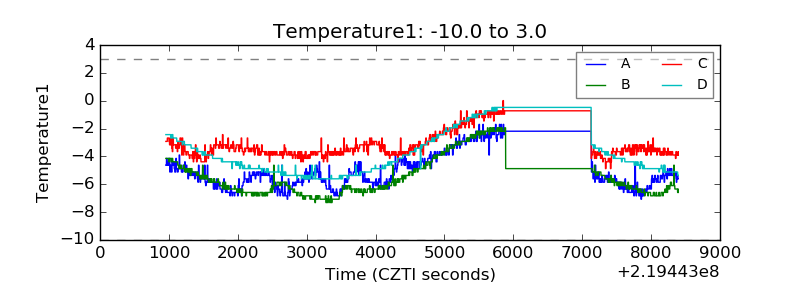 |
| Veto HV Monitor | 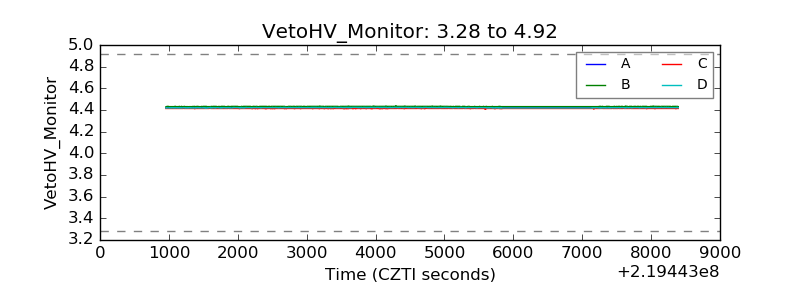 |
| Veto LLD | 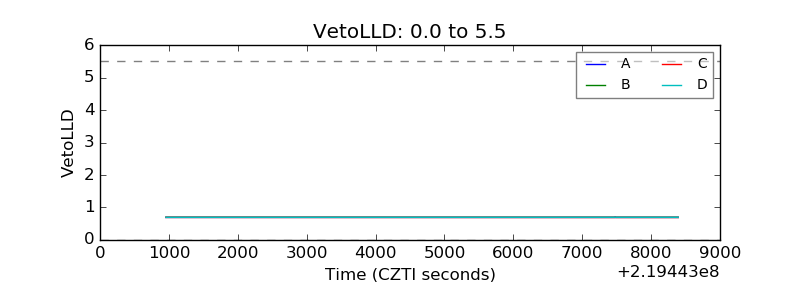 |
| Alpha Counter | 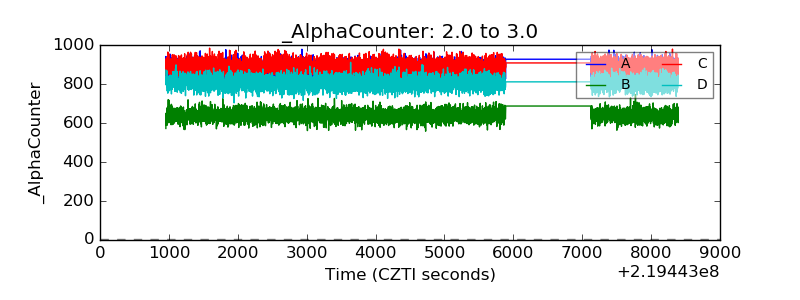 |
| _CPM_Rate | 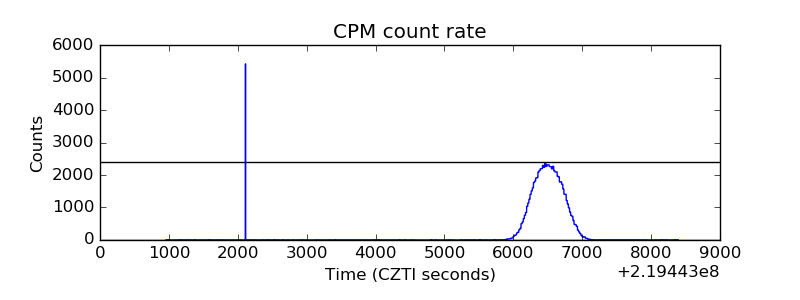 |
| CZT Counter | 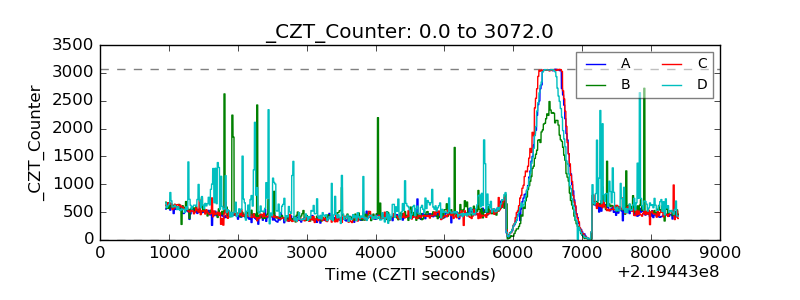 |
| +2.5 Volts monitor | 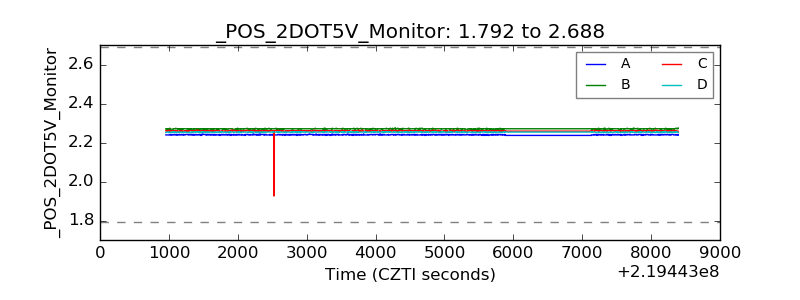 |
| +5 Volts monitor | 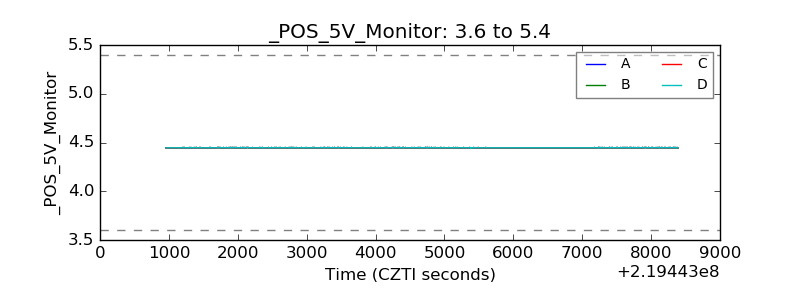 |
| _ROLL_ROT | 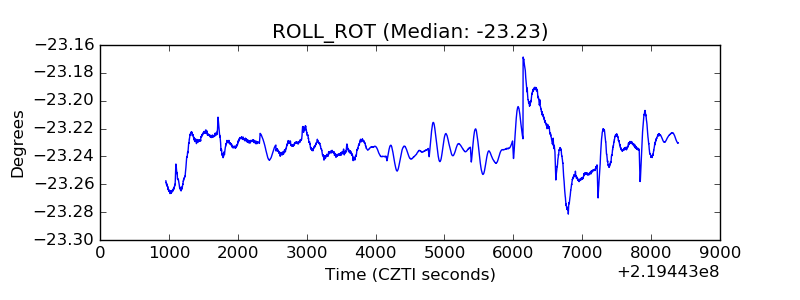 |
| _Roll_DEC | 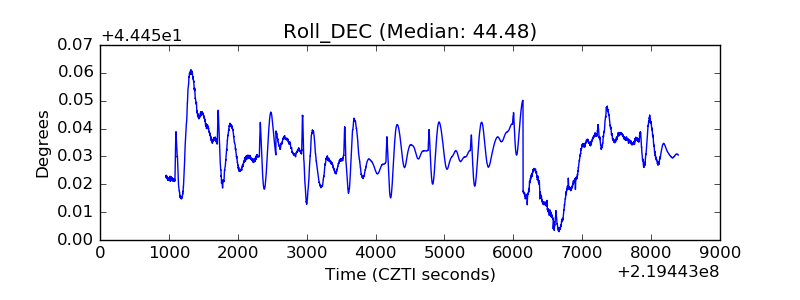 |
| _Roll_RA | 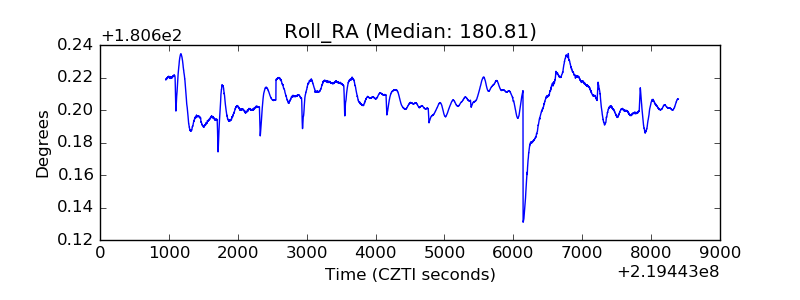 |
| Veto Counter | 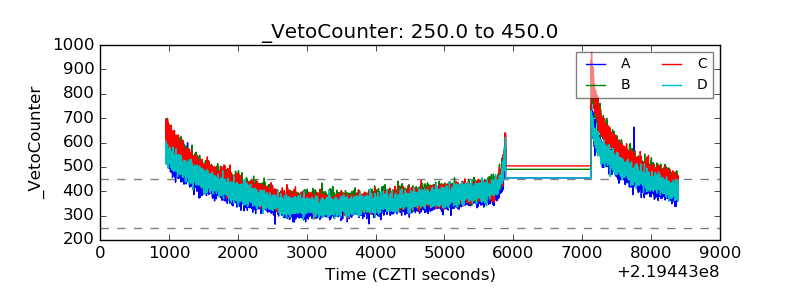 |