| Param | Original file | Final file |
|---|---|---|
| Filename | modeM0/AS1G05_246T04_9000000882_06573cztM0_level2.evt | modeM0/AS1G05_246T04_9000000882_06573cztM0_level2_quad_clean.evt |
| Size (bytes) | 798,903,360 | 156,525,120 |
| Size | 761.9 MB | 149.3 MB |
| Events in quadrant A | 4,718,449 | 1,020,559 |
| Events in quadrant B | 5,202,243 | 1,045,568 |
| Events in quadrant C | 4,661,469 | 1,032,002 |
| Events in quadrant D | 8,925,161 | 938,209 |
| Mode M0 | |||
|---|---|---|---|
| Quadrant | BADHDUFLAG | Total packets | Discarded packets |
| A | 0 | 20958 | 2 |
| B | 0 | 22256 | 2 |
| C | 0 | 20950 | 2 |
| D | 0 | 33802 | 2 |
| Mode SS | |||
|---|---|---|---|
| Quadrant | BADHDUFLAG | Total packets | Discarded packets |
| A | 0 | 208 | 0 |
| B | 0 | 208 | 0 |
| C | 0 | 208 | 0 |
| D | 0 | 208 | 0 |
| Mode M9 | |||
|---|---|---|---|
| Quadrant | BADHDUFLAG | Total packets | Discarded packets |
| A | 0 | 27 | 0 |
| B | 0 | 27 | 0 |
| C | 0 | 27 | 0 |
| D | 0 | 27 | 0 |
| Quadrant | Total seconds | Saturated seconds | Saturation percentage |
|---|---|---|---|
| A | 10165 | 43 | 0.423020% |
| B | 10165 | 140 | 1.377275% |
| C | 10165 | 28 | 0.275455% |
| D | 10165 | 449 | 4.417118% |
Noise dominated data is calculated using 1-second bins in cleaned event files. If a bin has >2000 counts, and if more than 50% of those come from <1% of pixels, then it is considered to be noise-dominated and hence unusable.
| Quadrant | # 1 sec bins | Bins with >0 counts | Bins with >2000 counts | High rate bins dominated by noise | Noise dominated (total time) | Noise dominated (detector-on time) | Marked lightcurve |
|---|---|---|---|---|---|---|---|
| A | 12825 | 10167 | 0 | 0 | 0.00% | 0.00% | 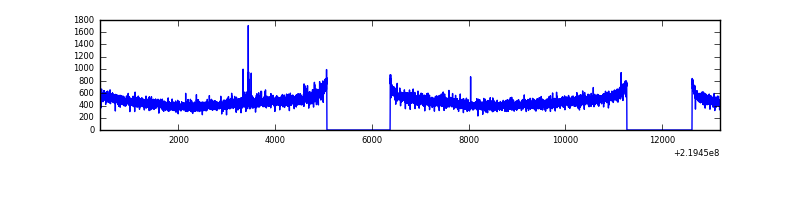 |
| B | 12825 | 10167 | 53 | 53 | 0.41% | 0.52% | 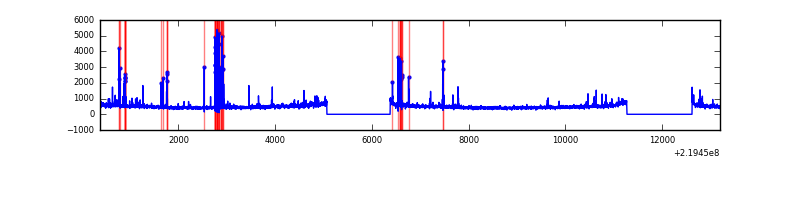 |
| C | 12825 | 10167 | 2 | 2 | 0.02% | 0.02% | 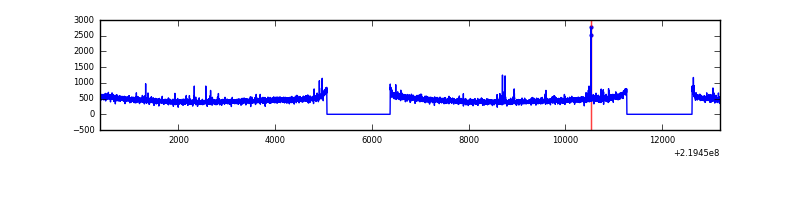 |
| D | 12825 | 10167 | 436 | 436 | 3.40% | 4.29% | 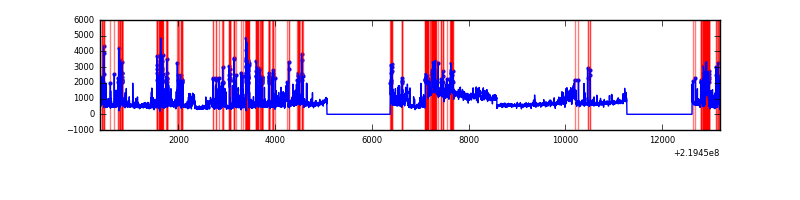 |
Top three noisy pixels from each quadrant. If the there are fewer than three noisy pixels in the level2.evt file, extra rows are filled as -1
| Pixel properties | Quadrant properties | ||||||
|---|---|---|---|---|---|---|---|
| Quadrant | DetID | PixID | Counts | Sigma | Mean | Median | Sigma |
| A | 8 | 15 | 85460 | 348.82 | 1202 | 1181 | 241.6 |
| A | 0 | 226 | 11579 | 43.04 | 1202 | 1181 | 241.6 |
| A | 12 | 194 | 10588 | 38.93 | 1202 | 1181 | 241.6 |
| B | 0 | 219 | 140038 | 609.4 | 1218 | 1192 | 227.8 |
| B | 4 | 48 | 138919 | 604.49 | 1218 | 1192 | 227.8 |
| B | 5 | 143 | 86695 | 375.28 | 1218 | 1192 | 227.8 |
| C | 9 | 237 | 25905 | 91.38 | 1180 | 1187 | 270.5 |
| C | 10 | 22 | 17691 | 61.01 | 1180 | 1187 | 270.5 |
| C | 13 | 61 | 9297 | 29.98 | 1180 | 1187 | 270.5 |
| D | 14 | 34 | 2044191 | 7247.53 | 1146 | 1111 | 281.9 |
| D | 12 | 221 | 1875071 | 6647.6 | 1146 | 1111 | 281.9 |
| D | 2 | 63 | 303789 | 1073.71 | 1146 | 1111 | 281.9 |
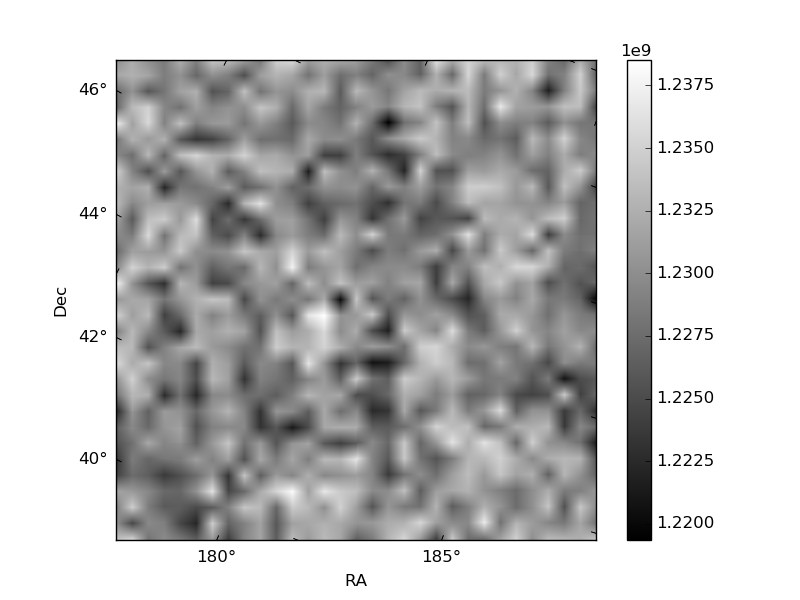
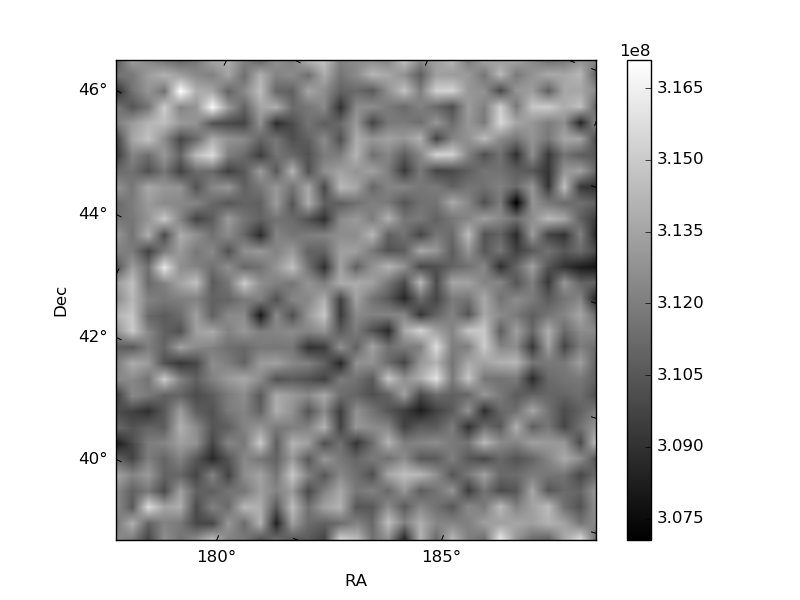
Histogram calculated using DETX and DETY for each event in the final _common_clean file
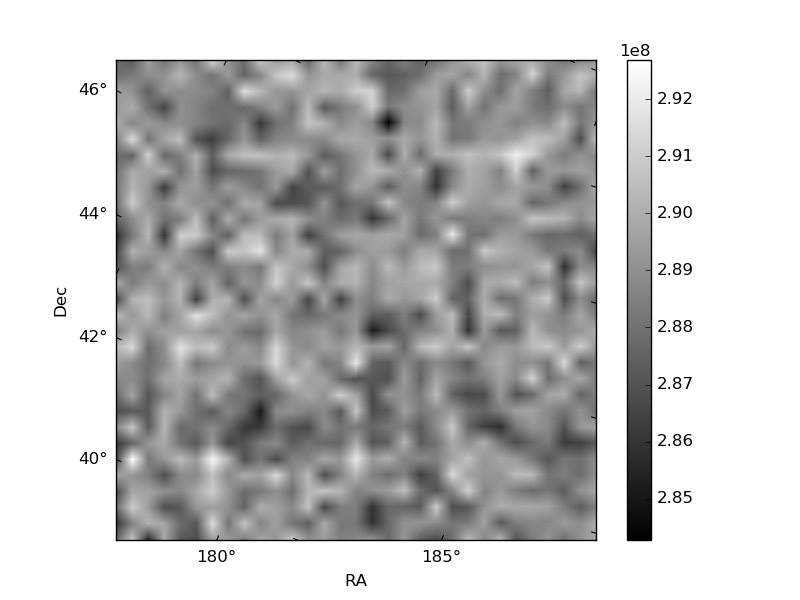
| Quadrant A | 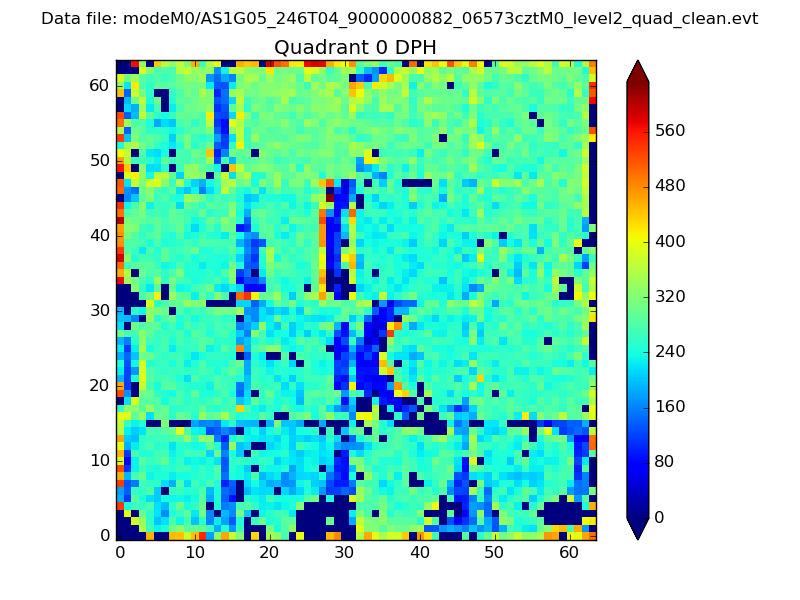 |
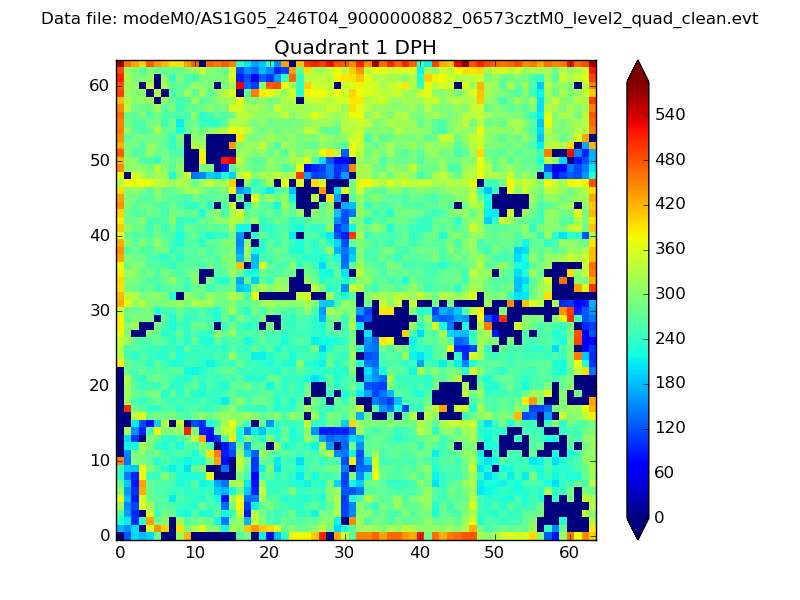 |
Quadrant B |
|---|---|---|---|
| Quadrant D | 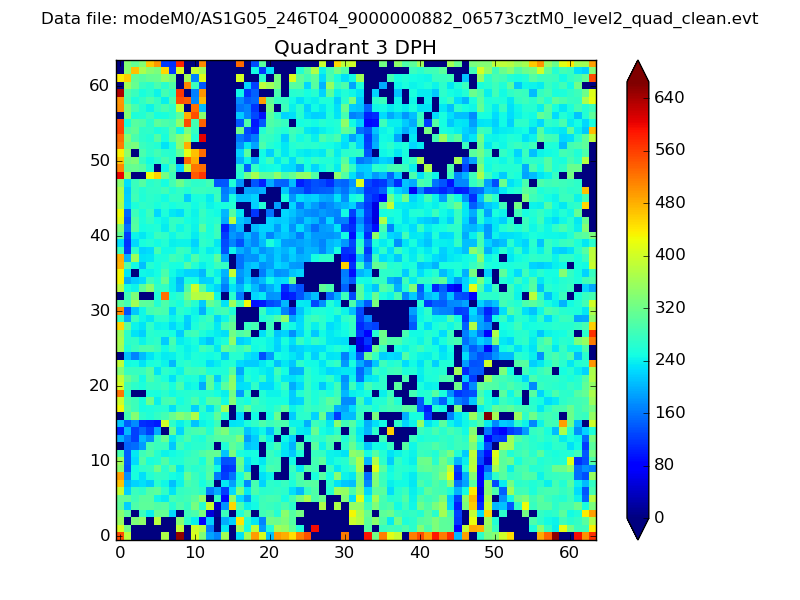 |
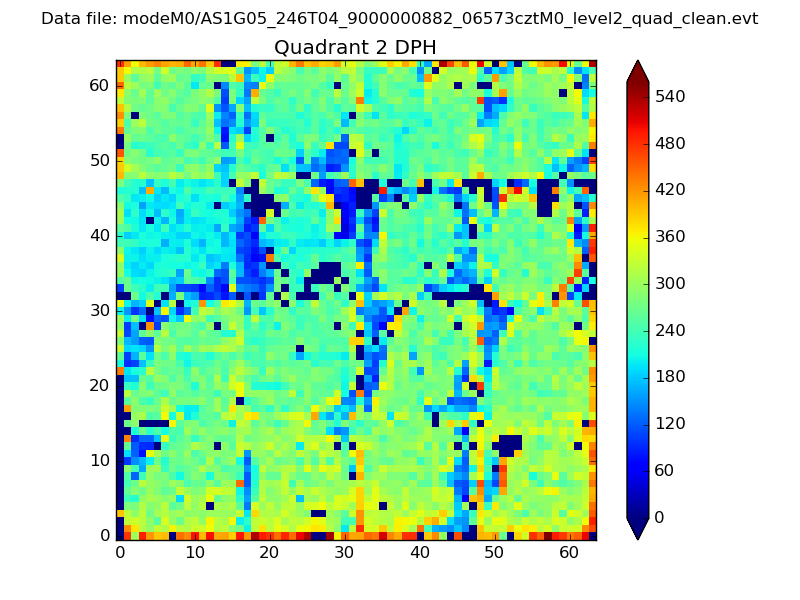 |
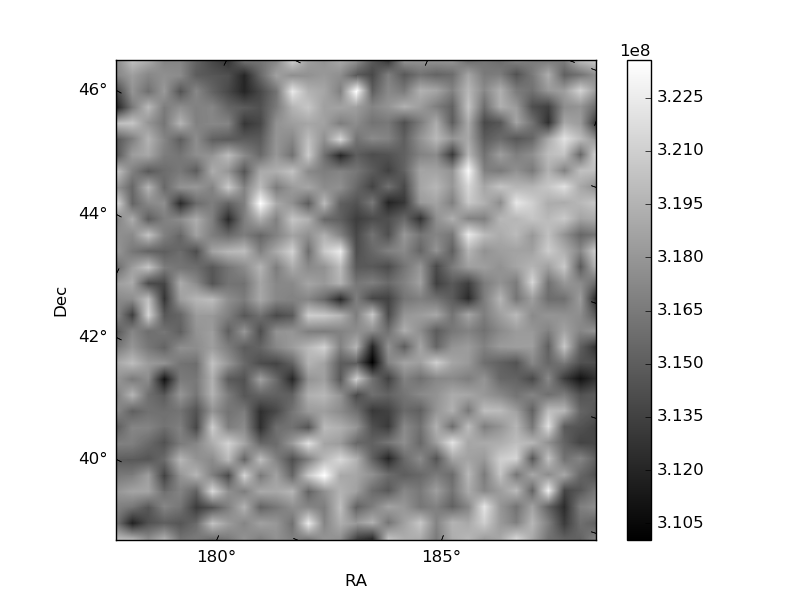
Quadrant C |
| Plot type | Count rate plots | Images |
|---|---|---|
| Comparison with Poisson distribution Blue bars denote a histogram of data divided into 1 sec bins. Red curve is a Poisson curve with rate = median count rate of data. |
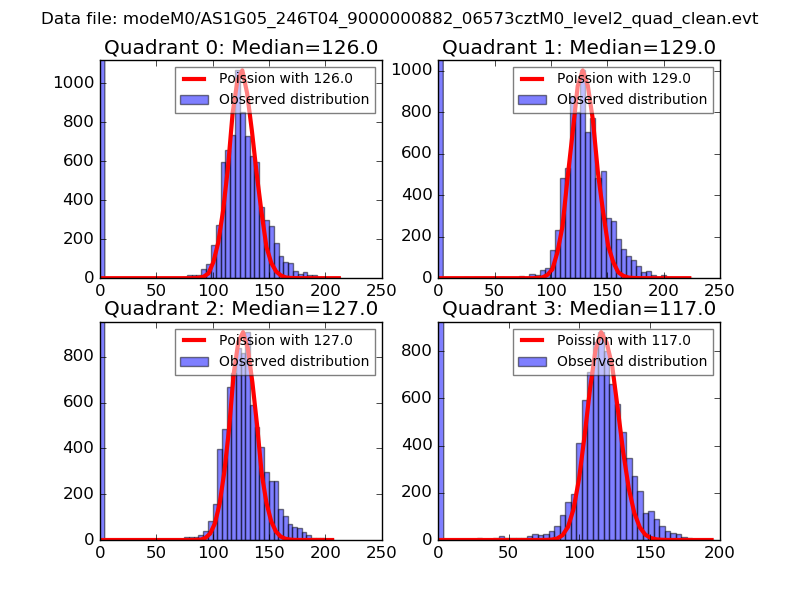 |
 |
| Quadrant-wise count rates Data is divided into 100 sec bins |
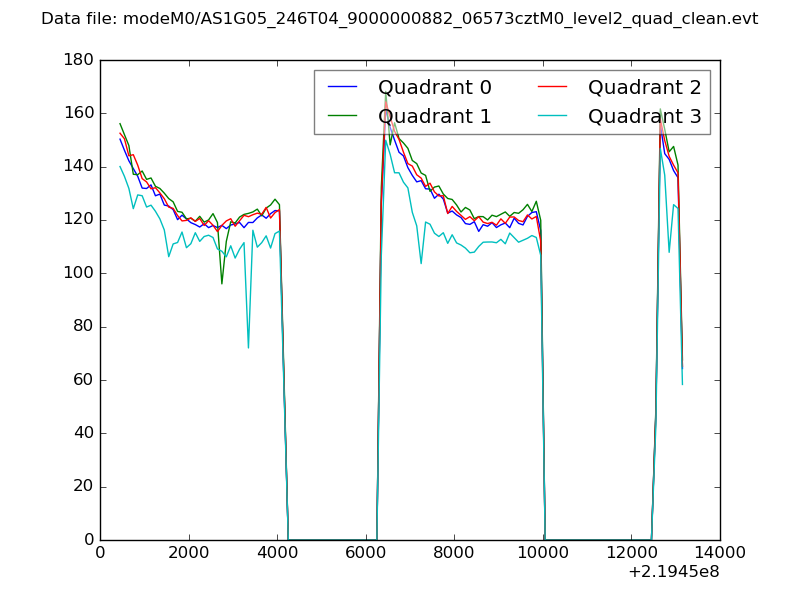 |
|
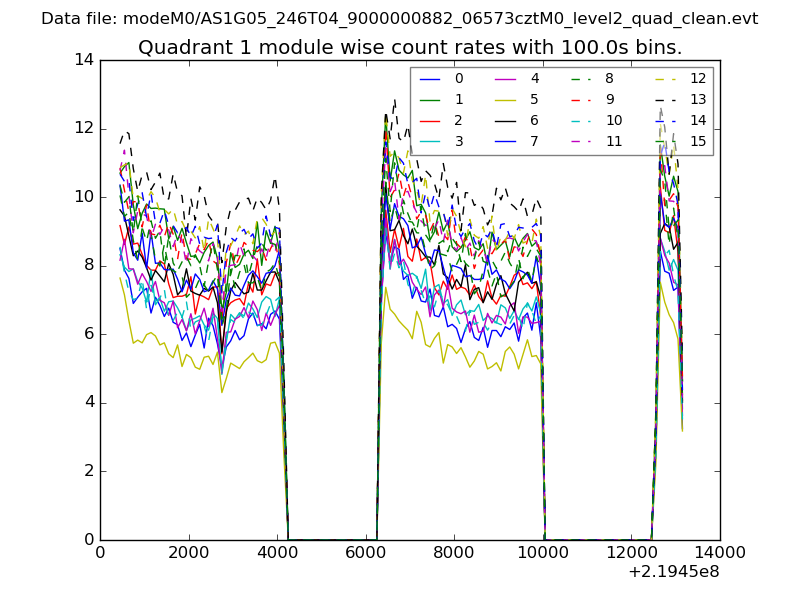
| Module-wise count rates for Quadrant A Data is divided into 100 sec bins |
 |
 |
| Module-wise count rates for Quadrant B Data is divided into 100 sec bins |
 |
 |
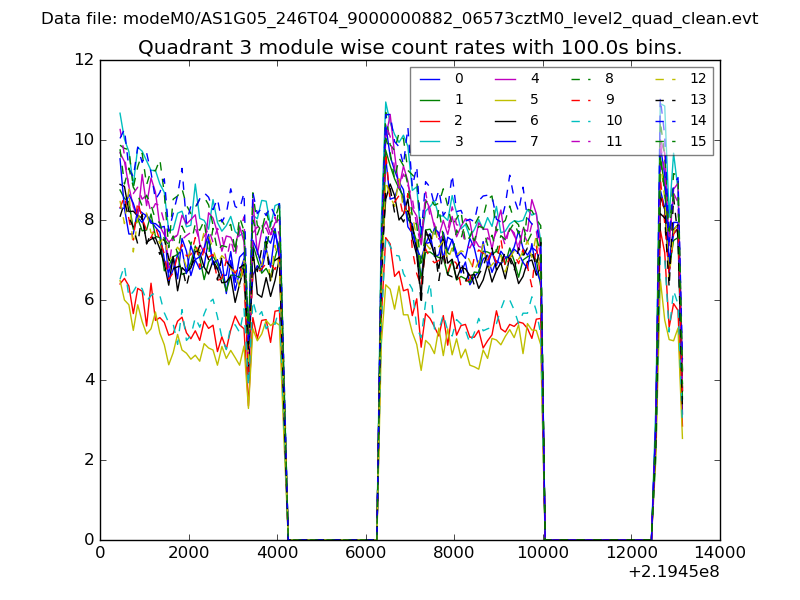
| Module-wise count rates for Quadrant C Data is divided into 100 sec bins |
 |
 |
| Module-wise count rates for Quadrant D Data is divided into 100 sec bins |
 |
 |
| Parameter | Plot |
|---|---|
| CZT HV Monitor | 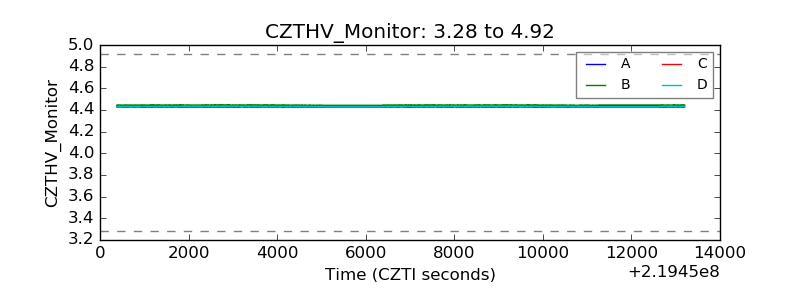 |
| D_VDD | 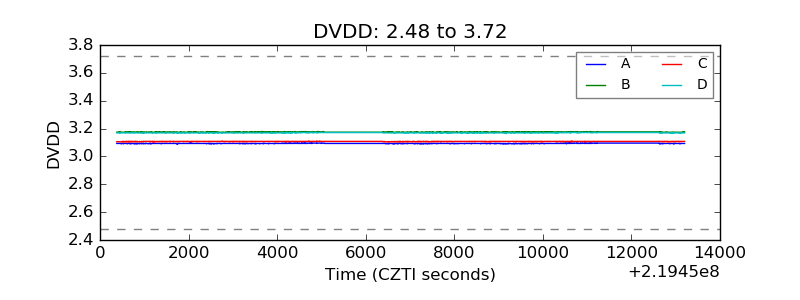 |
| Temperature 1 | 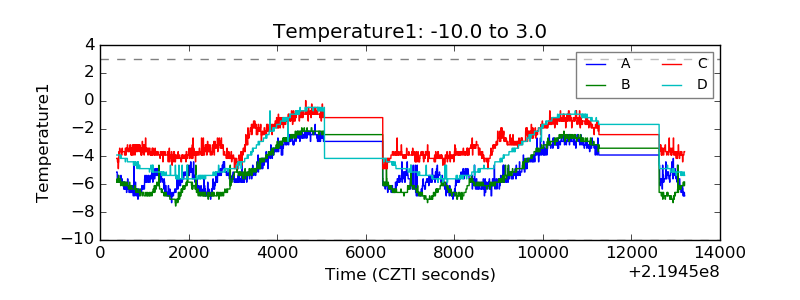 |
| Veto HV Monitor | 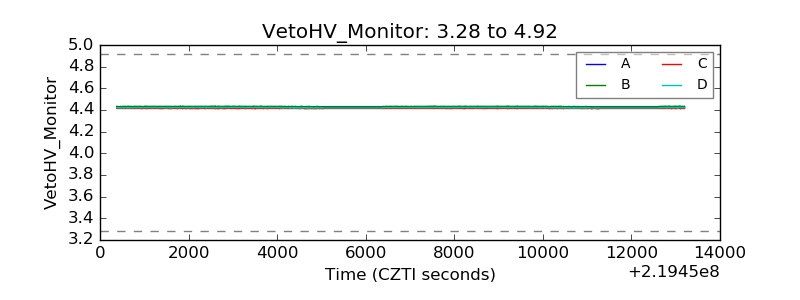 |
| Veto LLD | 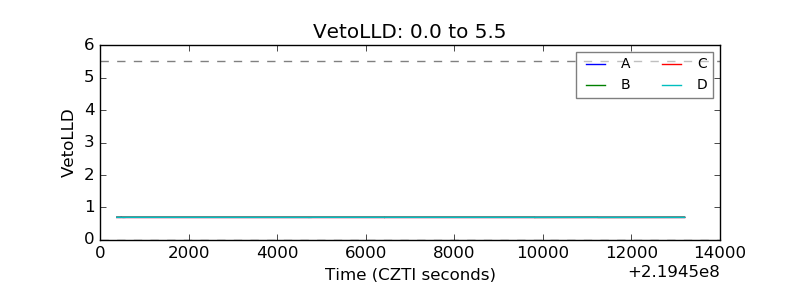 |
| Alpha Counter | 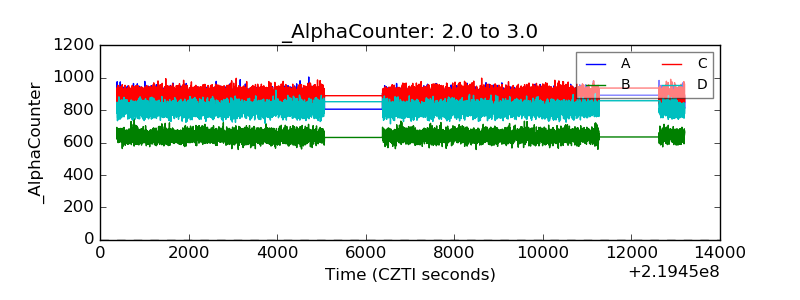 |
| _CPM_Rate | 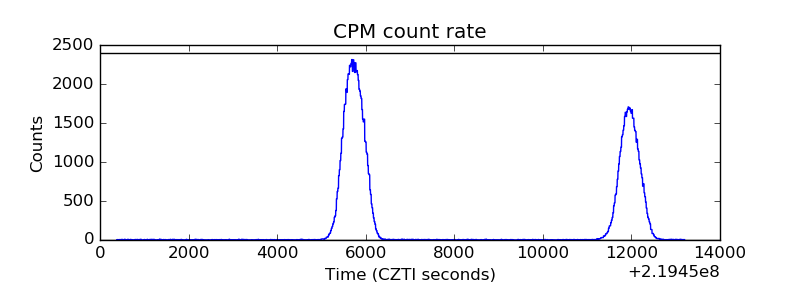 |
| CZT Counter | 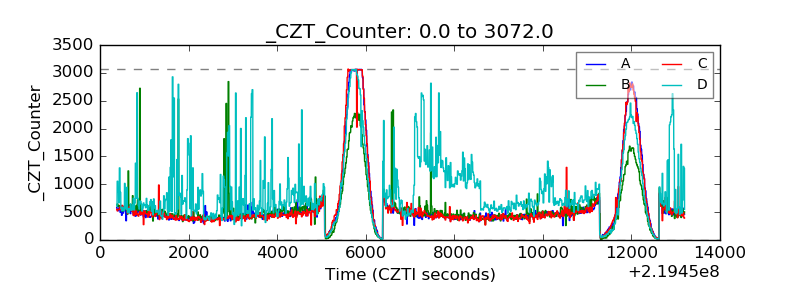 |
| +2.5 Volts monitor |  |
| +5 Volts monitor | 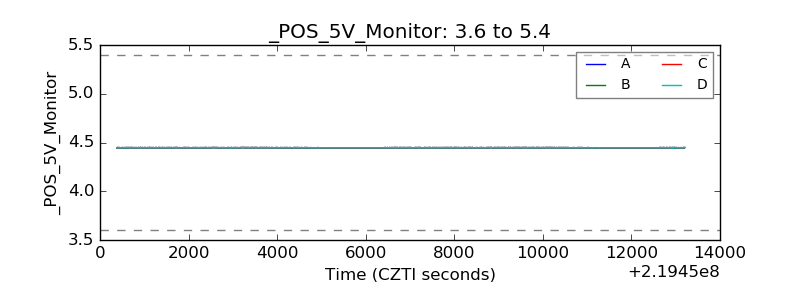 |
| _ROLL_ROT | 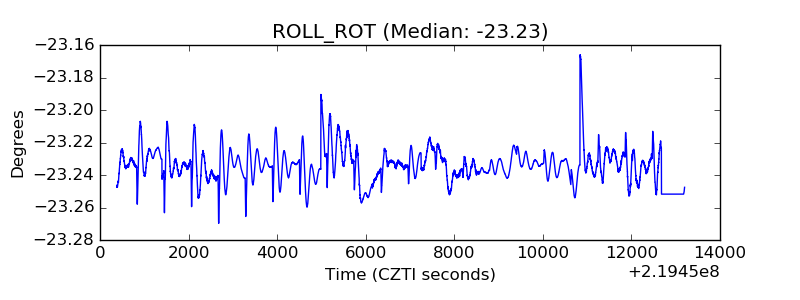 |
| _Roll_DEC | 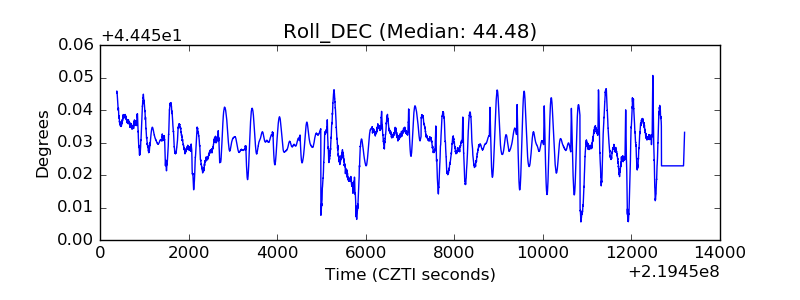 |
| _Roll_RA | 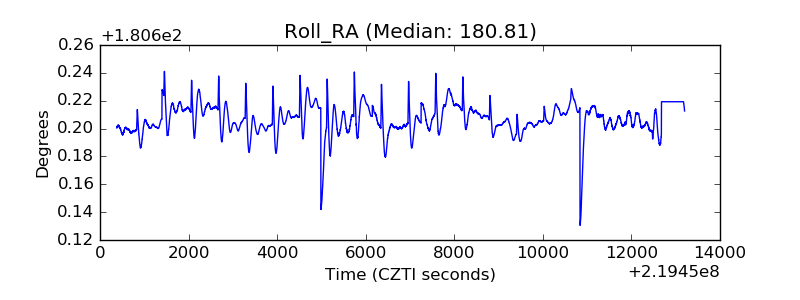 |
| Veto Counter | 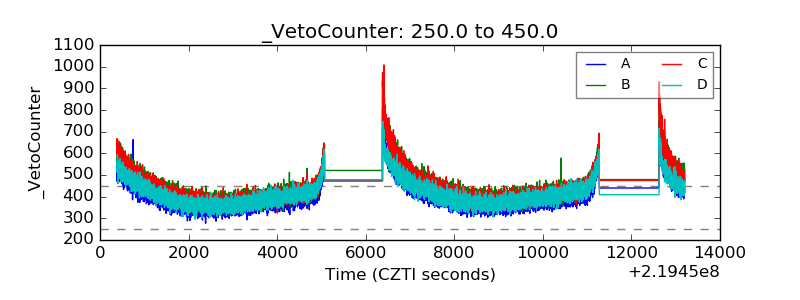 |