| Param | Original file | Final file |
|---|---|---|
| Filename | modeM0/AS1C02_008T01_9000000884cztM0_level2.fits | modeM0/AS1C02_008T01_9000000884cztM0_level2_quad_clean.evt |
| Size (bytes) | 588,746,880 | 554,022,720 |
| Size | 561.5 MB | 528.4 MB |
| Events in quadrant A | 3,512,006 | 3,215,062 |
| Events in quadrant B | 3,413,850 | 3,216,565 |
| Events in quadrant C | 3,493,402 | 3,073,668 |
| Events in quadrant D | 2,971,652 | 2,834,703 |
| Mode M0 | |||
|---|---|---|---|
| Quadrant | BADHDUFLAG | Total packets | Discarded packets |
| A | 0 | 135886 | 0 |
| B | 0 | 139983 | 0 |
| C | 0 | 132550 | 0 |
| D | 0 | 158131 | 0 |
| Mode M9 | |||
|---|---|---|---|
| Quadrant | BADHDUFLAG | Total packets | Discarded packets |
| A | 0 | 92 | 0 |
| B | 0 | 92 | 0 |
| C | 0 | 92 | 0 |
| D | 0 | 92 | 0 |
| Mode SS | |||
|---|---|---|---|
| Quadrant | BADHDUFLAG | Total packets | Discarded packets |
| A | 0 | 1318 | 0 |
| B | 0 | 1318 | 0 |
| C | 0 | 1318 | 0 |
| D | 0 | 1318 | 0 |
| Quadrant | Total seconds | Saturated seconds | Saturation percentage |
|---|---|---|---|
| A | 64712 | 1191 | 1.840462% |
| B | 64712 | 1246 | 1.925454% |
| C | 64712 | 599 | 0.925640% |
| D | 64712 | 1801 | 2.783101% |
Noise dominated data is calculated using 1-second bins in cleaned event files. If a bin has >2000 counts, and if more than 50% of those come from <1% of pixels, then it is considered to be noise-dominated and hence unusable.
| Quadrant | # 1 sec bins | Bins with >0 counts | Bins with >2000 counts | High rate bins dominated by noise | Noise dominated (total time) | Noise dominated (detector-on time) | Marked lightcurve |
|---|---|---|---|---|---|---|---|
| A | 73918 | 64713 | 0 | 0 | 0.00% | 0.00% |  |
| B | 73918 | 64710 | 0 | 0 | 0.00% | 0.00% |  |
| C | 73918 | 64713 | 0 | 0 | 0.00% | 0.00% |  |
| D | 73918 | 64698 | 0 | 0 | 0.00% | 0.00% |  |
Top three noisy pixels from each quadrant. If the there are fewer than three noisy pixels in the level2.evt file, extra rows are filled as -1
| Pixel properties | Quadrant properties | ||||||
|---|---|---|---|---|---|---|---|
| Quadrant | DetID | PixID | Counts | Sigma | Mean | Median | Sigma |
| A | 0 | 29 | 3299 | 10.59 | 912 | 846 | 231.6 |
| A | 7 | 110 | 2903 | 8.88 | 912 | 846 | 231.6 |
| A | 9 | 19 | 2643 | 7.76 | 912 | 846 | 231.6 |
| B | 2 | 9 | 2969 | 11.37 | 899 | 848 | 186.6 |
| B | 12 | 226 | 2359 | 8.1 | 899 | 848 | 186.6 |
| B | 5 | 128 | 2303 | 7.8 | 899 | 848 | 186.6 |
| C | 1 | 80 | 2527 | 6.81 | 921 | 847 | 246.7 |
| C | 12 | 241 | 2523 | 6.79 | 921 | 847 | 246.7 |
| C | 1 | 81 | 2513 | 6.75 | 921 | 847 | 246.7 |
| D | 6 | 231 | 2268 | 6.58 | 847 | 766 | 228.3 |
| D | 3 | 14 | 2256 | 6.53 | 847 | 766 | 228.3 |
| D | 3 | 31 | 2136 | 6.0 | 847 | 766 | 228.3 |
Histogram calculated using DETX and DETY for each event in the final _common_clean file
| Quadrant A | 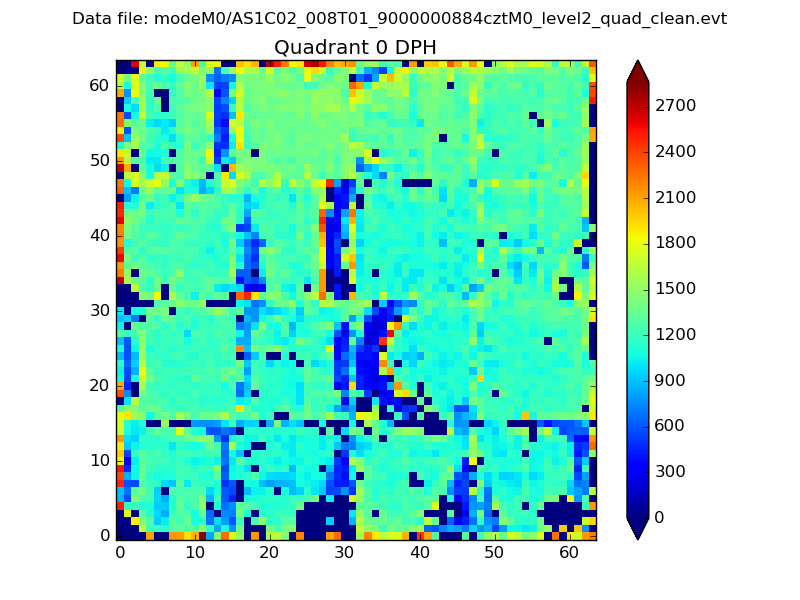 |
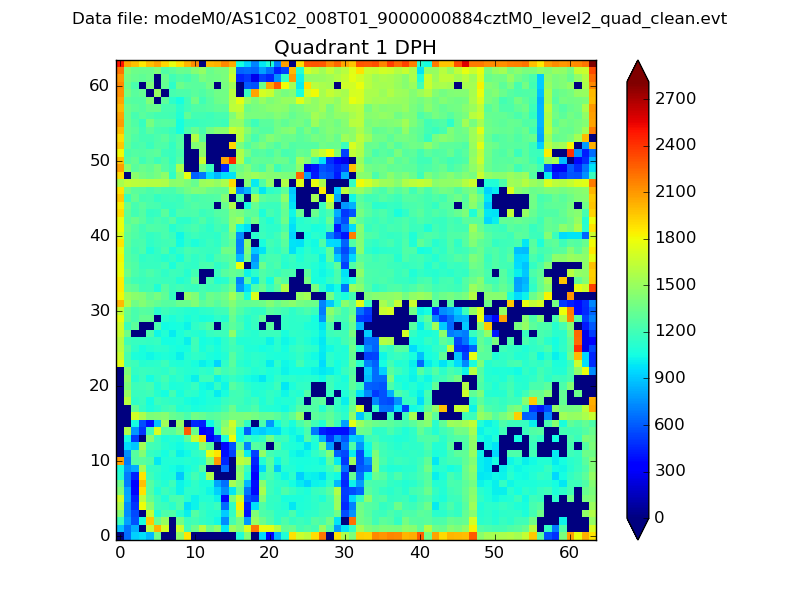 |
Quadrant B |
|---|---|---|---|
| Quadrant D |  |
 |
Quadrant C |
| Plot type | Count rate plots | Images |
|---|---|---|
| Comparison with Poisson distribution Blue bars denote a histogram of data divided into 1 sec bins. Red curve is a Poisson curve with rate = median count rate of data. |
 |
 |
| Quadrant-wise count rates Data is divided into 100 sec bins |
 |
|
| Module-wise count rates for Quadrant A Data is divided into 100 sec bins |
 |
 |
| Module-wise count rates for Quadrant B Data is divided into 100 sec bins |
 |
 |
| Module-wise count rates for Quadrant C Data is divided into 100 sec bins |
 |
 |
| Module-wise count rates for Quadrant D Data is divided into 100 sec bins |
 |
 |
| Parameter | Plot |
|---|---|
| CZT HV Monitor |  |
| D_VDD | 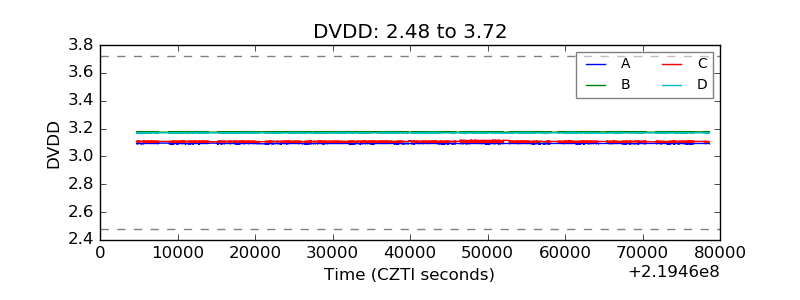 |
| Temperature 1 |  |
| Veto HV Monitor |  |
| Veto LLD |  |
| Alpha Counter |  |
| _CPM_Rate |  |
| CZT Counter |  |
| +2.5 Volts monitor |  |
| +5 Volts monitor |  |
| _ROLL_ROT |  |
| _Roll_DEC |  |
| _Roll_RA |  |
| Veto Counter |  |