| Param | Original file | Final file |
|---|---|---|
| Filename | modeM0/AS1C02_008T01_9000000884_06574cztM0_level2.evt | modeM0/AS1C02_008T01_9000000884_06574cztM0_level2_quad_clean.evt |
| Size (bytes) | 498,908,160 | 70,407,360 |
| Size | 475.8 MB | 67.1 MB |
| Events in quadrant A | 3,359,709 | 412,248 |
| Events in quadrant B | 4,100,012 | 413,665 |
| Events in quadrant C | 3,272,898 | 410,679 |
| Events in quadrant D | 3,889,809 | 395,788 |
| Mode M0 | |||
|---|---|---|---|
| Quadrant | BADHDUFLAG | Total packets | Discarded packets |
| A | 0 | 14801 | 3 |
| B | 0 | 16834 | 2 |
| C | 0 | 14728 | 2 |
| D | 0 | 16428 | 2 |
| Mode M9 | |||
|---|---|---|---|
| Quadrant | BADHDUFLAG | Total packets | Discarded packets |
| A | 0 | 7 | 0 |
| B | 0 | 7 | 0 |
| C | 0 | 7 | 0 |
| D | 0 | 8 | 0 |
| Mode SS | |||
|---|---|---|---|
| Quadrant | BADHDUFLAG | Total packets | Discarded packets |
| A | 0 | 146 | 0 |
| B | 0 | 146 | 0 |
| C | 0 | 146 | 0 |
| D | 0 | 146 | 0 |
| Quadrant | Total seconds | Saturated seconds | Saturation percentage |
|---|---|---|---|
| A | 7169 | 73 | 1.018273% |
| B | 7169 | 125 | 1.743618% |
| C | 7169 | 39 | 0.544009% |
| D | 7169 | 114 | 1.590180% |
Noise dominated data is calculated using 1-second bins in cleaned event files. If a bin has >2000 counts, and if more than 50% of those come from <1% of pixels, then it is considered to be noise-dominated and hence unusable.
| Quadrant | # 1 sec bins | Bins with >0 counts | Bins with >2000 counts | High rate bins dominated by noise | Noise dominated (total time) | Noise dominated (detector-on time) | Marked lightcurve |
|---|---|---|---|---|---|---|---|
| A | 7830 | 7170 | 1 | 1 | 0.01% | 0.01% | 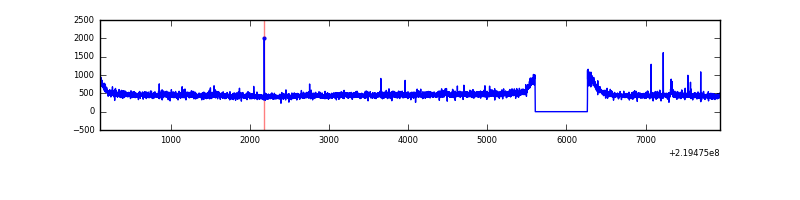 |
| B | 7830 | 7170 | 24 | 24 | 0.31% | 0.33% | 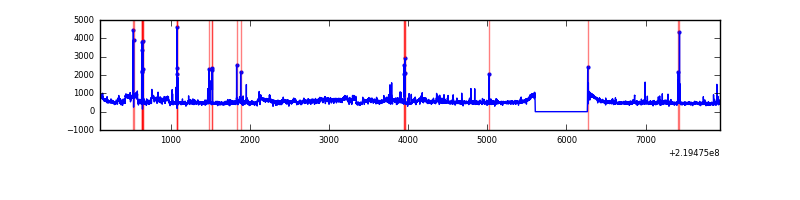 |
| C | 7830 | 7170 | 0 | 0 | 0.00% | 0.00% | 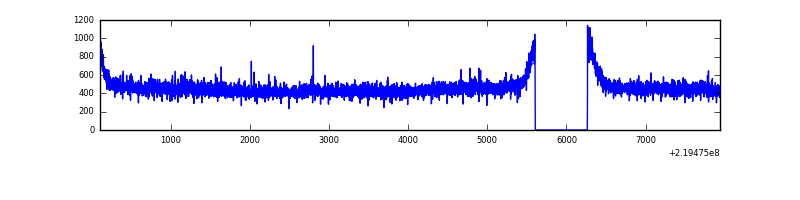 |
| D | 7830 | 7170 | 70 | 70 | 0.89% | 0.98% | 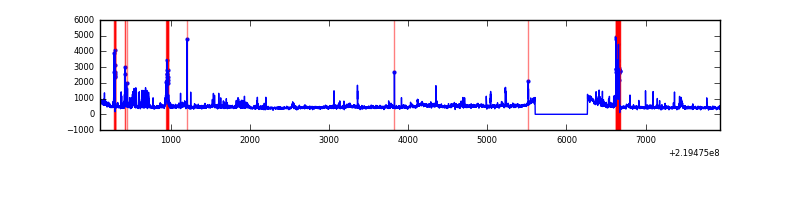 |
Top three noisy pixels from each quadrant. If the there are fewer than three noisy pixels in the level2.evt file, extra rows are filled as -1
| Pixel properties | Quadrant properties | ||||||
|---|---|---|---|---|---|---|---|
| Quadrant | DetID | PixID | Counts | Sigma | Mean | Median | Sigma |
| A | 8 | 15 | 84253 | 483.08 | 846 | 827 | 172.7 |
| A | 13 | 251 | 15542 | 85.21 | 846 | 827 | 172.7 |
| A | 0 | 226 | 8187 | 42.62 | 846 | 827 | 172.7 |
| B | 5 | 143 | 496223 | 2961.97 | 854 | 830 | 167.3 |
| B | 4 | 172 | 94170 | 558.08 | 854 | 830 | 167.3 |
| B | 4 | 81 | 88817 | 526.08 | 854 | 830 | 167.3 |
| C | 9 | 237 | 10578 | 49.76 | 833 | 837 | 195.8 |
| C | 1 | 16 | 8508 | 39.18 | 833 | 837 | 195.8 |
| C | 13 | 61 | 6370 | 28.26 | 833 | 837 | 195.8 |
| D | 2 | 152 | 179503 | 882.12 | 821 | 797 | 202.6 |
| D | 2 | 63 | 160565 | 788.64 | 821 | 797 | 202.6 |
| D | 14 | 34 | 149349 | 733.27 | 821 | 797 | 202.6 |
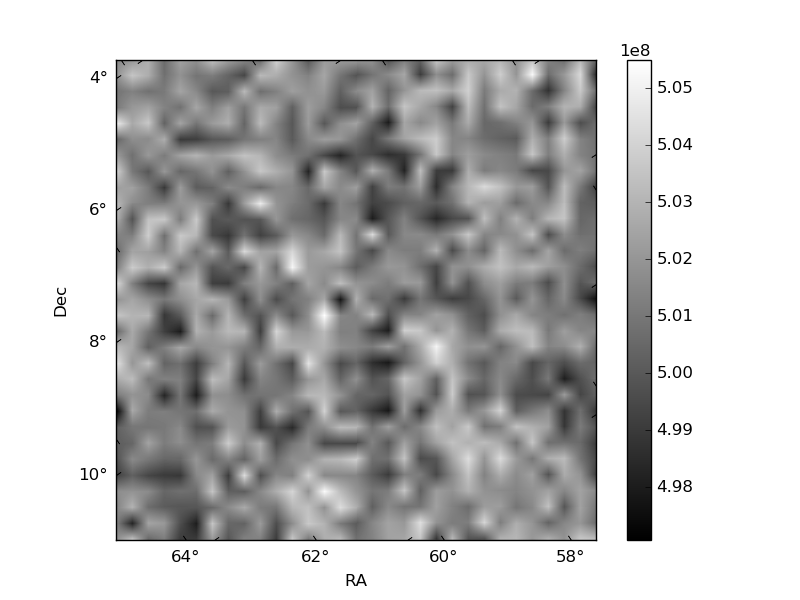
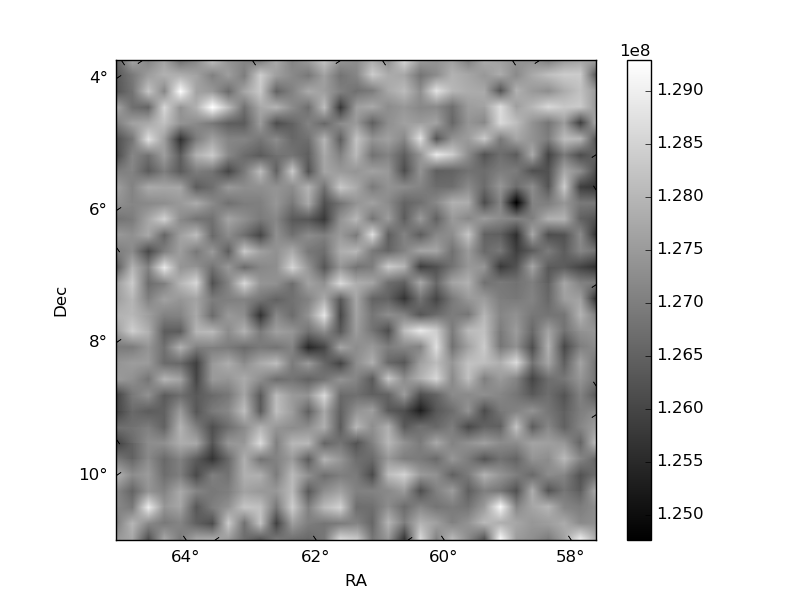
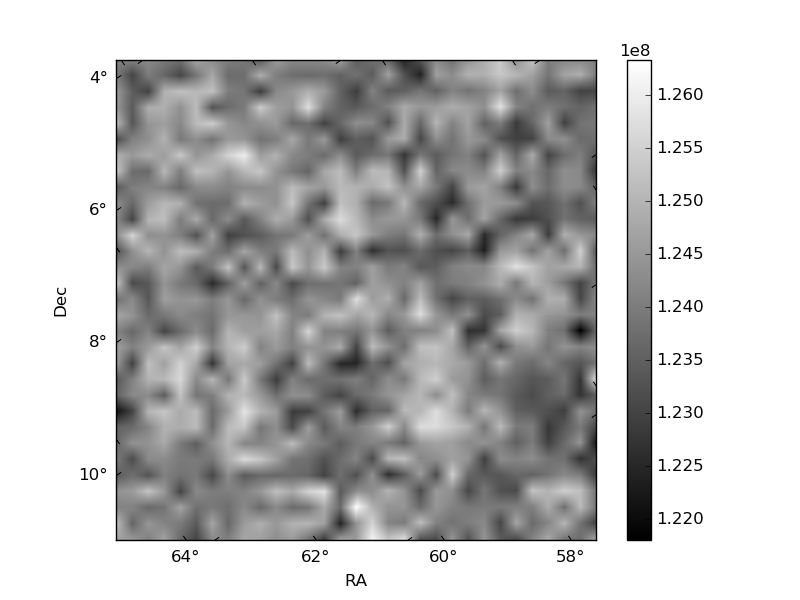
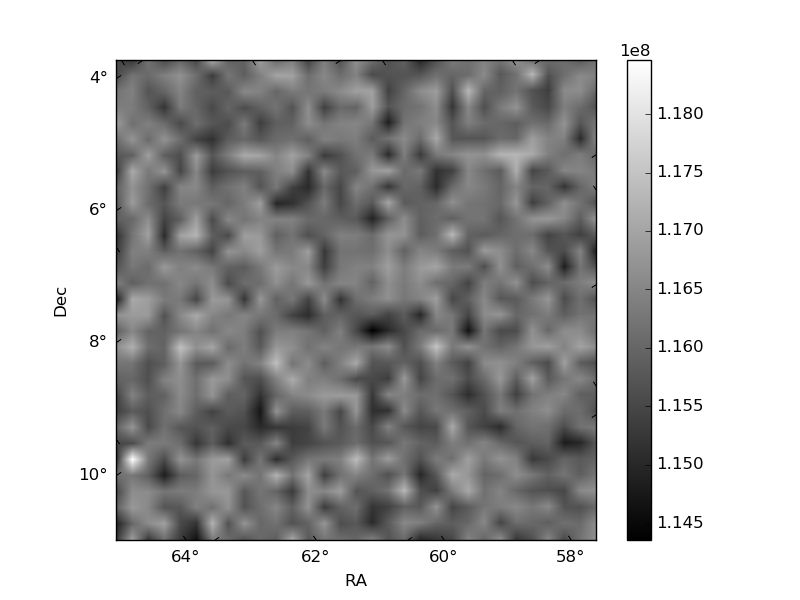
Histogram calculated using DETX and DETY for each event in the final _common_clean file
| Quadrant A | 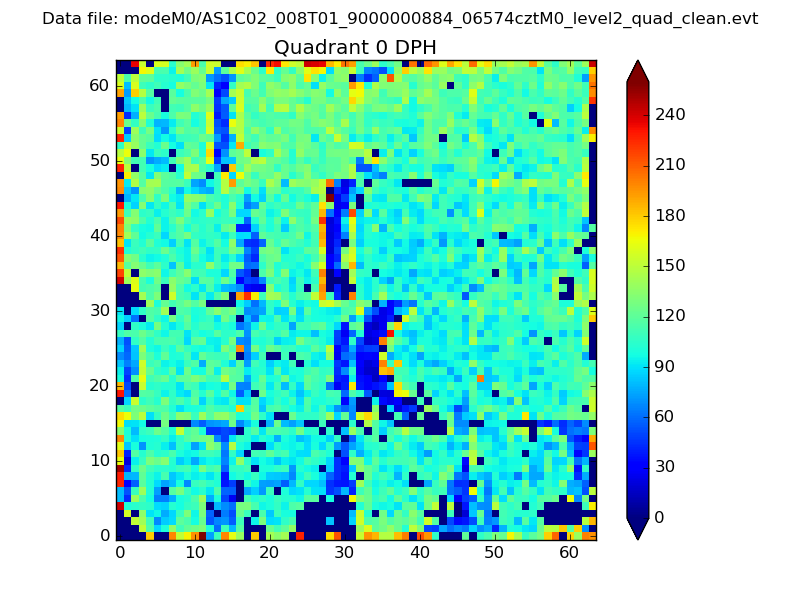 |
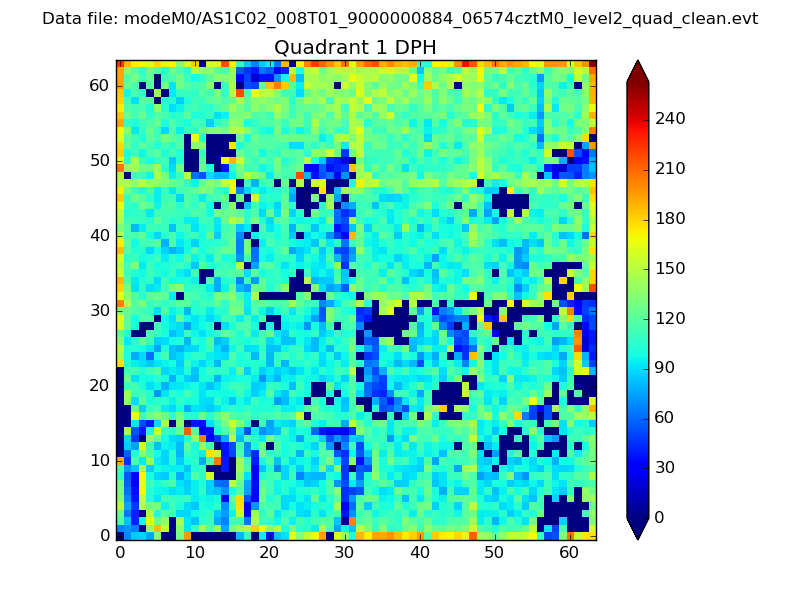 |
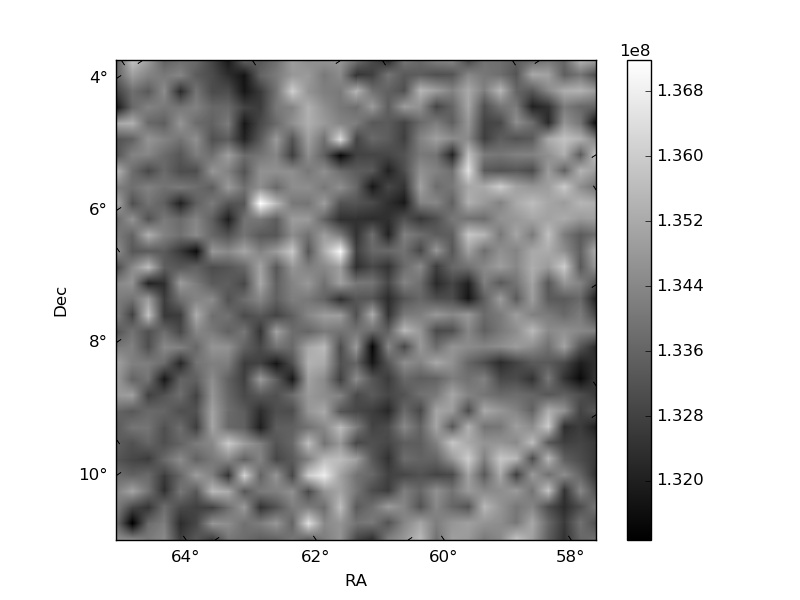
Quadrant B |
|---|---|---|---|
| Quadrant D | 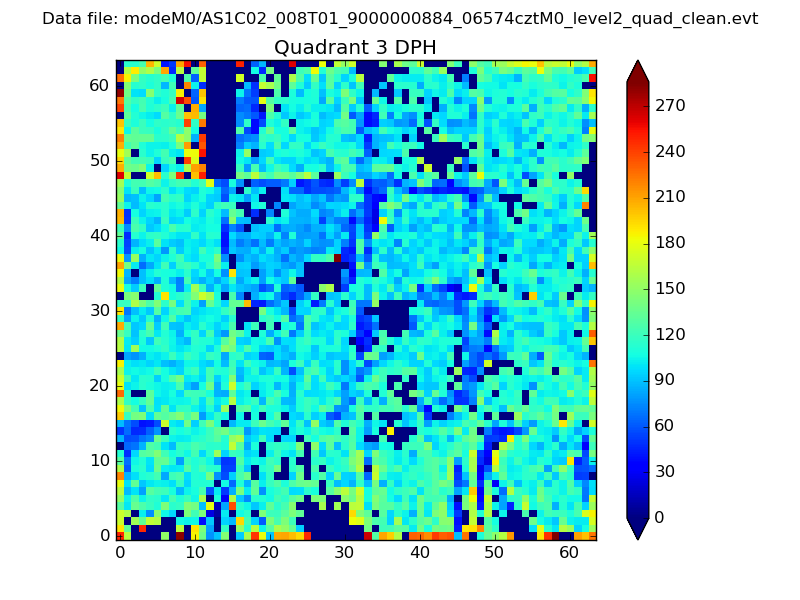 |
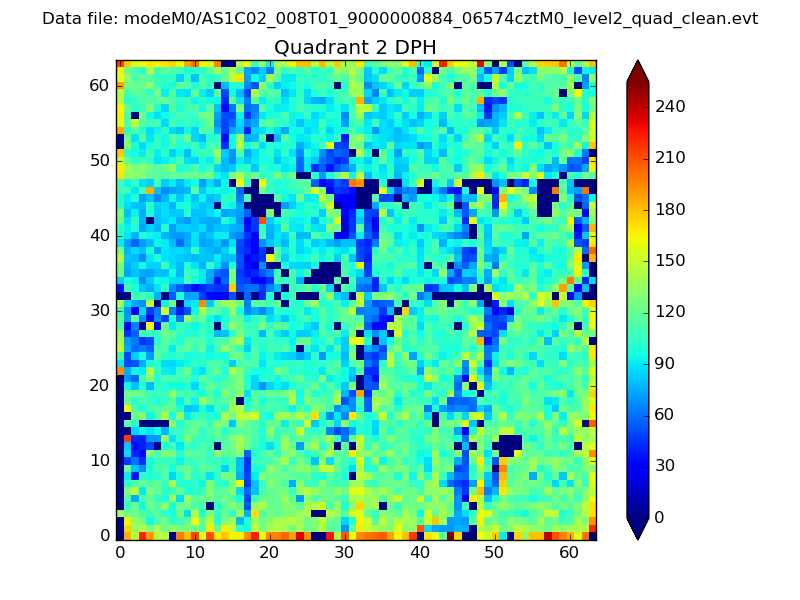 |
Quadrant C |
| Plot type | Count rate plots | Images |
|---|---|---|
| Comparison with Poisson distribution Blue bars denote a histogram of data divided into 1 sec bins. Red curve is a Poisson curve with rate = median count rate of data. |
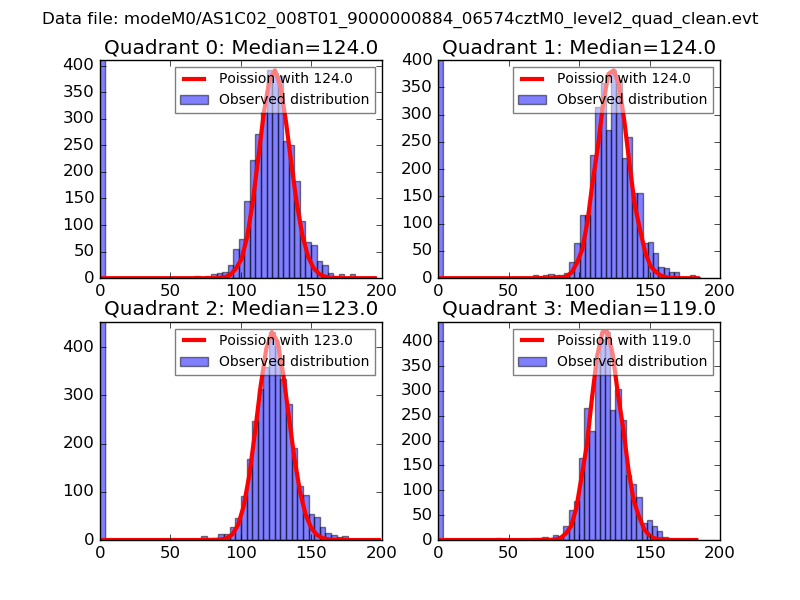 |
 |
| Quadrant-wise count rates Data is divided into 100 sec bins |
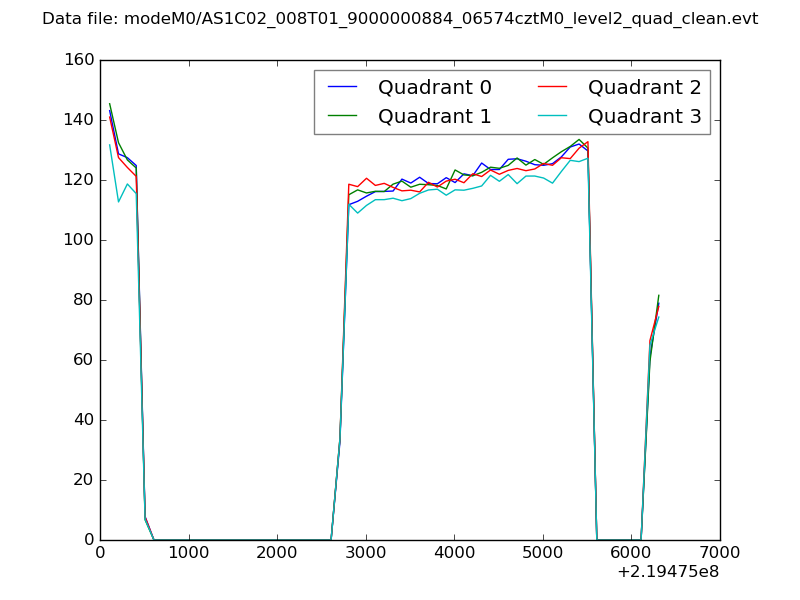 |
|
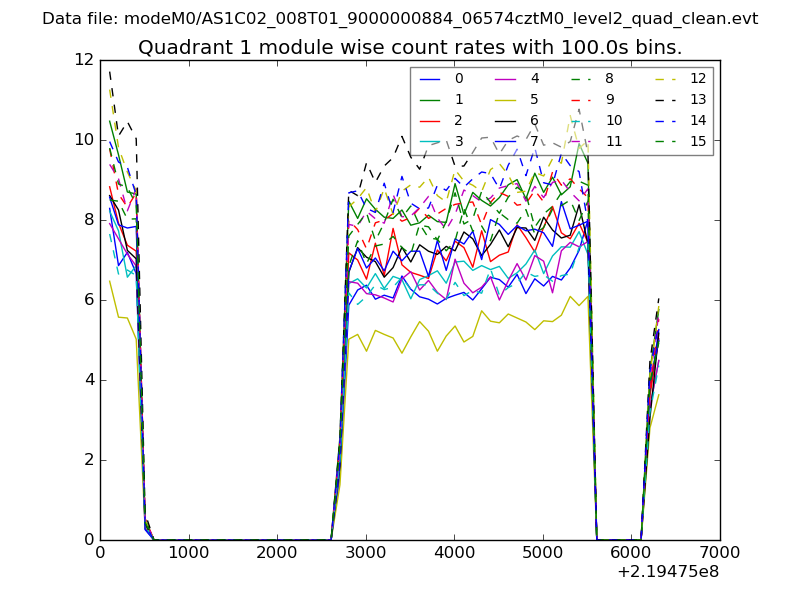
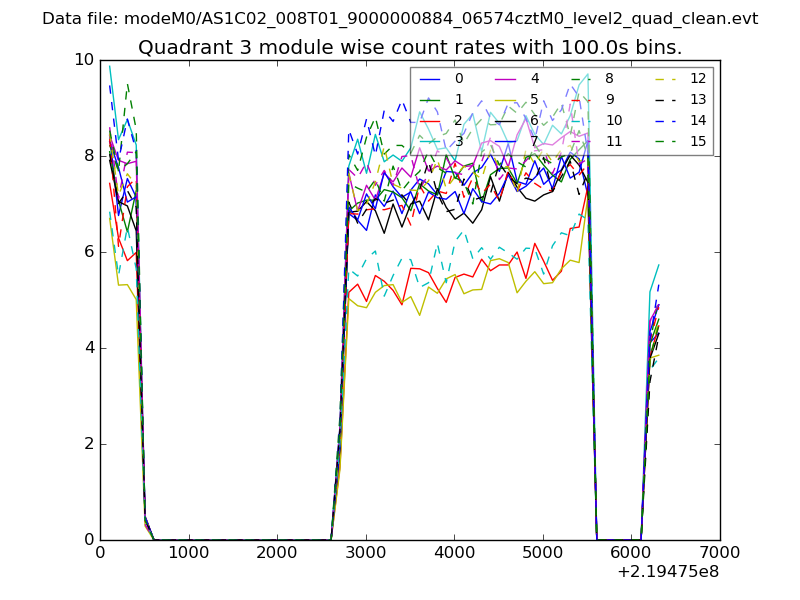
| Module-wise count rates for Quadrant A Data is divided into 100 sec bins |
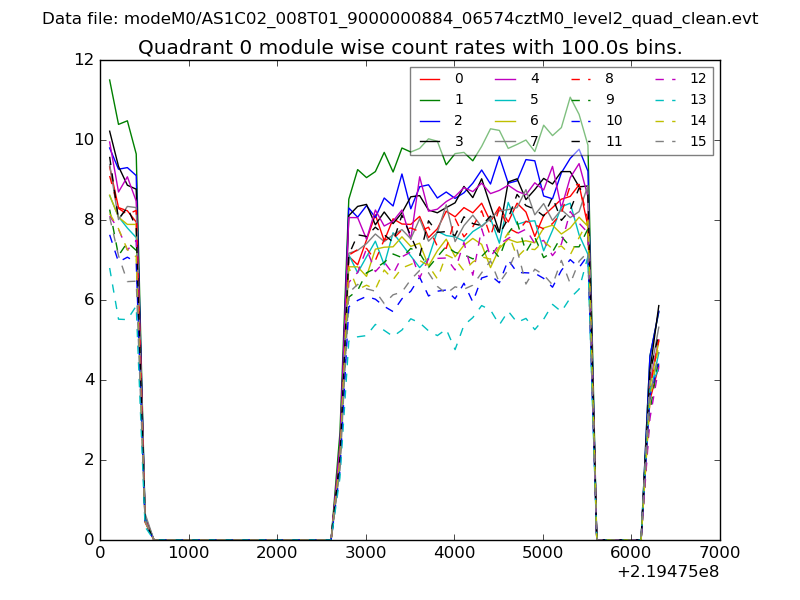 |
 |
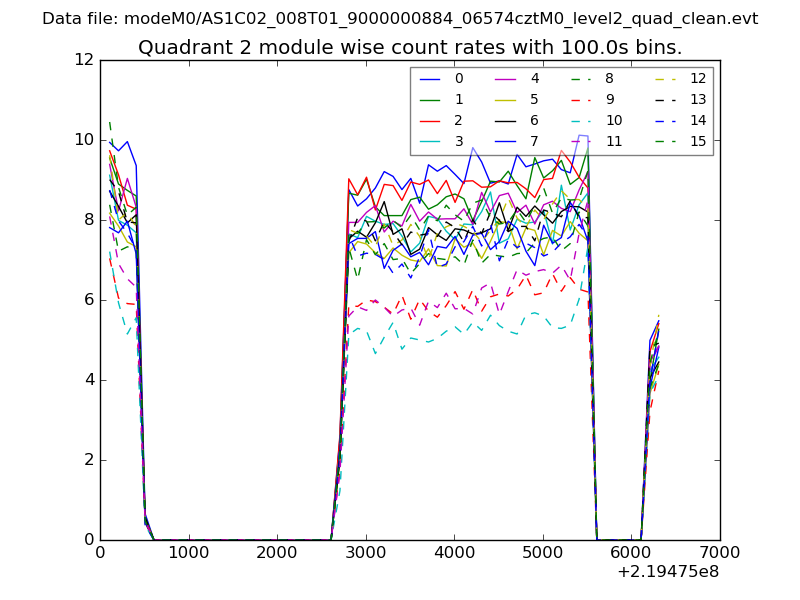
| Module-wise count rates for Quadrant B Data is divided into 100 sec bins |
 |
 |
| Module-wise count rates for Quadrant C Data is divided into 100 sec bins |
 |
 |
| Module-wise count rates for Quadrant D Data is divided into 100 sec bins |
 |
 |
| Parameter | Plot |
|---|---|
| CZT HV Monitor | 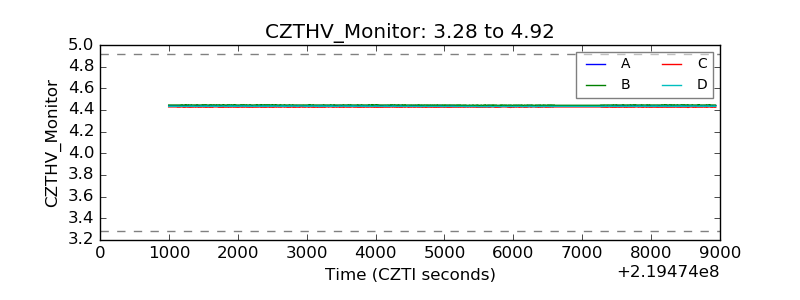 |
| D_VDD | 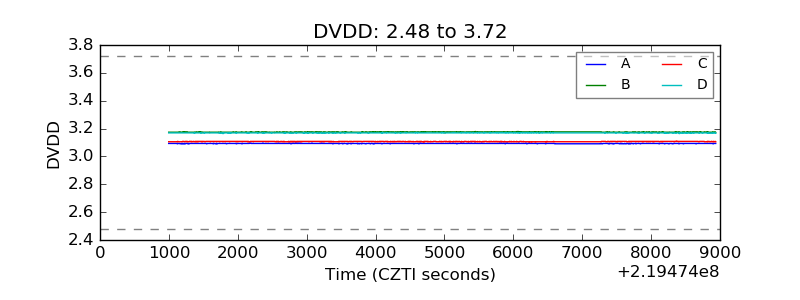 |
| Temperature 1 | 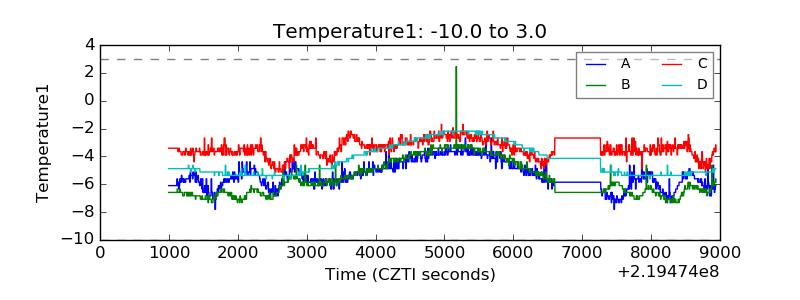 |
| Veto HV Monitor | 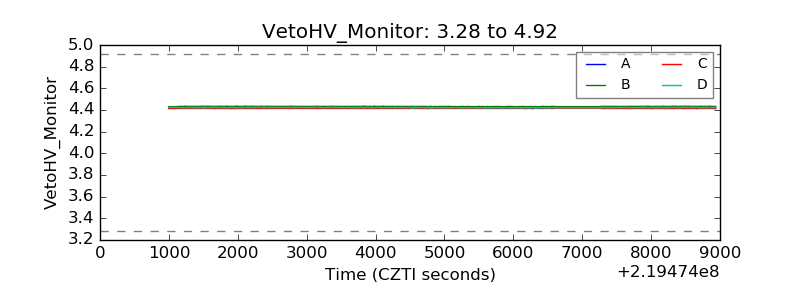 |
| Veto LLD | 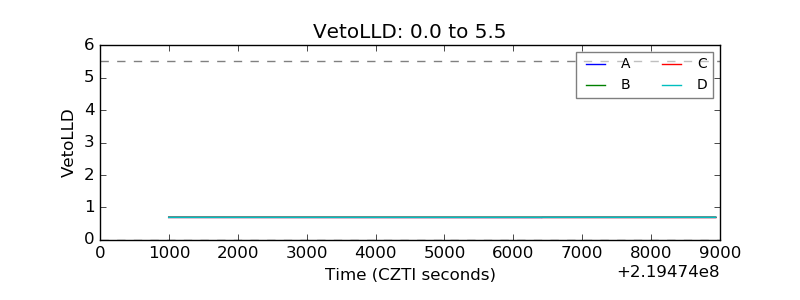 |
| Alpha Counter | 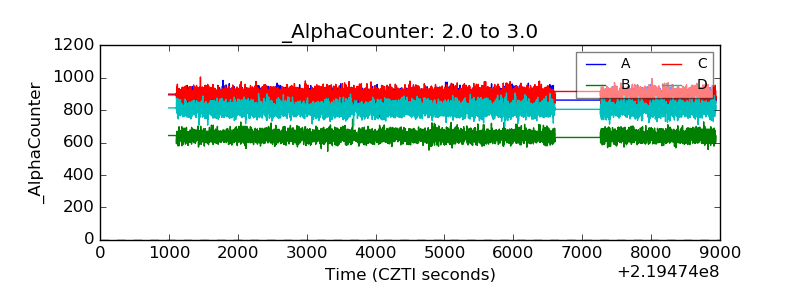 |
| _CPM_Rate | 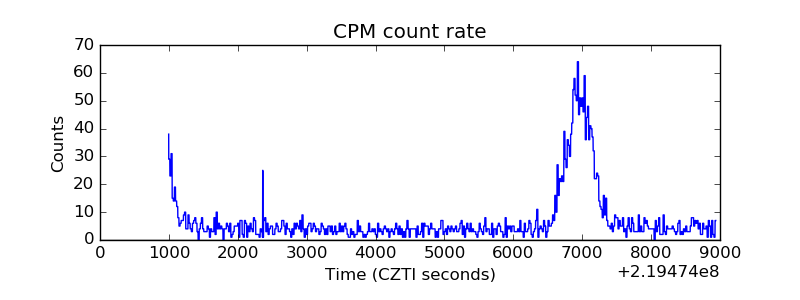 |
| CZT Counter | 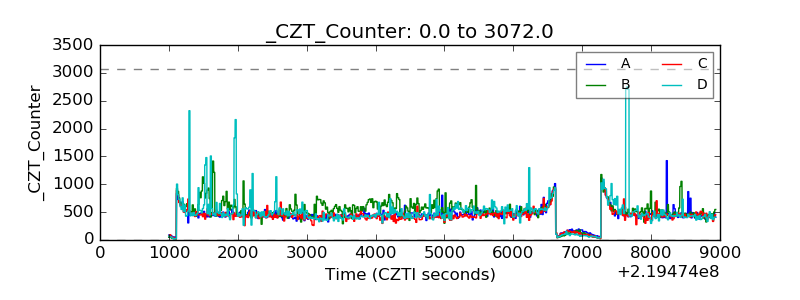 |
| +2.5 Volts monitor | 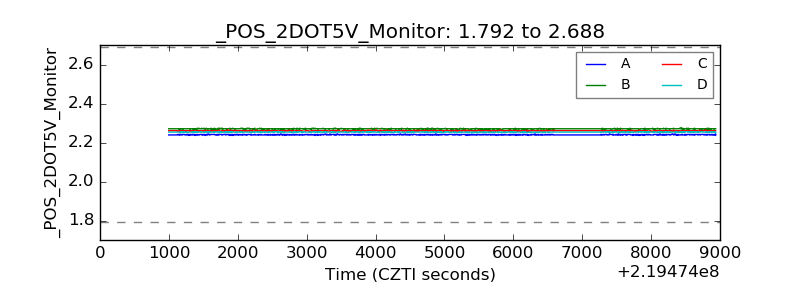 |
| +5 Volts monitor | 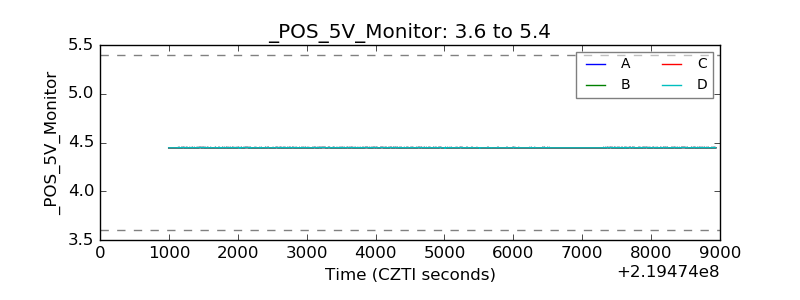 |
| _ROLL_ROT | 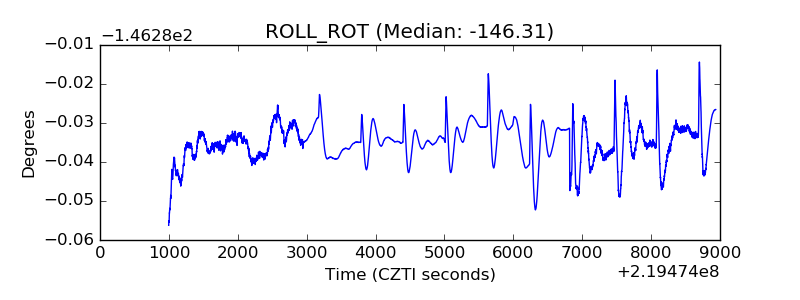 |
| _Roll_DEC | 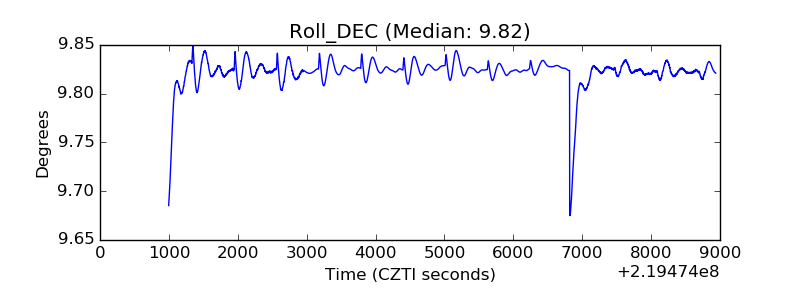 |
| _Roll_RA | 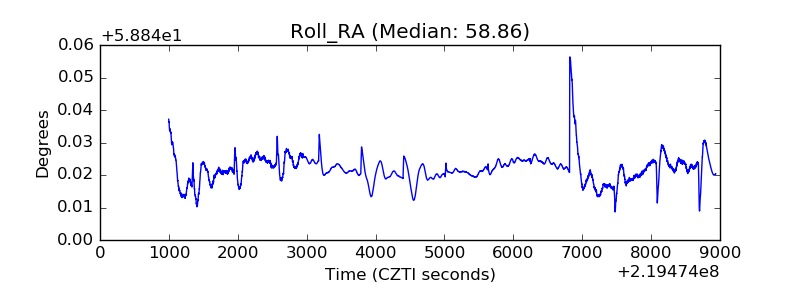 |
| Veto Counter | 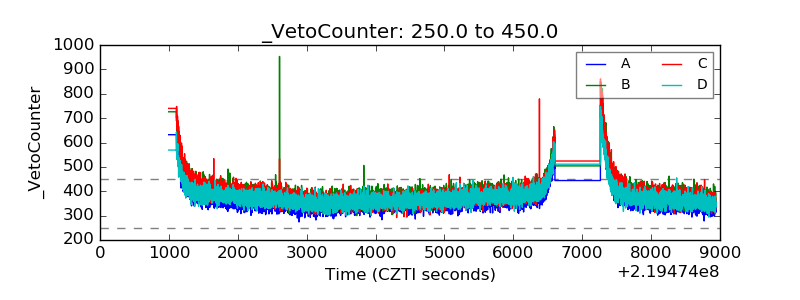 |