| Param | Original file | Final file |
|---|---|---|
| Filename | modeM0/AS1C02_008T01_9000000884_06575cztM0_level2.evt | modeM0/AS1C02_008T01_9000000884_06575cztM0_level2_quad_clean.evt |
| Size (bytes) | 535,152,960 | 75,510,720 |
| Size | 510.4 MB | 72.0 MB |
| Events in quadrant A | 3,632,371 | 442,422 |
| Events in quadrant B | 3,844,822 | 445,345 |
| Events in quadrant C | 3,552,101 | 440,795 |
| Events in quadrant D | 4,656,623 | 423,988 |
| Mode M0 | |||
|---|---|---|---|
| Quadrant | BADHDUFLAG | Total packets | Discarded packets |
| A | 0 | 16071 | 4 |
| B | 0 | 16392 | 3 |
| C | 0 | 16007 | 3 |
| D | 0 | 19308 | 3 |
| Mode M9 | |||
|---|---|---|---|
| Quadrant | BADHDUFLAG | Total packets | Discarded packets |
| A | 0 | 5 | 0 |
| B | 0 | 5 | 0 |
| C | 0 | 5 | 0 |
| D | 0 | 6 | 0 |
| Mode SS | |||
|---|---|---|---|
| Quadrant | BADHDUFLAG | Total packets | Discarded packets |
| A | 0 | 156 | 0 |
| B | 0 | 156 | 0 |
| C | 0 | 156 | 0 |
| D | 0 | 156 | 0 |
| Quadrant | Total seconds | Saturated seconds | Saturation percentage |
|---|---|---|---|
| A | 7673 | 204 | 2.658673% |
| B | 7673 | 241 | 3.140884% |
| C | 7673 | 147 | 1.915809% |
| D | 7673 | 275 | 3.583996% |
Noise dominated data is calculated using 1-second bins in cleaned event files. If a bin has >2000 counts, and if more than 50% of those come from <1% of pixels, then it is considered to be noise-dominated and hence unusable.
| Quadrant | # 1 sec bins | Bins with >0 counts | Bins with >2000 counts | High rate bins dominated by noise | Noise dominated (total time) | Noise dominated (detector-on time) | Marked lightcurve |
|---|---|---|---|---|---|---|---|
| A | 7878 | 7675 | 0 | 0 | 0.00% | 0.00% | 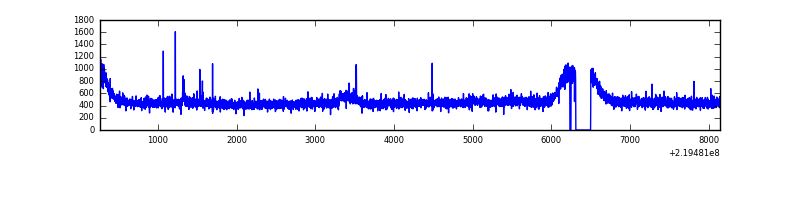 |
| B | 7878 | 7675 | 6 | 6 | 0.08% | 0.08% | 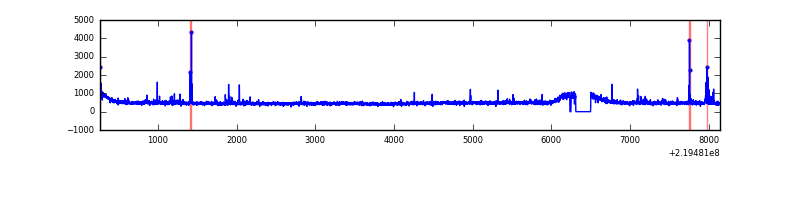 |
| C | 7878 | 7675 | 0 | 0 | 0.00% | 0.00% | 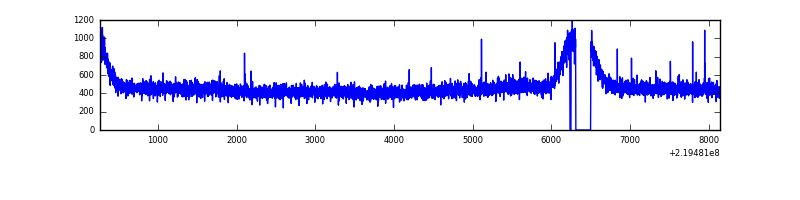 |
| D | 7878 | 7675 | 140 | 140 | 1.78% | 1.82% | 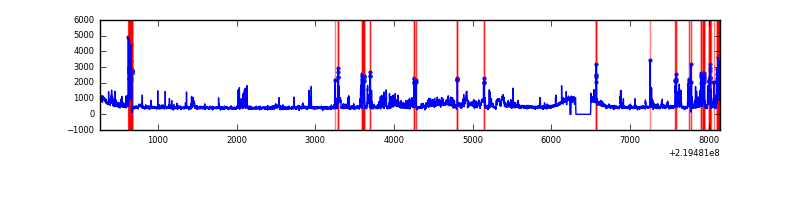 |
Top three noisy pixels from each quadrant. If the there are fewer than three noisy pixels in the level2.evt file, extra rows are filled as -1
| Pixel properties | Quadrant properties | ||||||
|---|---|---|---|---|---|---|---|
| Quadrant | DetID | PixID | Counts | Sigma | Mean | Median | Sigma |
| A | 15 | 239 | 40971 | 212.15 | 921 | 899 | 188.9 |
| A | 8 | 15 | 28391 | 145.55 | 921 | 899 | 188.9 |
| A | 13 | 251 | 16052 | 80.22 | 921 | 899 | 188.9 |
| B | 0 | 198 | 73260 | 395.97 | 932 | 909 | 182.7 |
| B | 4 | 81 | 45988 | 246.71 | 932 | 909 | 182.7 |
| B | 4 | 172 | 40957 | 219.18 | 932 | 909 | 182.7 |
| C | 13 | 61 | 7058 | 28.61 | 907 | 910 | 214.9 |
| C | 9 | 237 | 6307 | 25.11 | 907 | 910 | 214.9 |
| C | 1 | 16 | 4756 | 17.9 | 907 | 910 | 214.9 |
| D | 2 | 63 | 783890 | 3516.78 | 895 | 867 | 222.7 |
| D | 2 | 33 | 398275 | 1784.87 | 895 | 867 | 222.7 |
| D | 2 | 152 | 41010 | 180.29 | 895 | 867 | 222.7 |
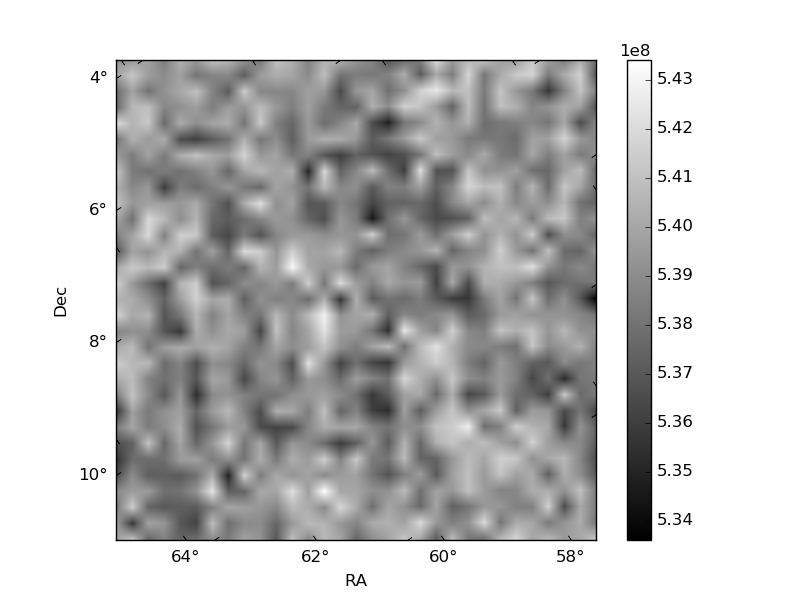
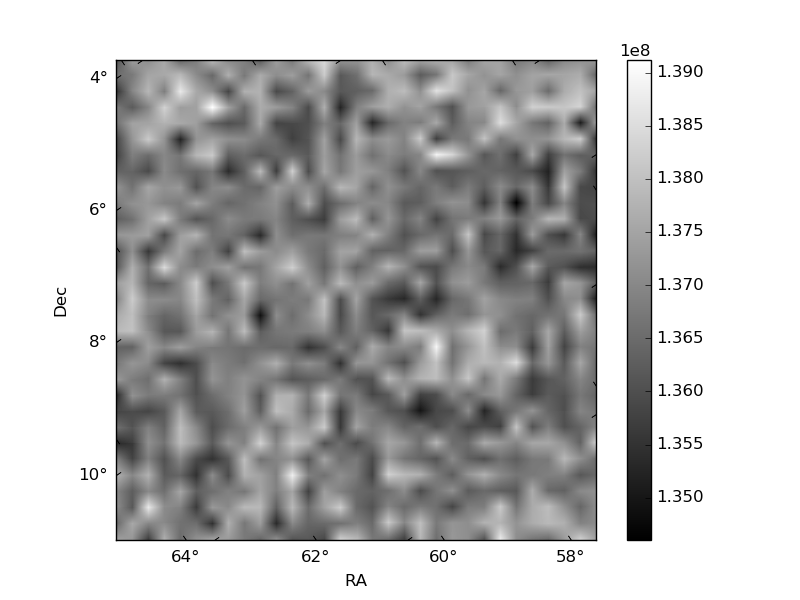
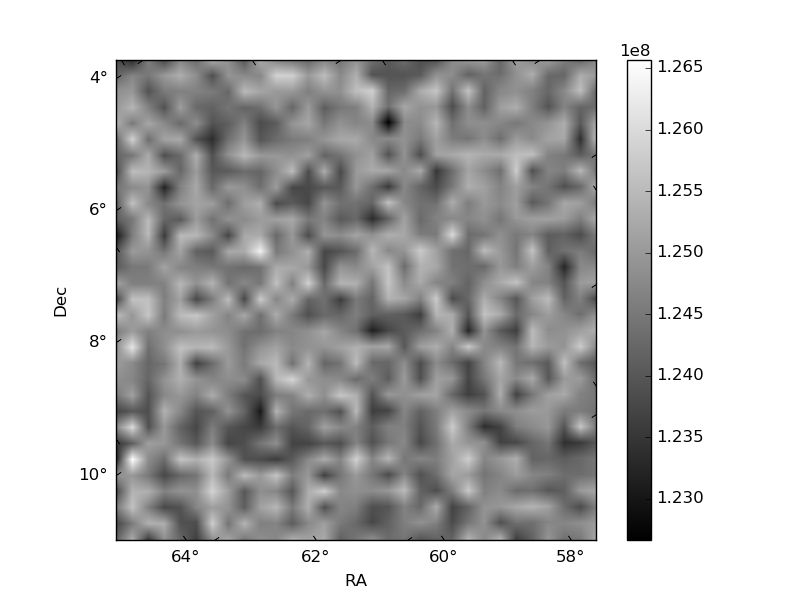
Histogram calculated using DETX and DETY for each event in the final _common_clean file
| Quadrant A | 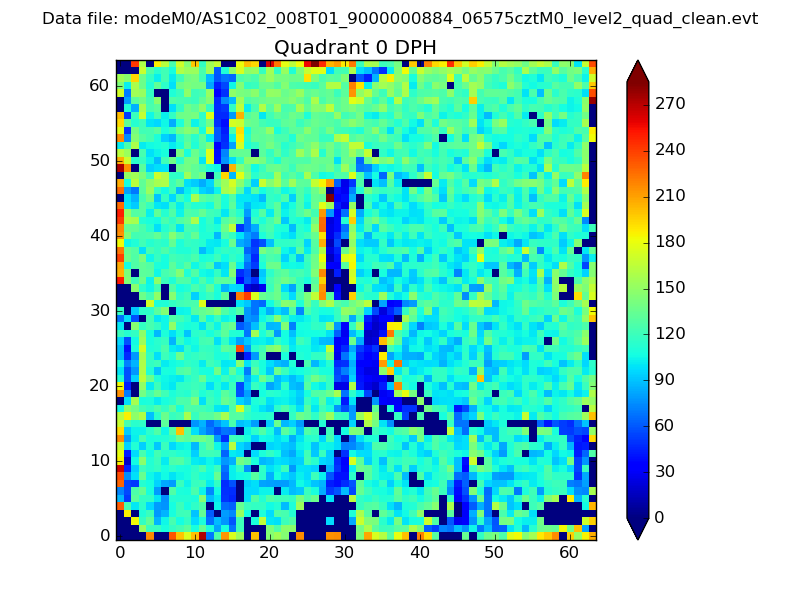 |
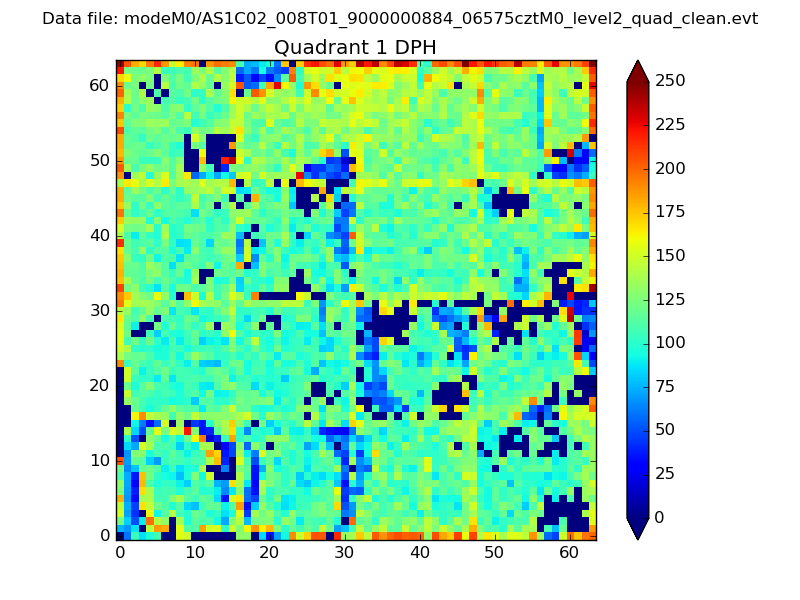 |
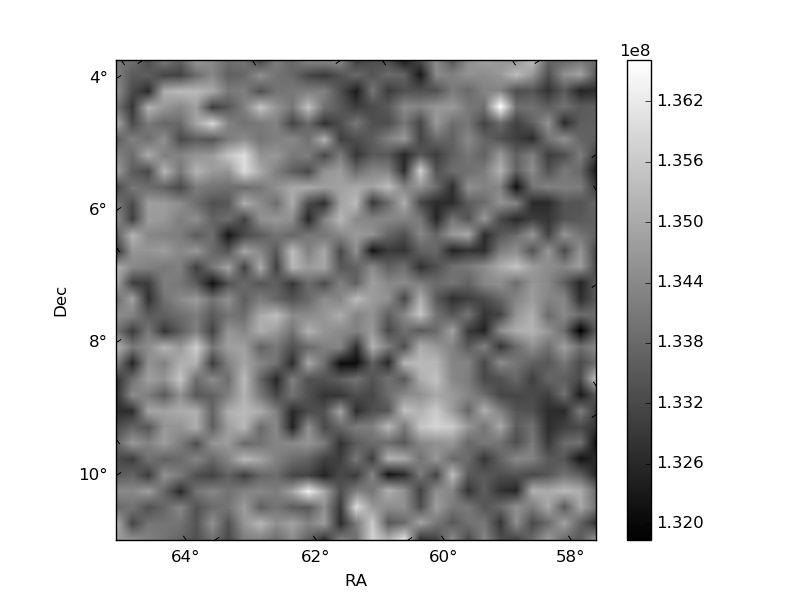
Quadrant B |
|---|---|---|---|
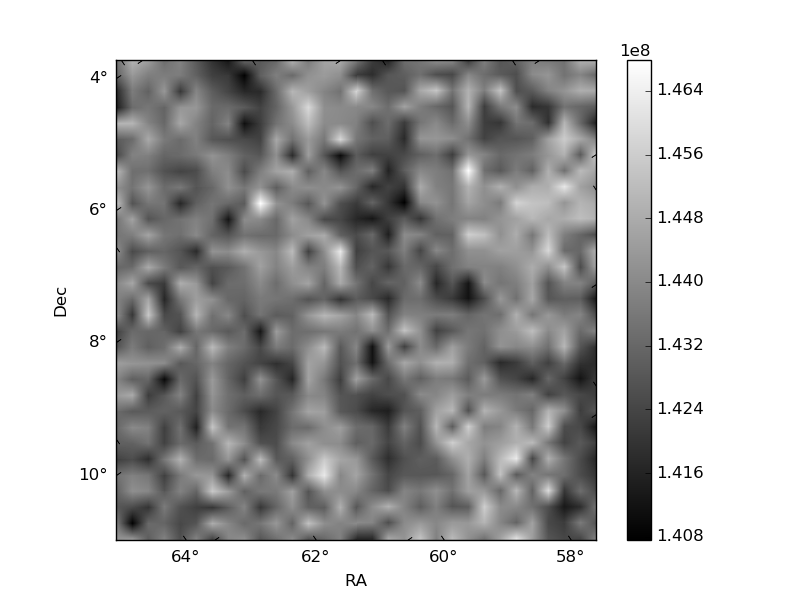
| Quadrant D | 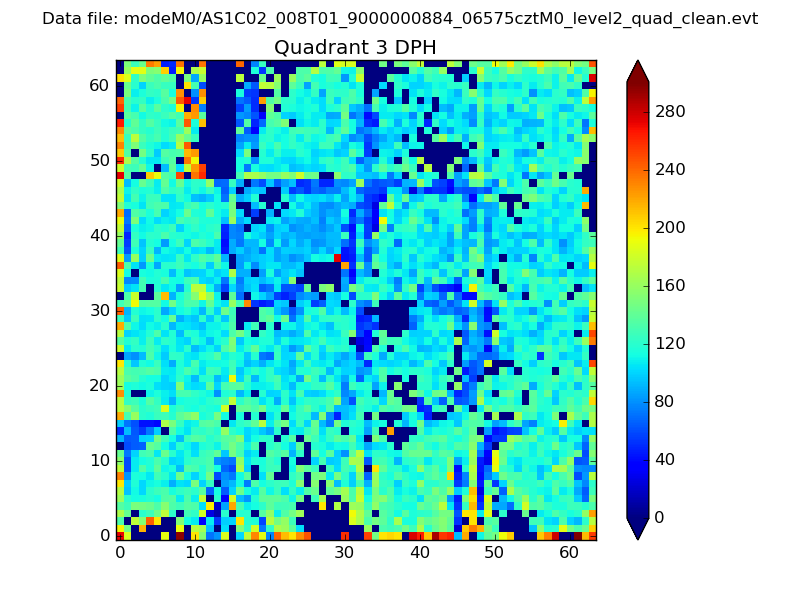 |
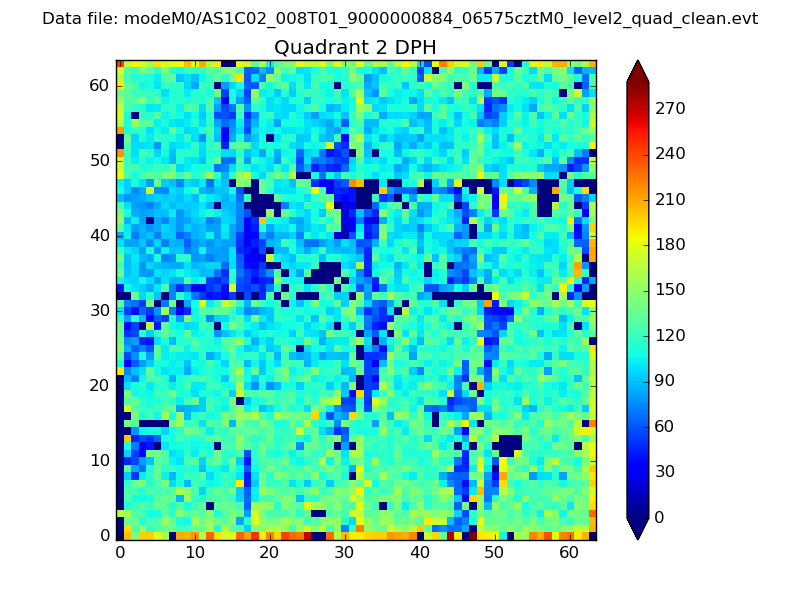 |
Quadrant C |
| Plot type | Count rate plots | Images |
|---|---|---|
| Comparison with Poisson distribution Blue bars denote a histogram of data divided into 1 sec bins. Red curve is a Poisson curve with rate = median count rate of data. |
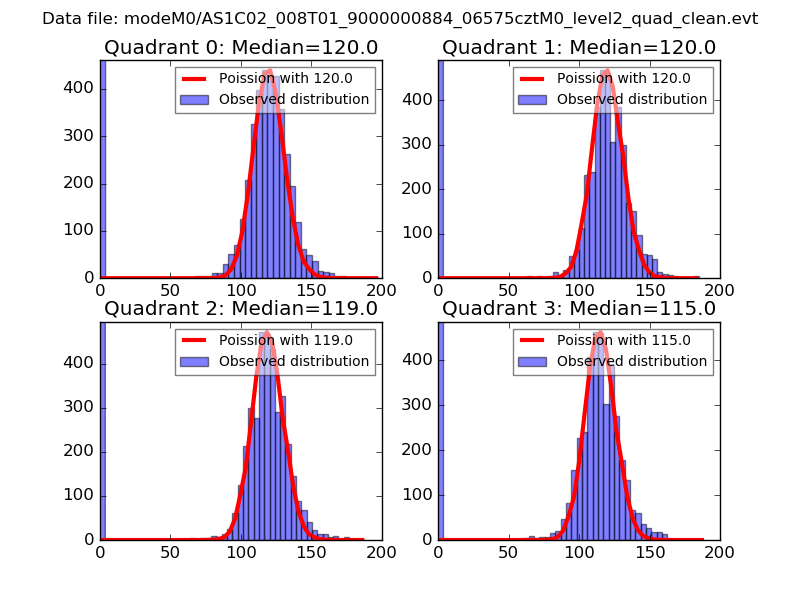 |
 |
| Quadrant-wise count rates Data is divided into 100 sec bins |
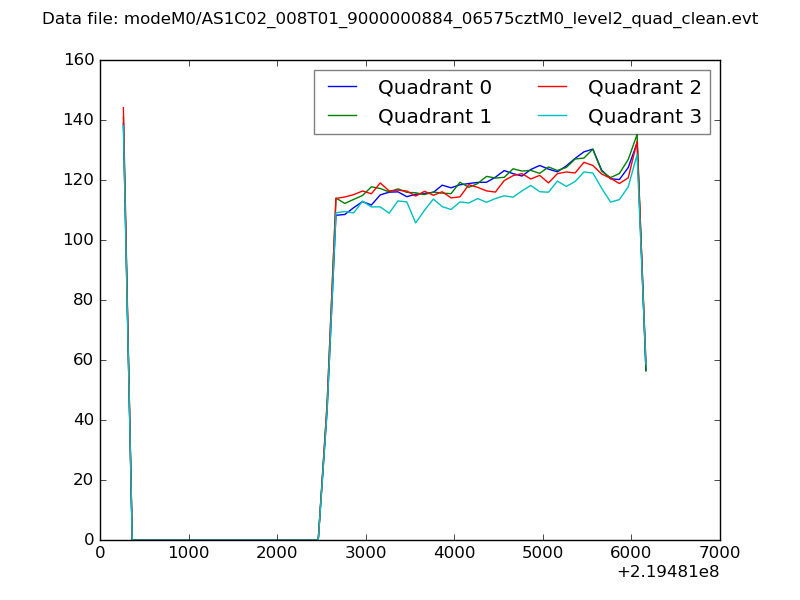 |
|
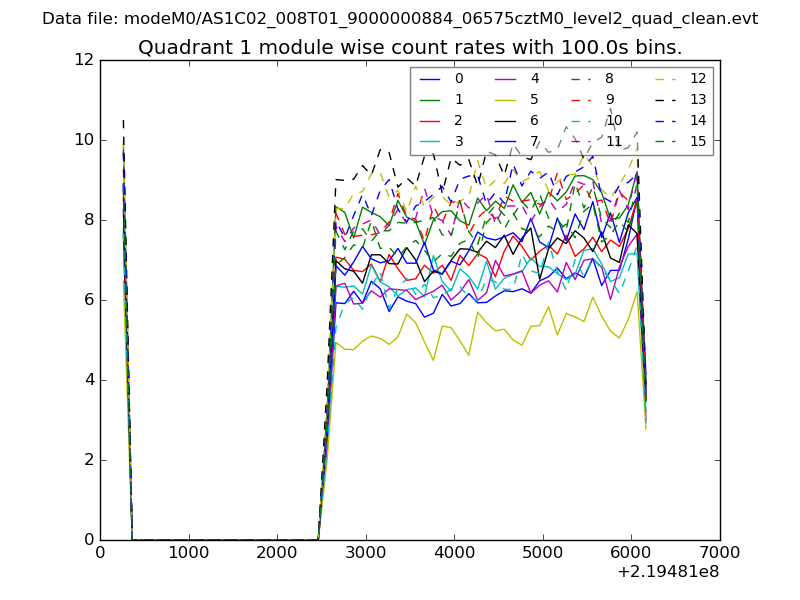
| Module-wise count rates for Quadrant A Data is divided into 100 sec bins |
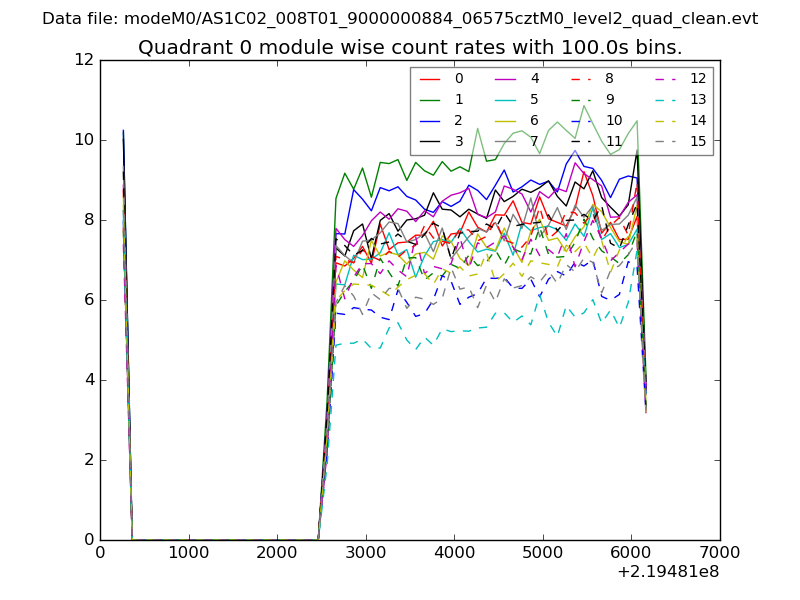 |
 |
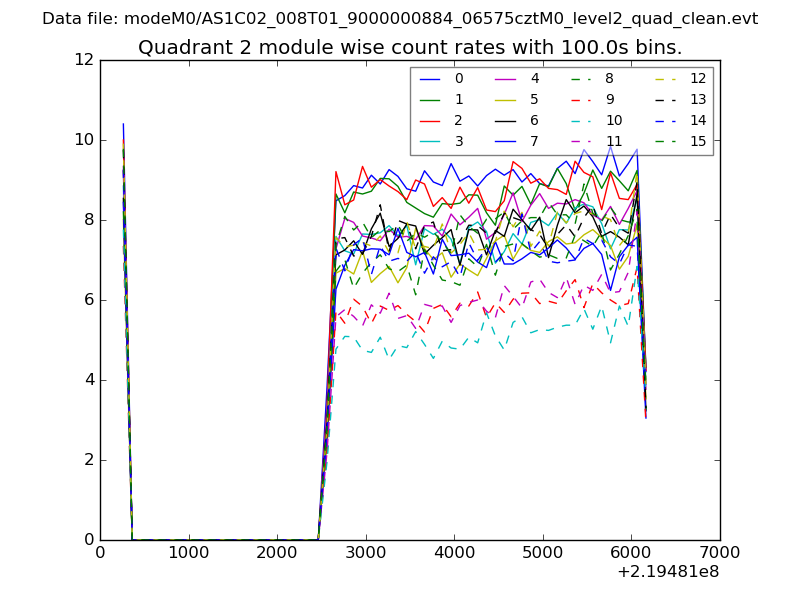
| Module-wise count rates for Quadrant B Data is divided into 100 sec bins |
 |
 |
| Module-wise count rates for Quadrant C Data is divided into 100 sec bins |
 |
 |
| Module-wise count rates for Quadrant D Data is divided into 100 sec bins |
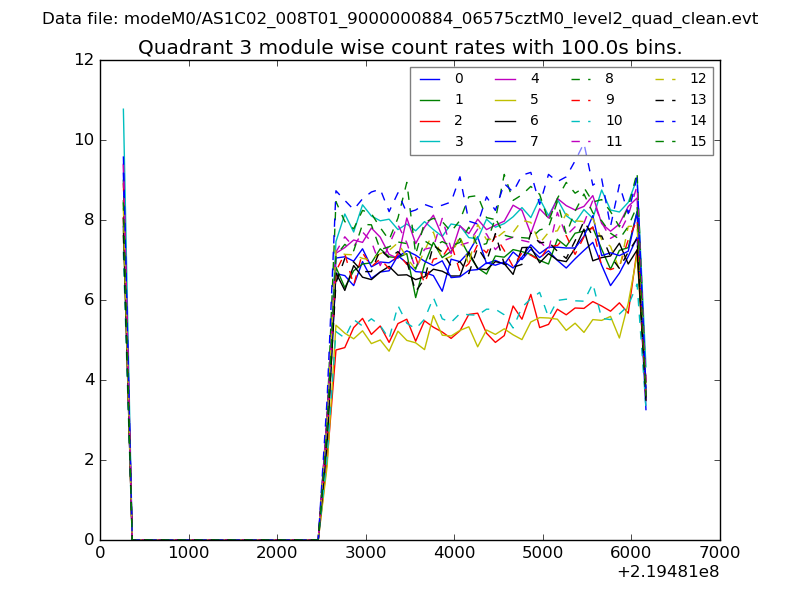 |
 |
| Parameter | Plot |
|---|---|
| CZT HV Monitor |  |
| D_VDD | 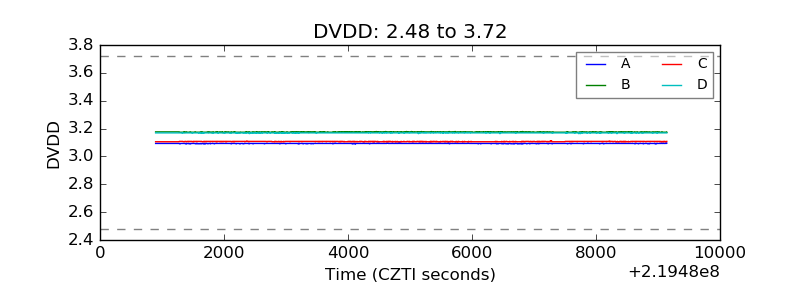 |
| Temperature 1 | 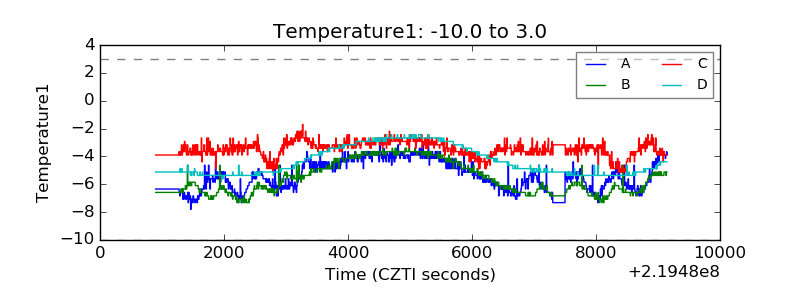 |
| Veto HV Monitor | 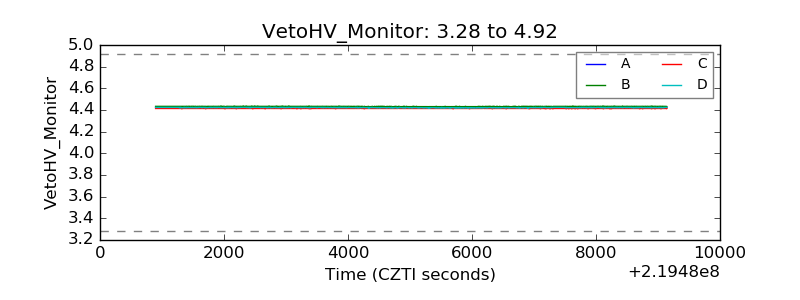 |
| Veto LLD | 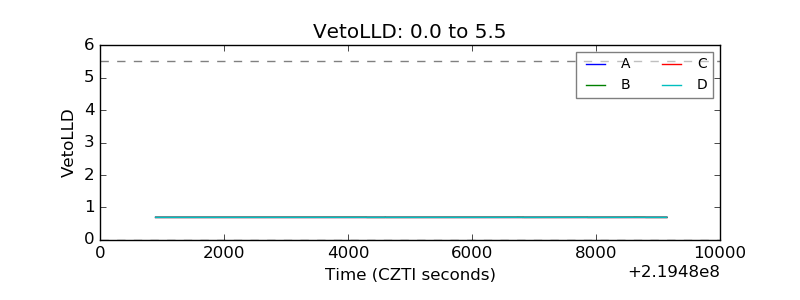 |
| Alpha Counter | 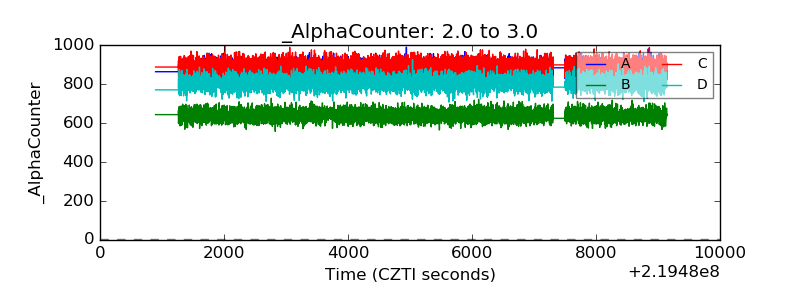 |
| _CPM_Rate | 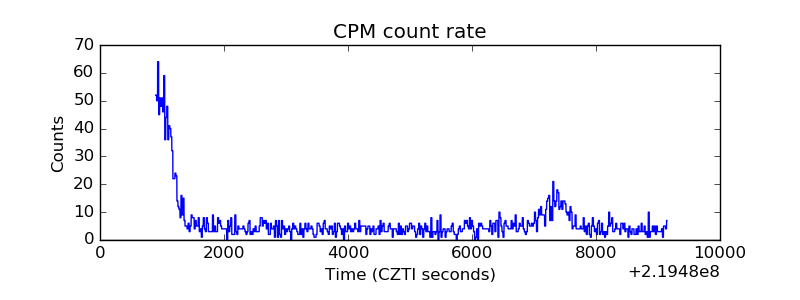 |
| CZT Counter | 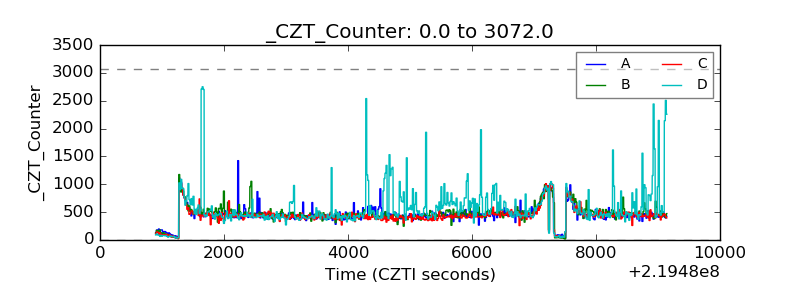 |
| +2.5 Volts monitor | 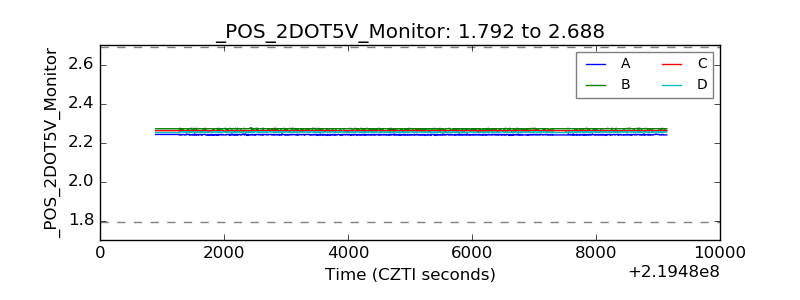 |
| +5 Volts monitor | 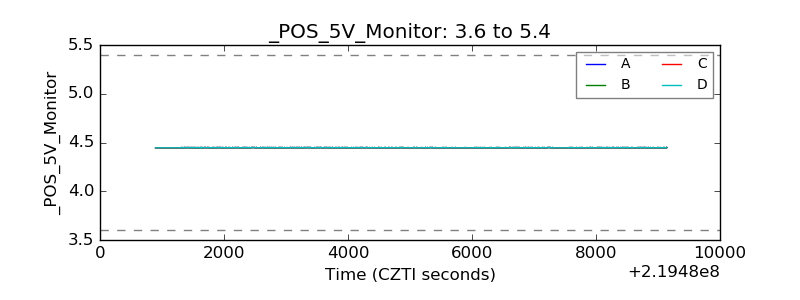 |
| _ROLL_ROT | 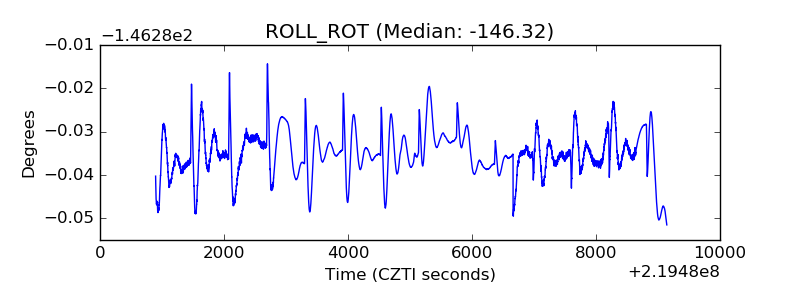 |
| _Roll_DEC | 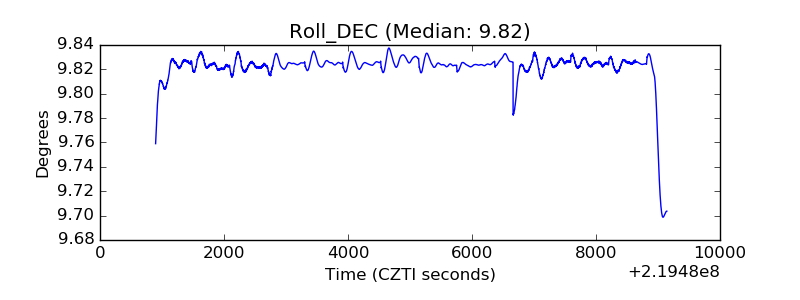 |
| _Roll_RA | 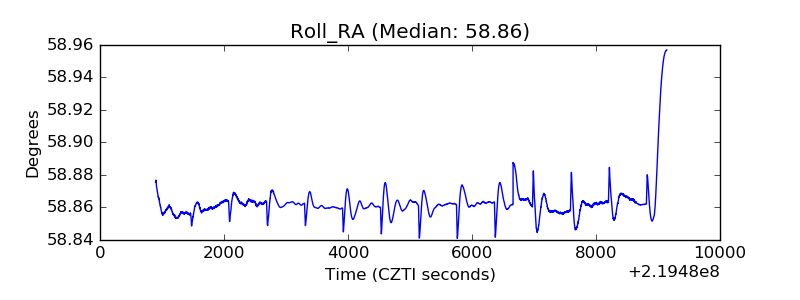 |
| Veto Counter | 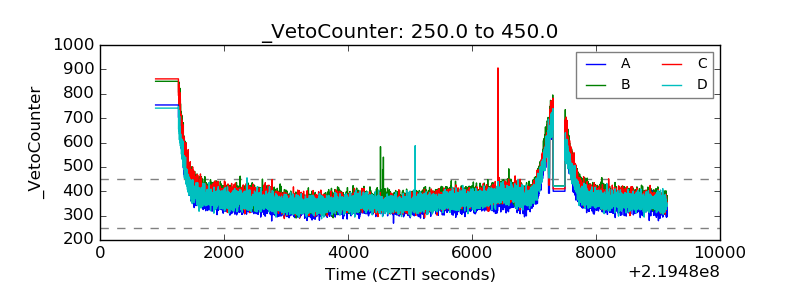 |