| Param | Original file | Final file |
|---|---|---|
| Filename | modeM0/AS1C02_008T01_9000000884_06576cztM0_level2.evt | modeM0/AS1C02_008T01_9000000884_06576cztM0_level2_quad_clean.evt |
| Size (bytes) | 604,581,120 | 84,467,520 |
| Size | 576.6 MB | 80.6 MB |
| Events in quadrant A | 4,088,521 | 498,504 |
| Events in quadrant B | 4,417,683 | 498,905 |
| Events in quadrant C | 4,027,404 | 495,537 |
| Events in quadrant D | 5,199,347 | 474,597 |
| Mode M0 | |||
|---|---|---|---|
| Quadrant | BADHDUFLAG | Total packets | Discarded packets |
| A | 0 | 17925 | 4 |
| B | 0 | 18656 | 3 |
| C | 0 | 17952 | 3 |
| D | 0 | 21381 | 3 |
| Mode M9 | |||
|---|---|---|---|
| Quadrant | BADHDUFLAG | Total packets | Discarded packets |
| A | 0 | 2 | 0 |
| B | 0 | 2 | 0 |
| C | 0 | 2 | 0 |
| D | 0 | 2 | 0 |
| Mode SS | |||
|---|---|---|---|
| Quadrant | BADHDUFLAG | Total packets | Discarded packets |
| A | 0 | 172 | 0 |
| B | 0 | 172 | 0 |
| C | 0 | 172 | 0 |
| D | 0 | 172 | 0 |
| Quadrant | Total seconds | Saturated seconds | Saturation percentage |
|---|---|---|---|
| A | 8495 | 404 | 4.755739% |
| B | 8495 | 448 | 5.273690% |
| C | 8495 | 290 | 3.413773% |
| D | 8495 | 579 | 6.815774% |
Noise dominated data is calculated using 1-second bins in cleaned event files. If a bin has >2000 counts, and if more than 50% of those come from <1% of pixels, then it is considered to be noise-dominated and hence unusable.
| Quadrant | # 1 sec bins | Bins with >0 counts | Bins with >2000 counts | High rate bins dominated by noise | Noise dominated (total time) | Noise dominated (detector-on time) | Marked lightcurve |
|---|---|---|---|---|---|---|---|
| A | 8740 | 8498 | 0 | 0 | 0.00% | 0.00% | 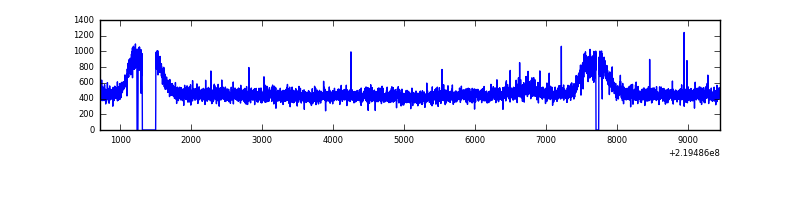 |
| B | 8740 | 8498 | 13 | 13 | 0.15% | 0.15% | 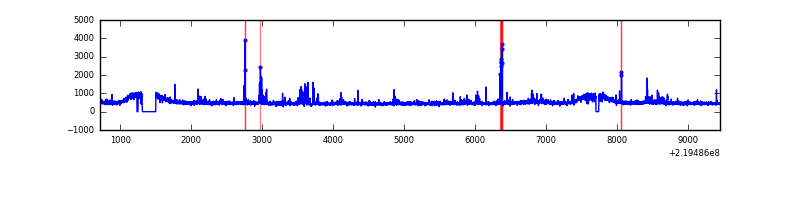 |
| C | 8740 | 8498 | 0 | 0 | 0.00% | 0.00% | 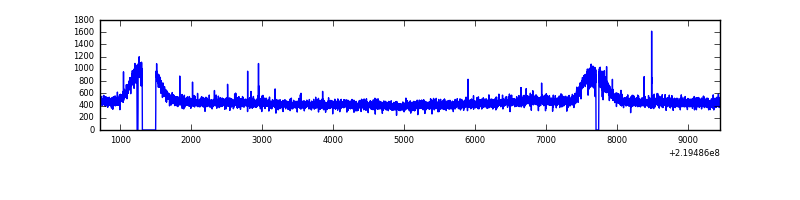 |
| D | 8740 | 8498 | 179 | 179 | 2.05% | 2.11% | 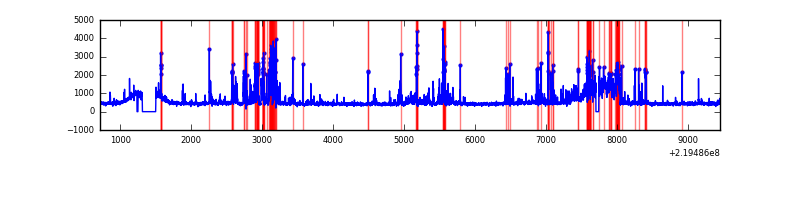 |
Top three noisy pixels from each quadrant. If the there are fewer than three noisy pixels in the level2.evt file, extra rows are filled as -1
| Pixel properties | Quadrant properties | ||||||
|---|---|---|---|---|---|---|---|
| Quadrant | DetID | PixID | Counts | Sigma | Mean | Median | Sigma |
| A | 8 | 15 | 56578 | 256.92 | 1047 | 1019 | 216.2 |
| A | 0 | 226 | 9873 | 40.94 | 1047 | 1019 | 216.2 |
| A | 12 | 194 | 9315 | 38.36 | 1047 | 1019 | 216.2 |
| B | 0 | 219 | 85092 | 406.43 | 1051 | 1022 | 206.9 |
| B | 4 | 81 | 63227 | 300.72 | 1051 | 1022 | 206.9 |
| B | 3 | 220 | 60337 | 286.75 | 1051 | 1022 | 206.9 |
| C | 13 | 61 | 8012 | 28.74 | 1029 | 1031 | 242.9 |
| C | 12 | 4 | 5899 | 20.04 | 1029 | 1031 | 242.9 |
| C | 9 | 237 | 4256 | 13.28 | 1029 | 1031 | 242.9 |
| D | 2 | 33 | 742769 | 2976.02 | 1004 | 970 | 249.3 |
| D | 1 | 239 | 369100 | 1476.9 | 1004 | 970 | 249.3 |
| D | 12 | 233 | 136136 | 542.27 | 1004 | 970 | 249.3 |
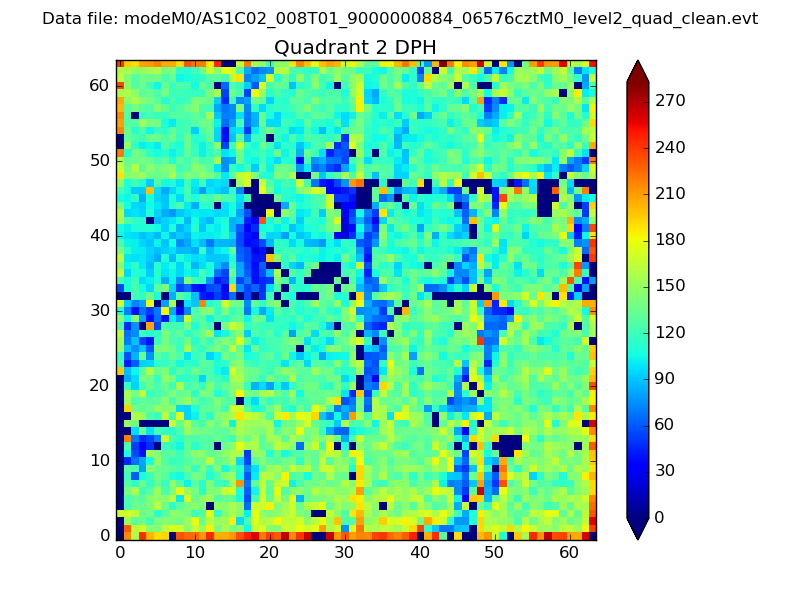
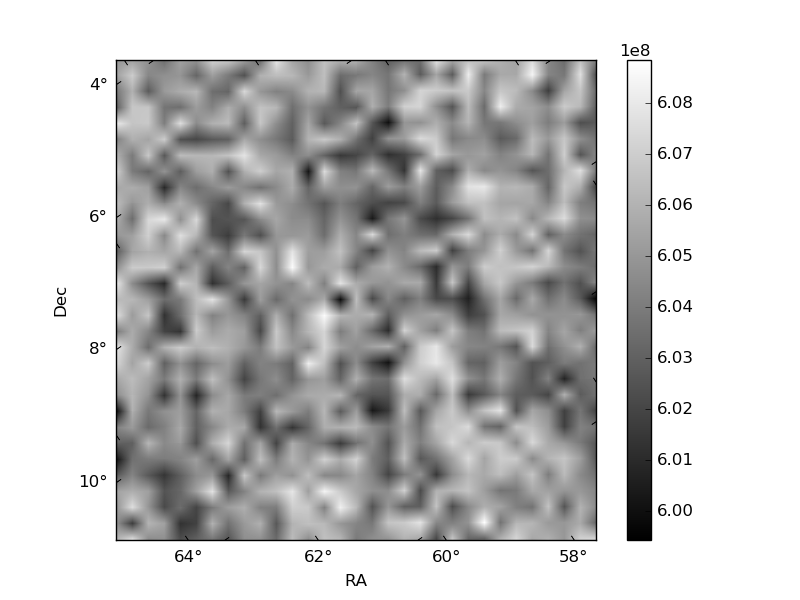
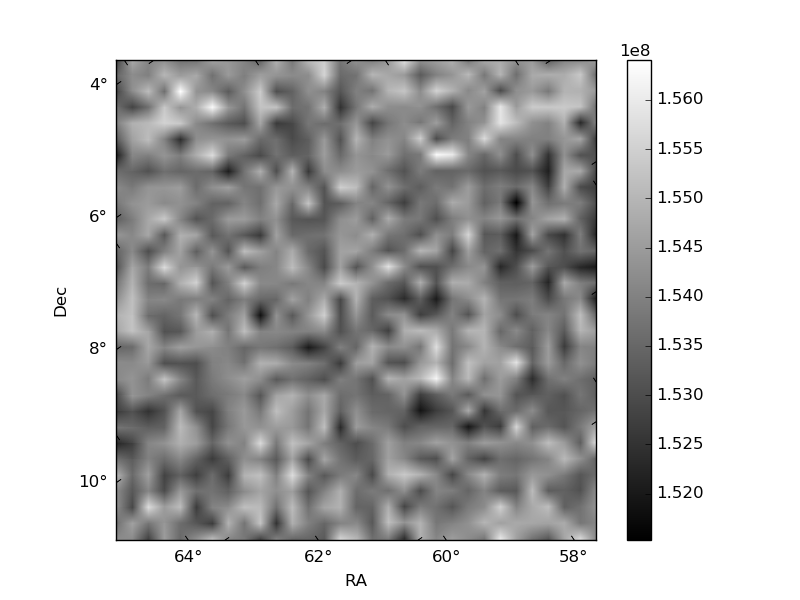
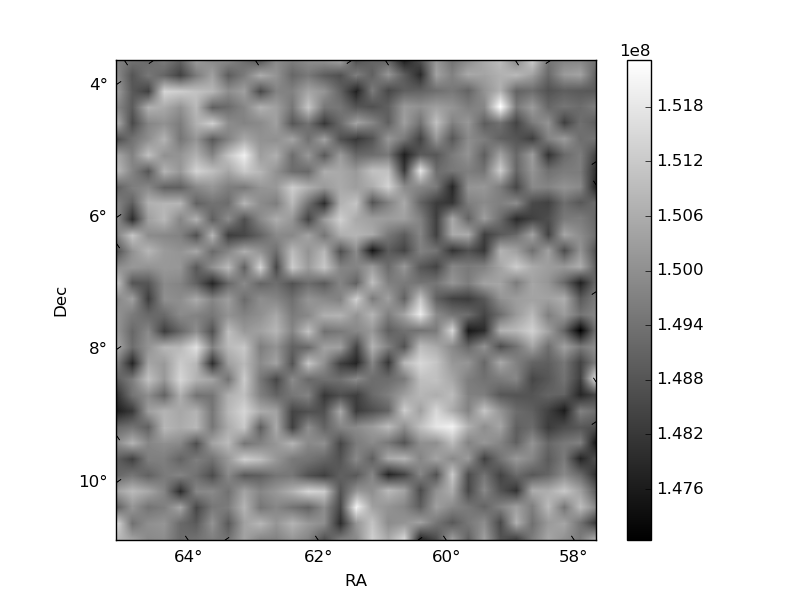
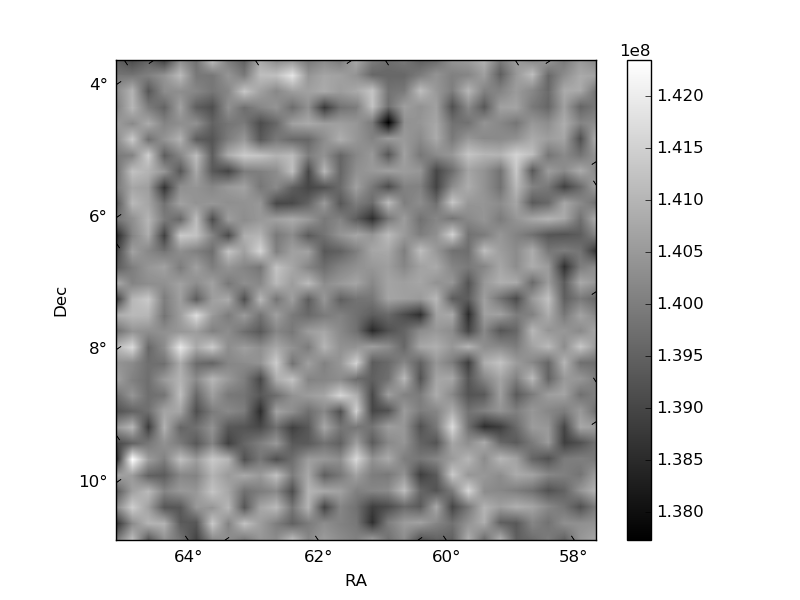
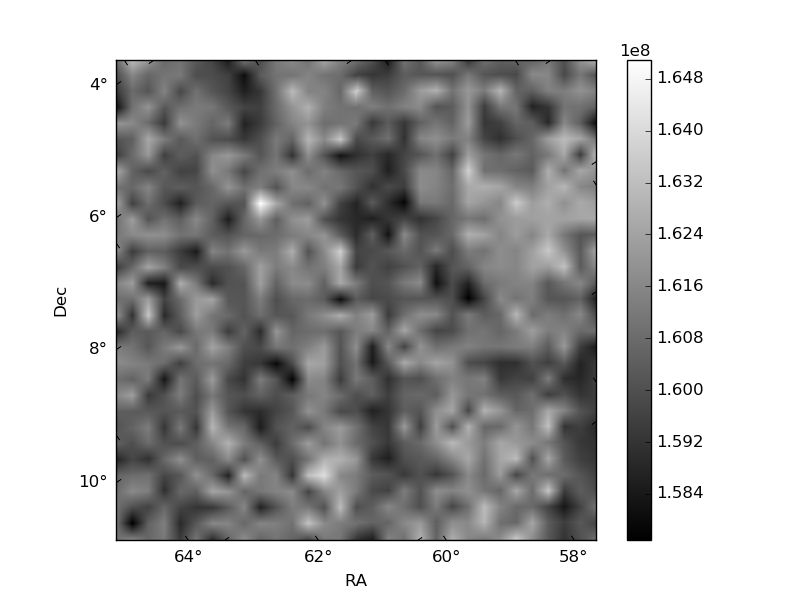
Histogram calculated using DETX and DETY for each event in the final _common_clean file
| Quadrant A | 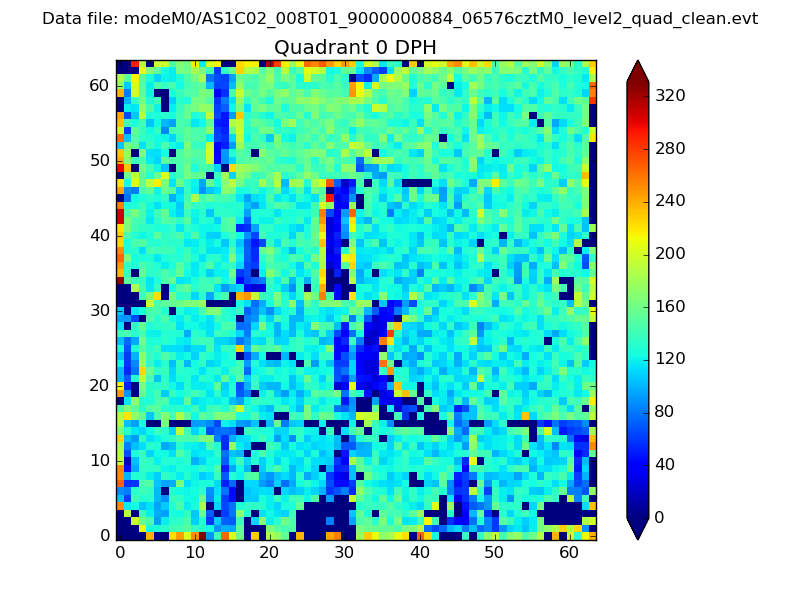 |
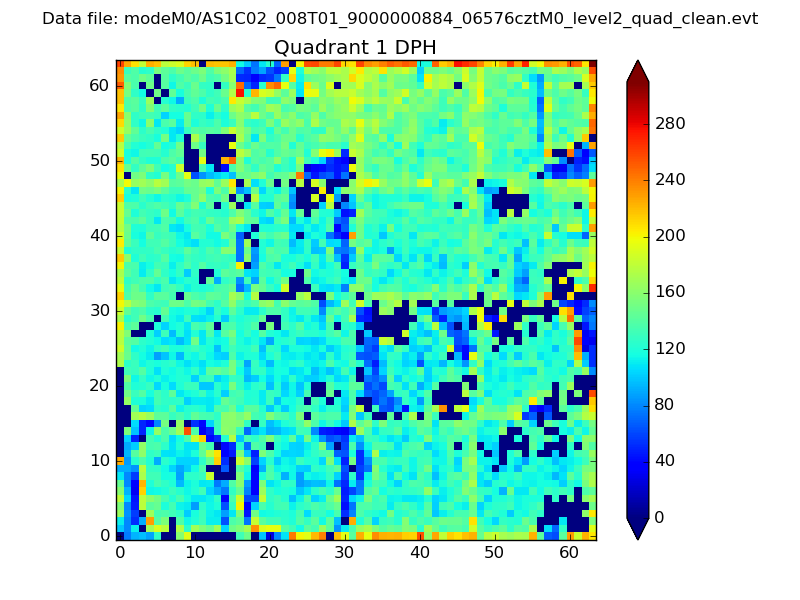 |
Quadrant B |
|---|---|---|---|
| Quadrant D | 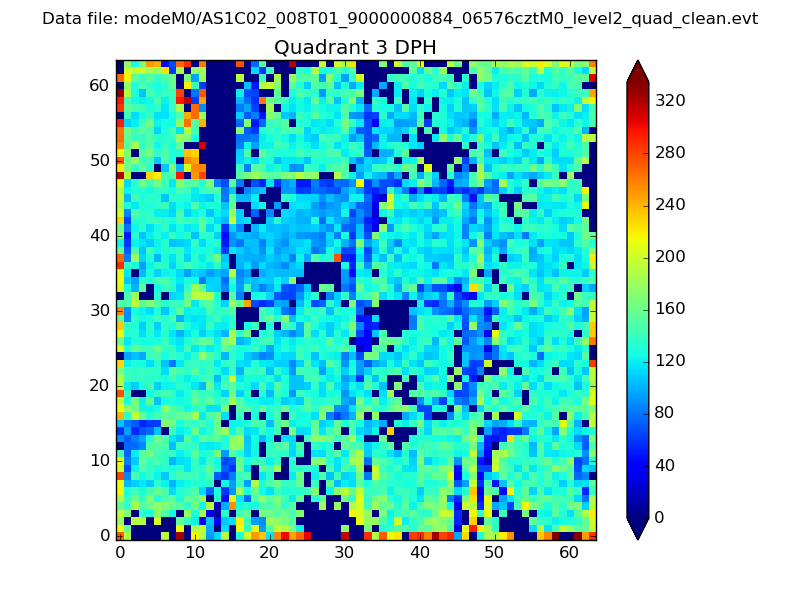 |
 |
Quadrant C |
| Plot type | Count rate plots | Images |
|---|---|---|
| Comparison with Poisson distribution Blue bars denote a histogram of data divided into 1 sec bins. Red curve is a Poisson curve with rate = median count rate of data. |
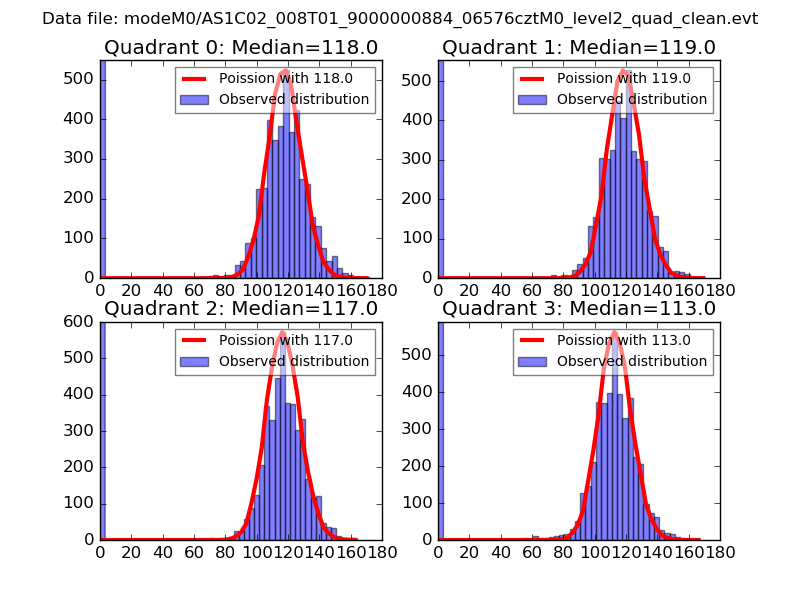 |
 |
| Quadrant-wise count rates Data is divided into 100 sec bins |
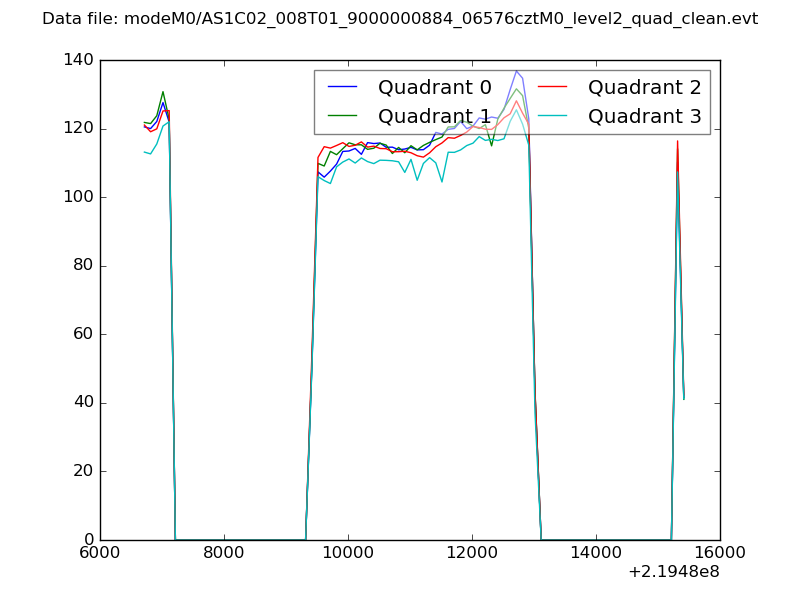 |
|
| Module-wise count rates for Quadrant A Data is divided into 100 sec bins |
 |
 |
| Module-wise count rates for Quadrant B Data is divided into 100 sec bins |
 |
 |
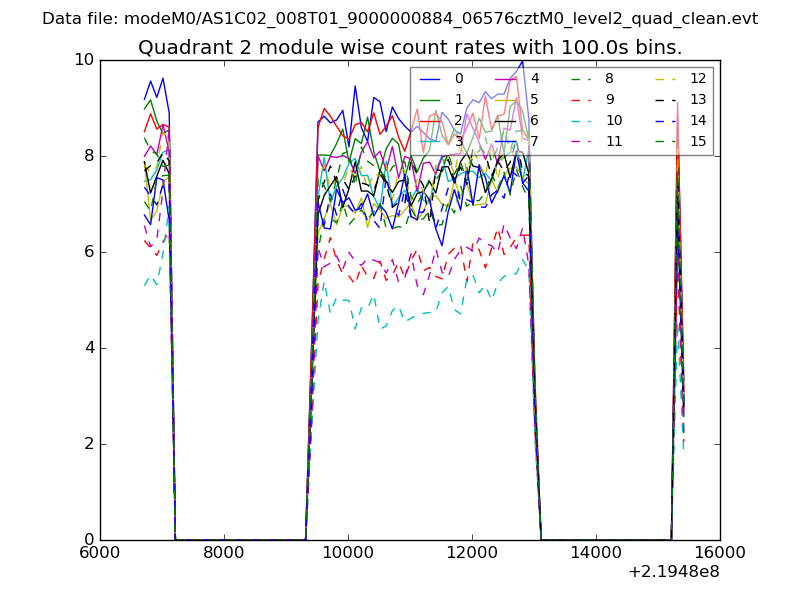
| Module-wise count rates for Quadrant C Data is divided into 100 sec bins |
 |
 |
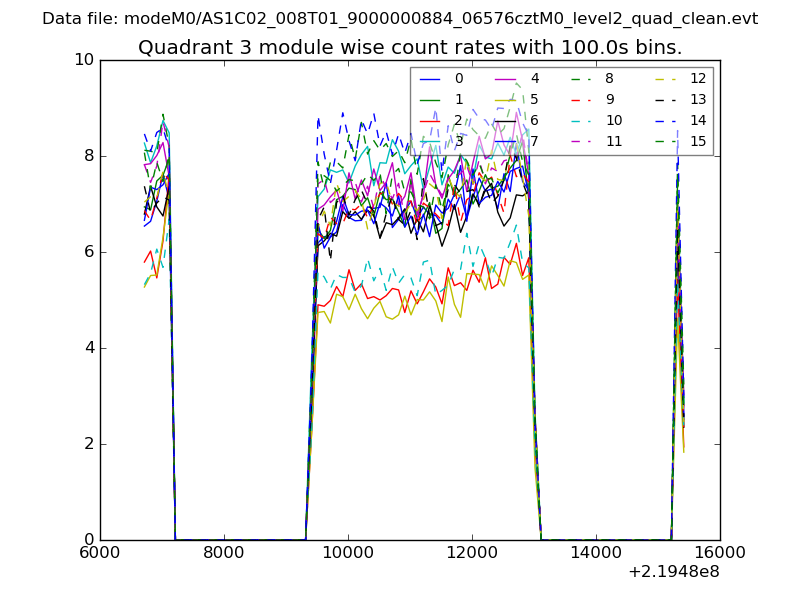
| Module-wise count rates for Quadrant D Data is divided into 100 sec bins |
 |
 |
| Parameter | Plot |
|---|---|
| CZT HV Monitor | 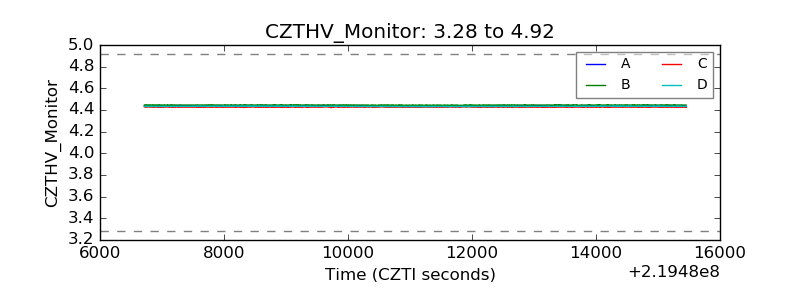 |
| D_VDD | 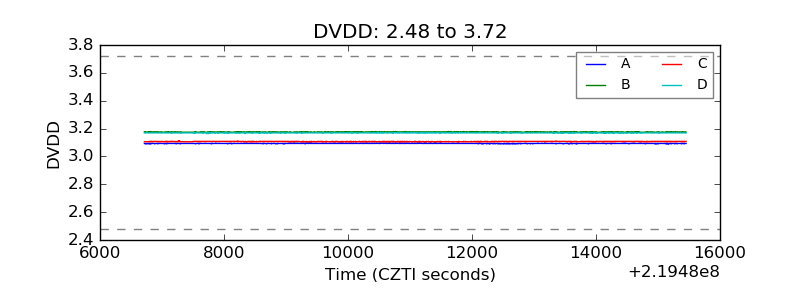 |
| Temperature 1 | 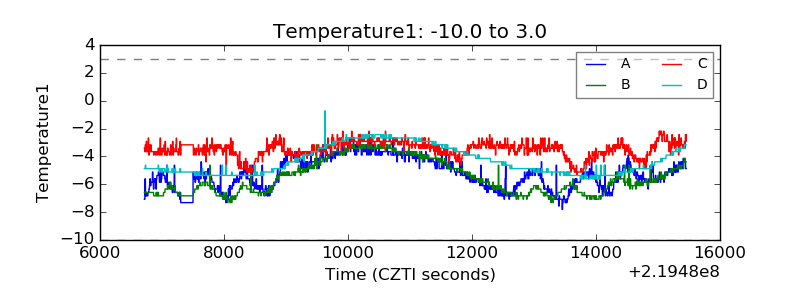 |
| Veto HV Monitor | 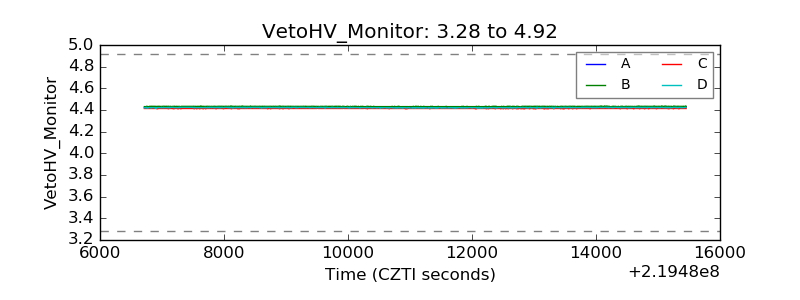 |
| Veto LLD | 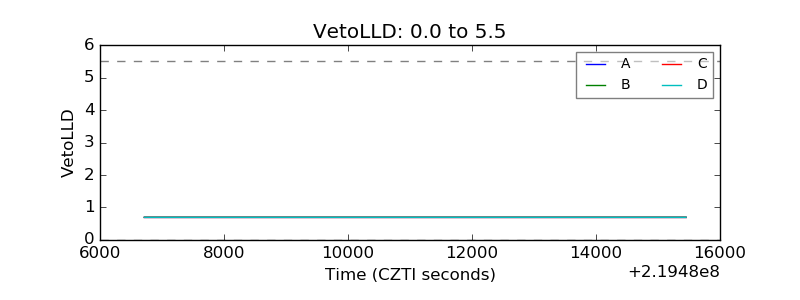 |
| Alpha Counter | 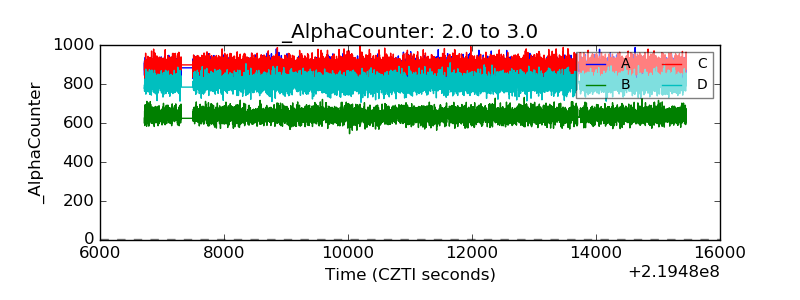 |
| _CPM_Rate | 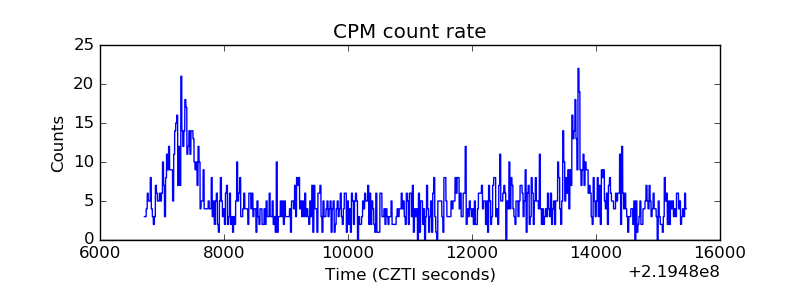 |
| CZT Counter | 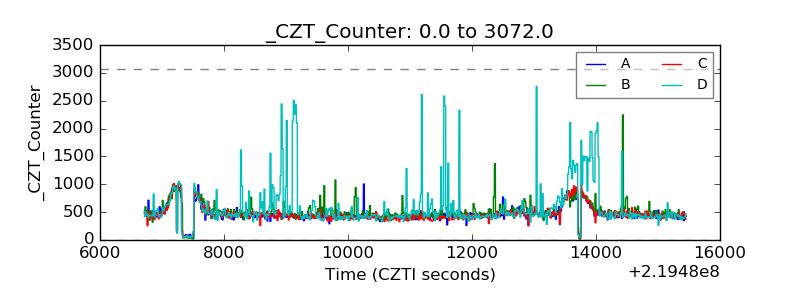 |
| +2.5 Volts monitor |  |
| +5 Volts monitor |  |
| _ROLL_ROT | 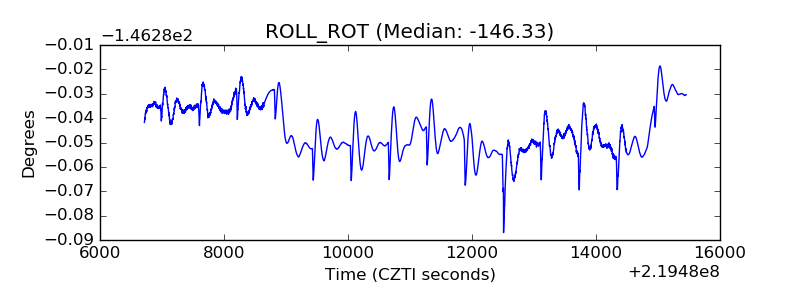 |
| _Roll_DEC | 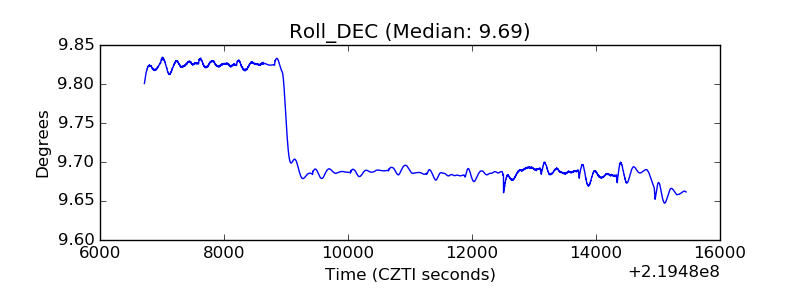 |
| _Roll_RA | 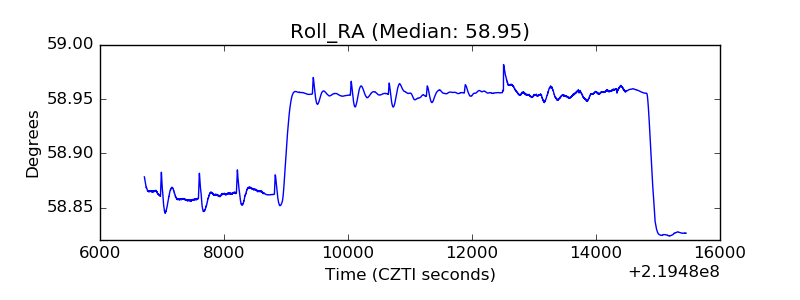 |
| Veto Counter | 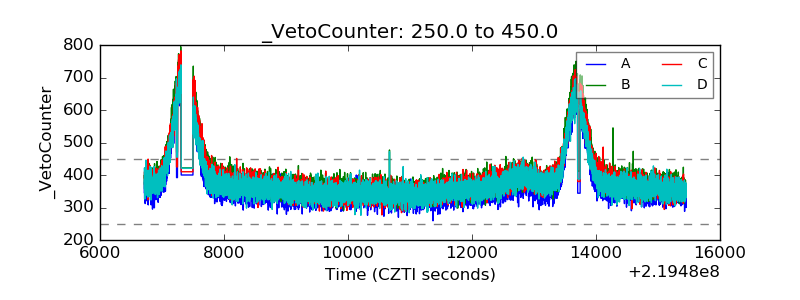 |