| Param | Original file | Final file |
|---|---|---|
| Filename | modeM0/AS1C02_008T01_9000000884_06579cztM0_level2.evt | modeM0/AS1C02_008T01_9000000884_06579cztM0_level2_quad_clean.evt |
| Size (bytes) | 1,221,485,760 | 210,277,440 |
| Size | 1.1 GB | 200.5 MB |
| Events in quadrant A | 9,056,807 | 1,286,175 |
| Events in quadrant B | 8,696,964 | 1,303,667 |
| Events in quadrant C | 7,994,127 | 1,292,874 |
| Events in quadrant D | 10,027,816 | 1,245,973 |
| Mode M0 | |||
|---|---|---|---|
| Quadrant | BADHDUFLAG | Total packets | Discarded packets |
| A | 0 | 39156 | 4 |
| B | 0 | 37729 | 3 |
| C | 0 | 36611 | 3 |
| D | 0 | 42333 | 3 |
| Mode M9 | |||
|---|---|---|---|
| Quadrant | BADHDUFLAG | Total packets | Discarded packets |
| A | 0 | 16 | 0 |
| B | 0 | 16 | 0 |
| C | 0 | 16 | 0 |
| D | 0 | 16 | 0 |
| Mode SS | |||
|---|---|---|---|
| Quadrant | BADHDUFLAG | Total packets | Discarded packets |
| A | 0 | 366 | 0 |
| B | 0 | 366 | 0 |
| C | 0 | 366 | 0 |
| D | 0 | 366 | 0 |
| Quadrant | Total seconds | Saturated seconds | Saturation percentage |
|---|---|---|---|
| A | 17995 | 482 | 2.678522% |
| B | 17995 | 321 | 1.783829% |
| C | 17995 | 143 | 0.794665% |
| D | 17995 | 467 | 2.595165% |
Noise dominated data is calculated using 1-second bins in cleaned event files. If a bin has >2000 counts, and if more than 50% of those come from <1% of pixels, then it is considered to be noise-dominated and hence unusable.
| Quadrant | # 1 sec bins | Bins with >0 counts | Bins with >2000 counts | High rate bins dominated by noise | Noise dominated (total time) | Noise dominated (detector-on time) | Marked lightcurve |
|---|---|---|---|---|---|---|---|
| A | 19545 | 17999 | 200 | 200 | 1.02% | 1.11% | 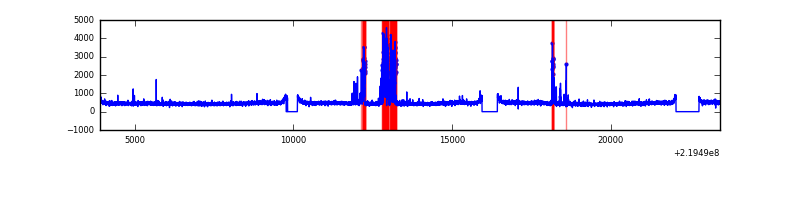 |
| B | 19545 | 17999 | 44 | 44 | 0.23% | 0.24% | 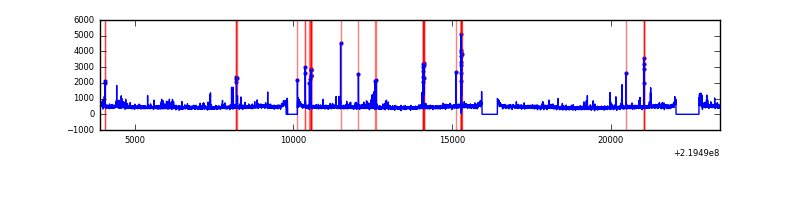 |
| C | 19545 | 17999 | 0 | 0 | 0.00% | 0.00% | 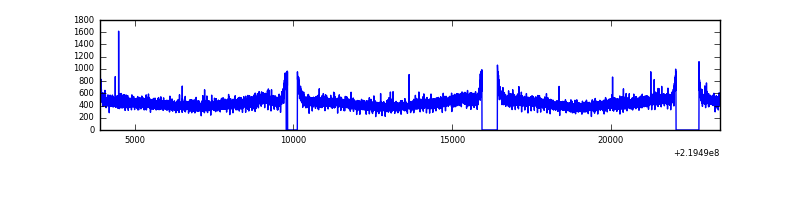 |
| D | 19545 | 17999 | 226 | 226 | 1.16% | 1.26% | 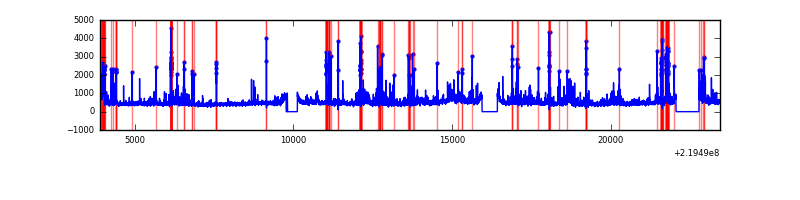 |
Top three noisy pixels from each quadrant. If the there are fewer than three noisy pixels in the level2.evt file, extra rows are filled as -1
| Pixel properties | Quadrant properties | ||||||
|---|---|---|---|---|---|---|---|
| Quadrant | DetID | PixID | Counts | Sigma | Mean | Median | Sigma |
| A | 15 | 234 | 920074 | 2174.47 | 2080 | 2031 | 422.2 |
| A | 8 | 15 | 103407 | 240.12 | 2080 | 2031 | 422.2 |
| A | 0 | 226 | 19719 | 41.89 | 2080 | 2031 | 422.2 |
| B | 4 | 81 | 136004 | 330.68 | 2100 | 2047 | 405.1 |
| B | 0 | 219 | 110880 | 268.66 | 2100 | 2047 | 405.1 |
| B | 4 | 172 | 104219 | 252.21 | 2100 | 2047 | 405.1 |
| C | 8 | 128 | 19229 | 36.3 | 2037 | 2040 | 473.5 |
| C | 13 | 61 | 15876 | 29.22 | 2037 | 2040 | 473.5 |
| C | 12 | 4 | 9622 | 16.01 | 2037 | 2040 | 473.5 |
| D | 2 | 33 | 1046799 | 2109.87 | 2025 | 1965 | 495.2 |
| D | 2 | 152 | 370462 | 744.12 | 2025 | 1965 | 495.2 |
| D | 2 | 136 | 268963 | 539.16 | 2025 | 1965 | 495.2 |
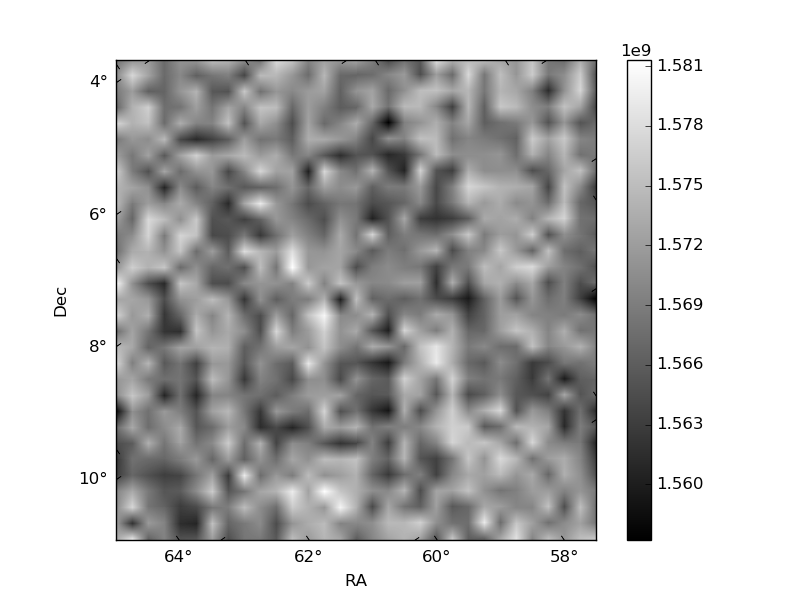
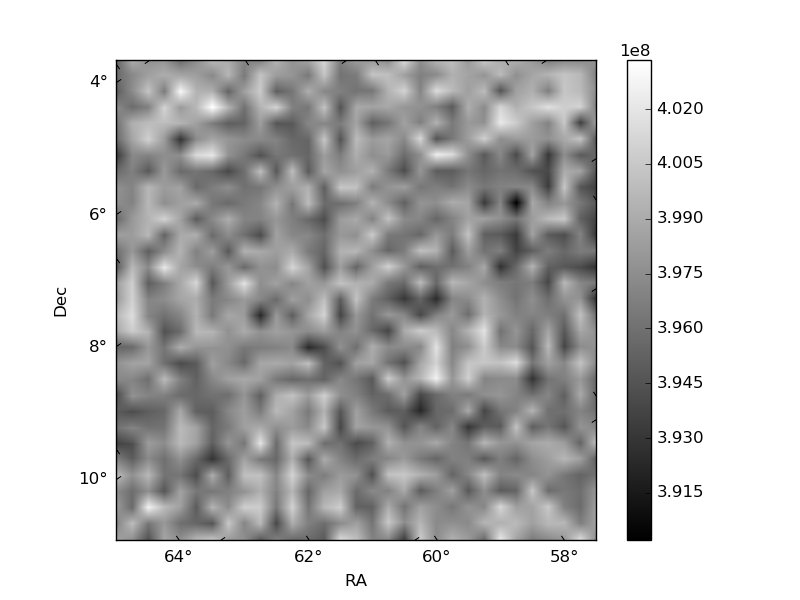
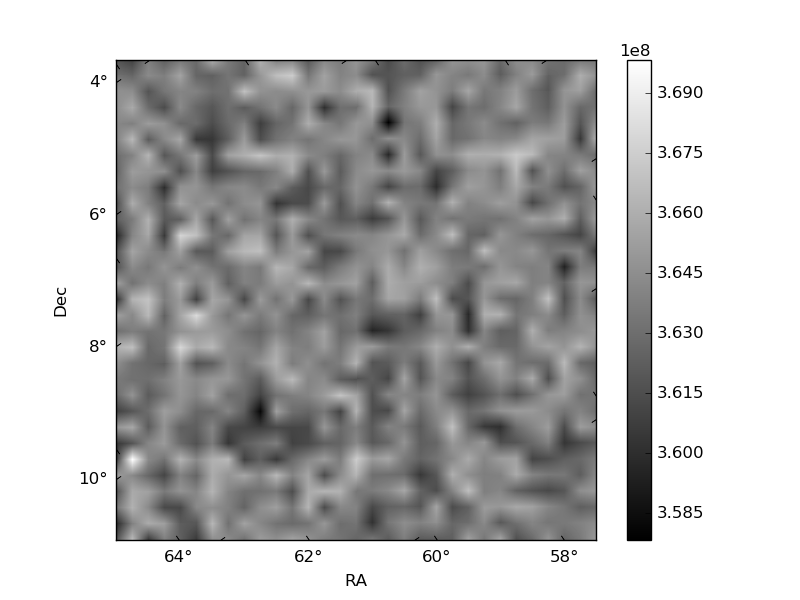
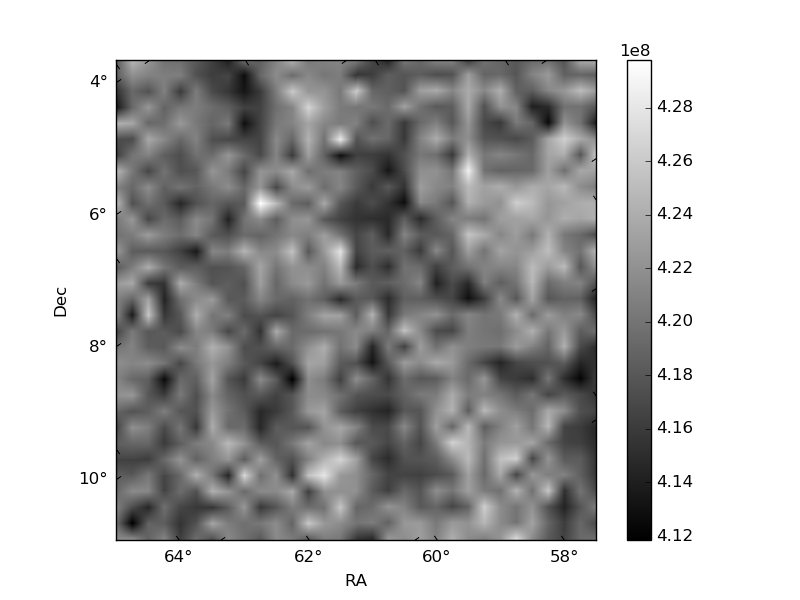
Histogram calculated using DETX and DETY for each event in the final _common_clean file
| Quadrant A | 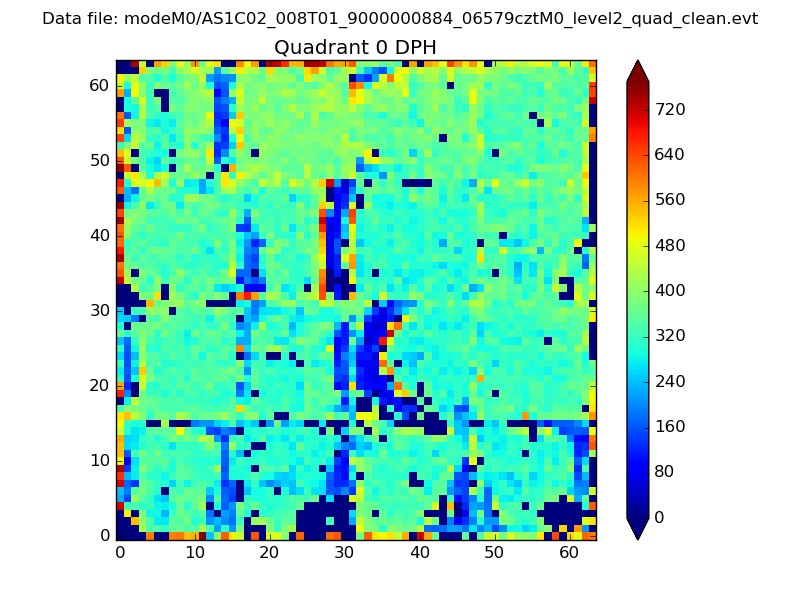 |
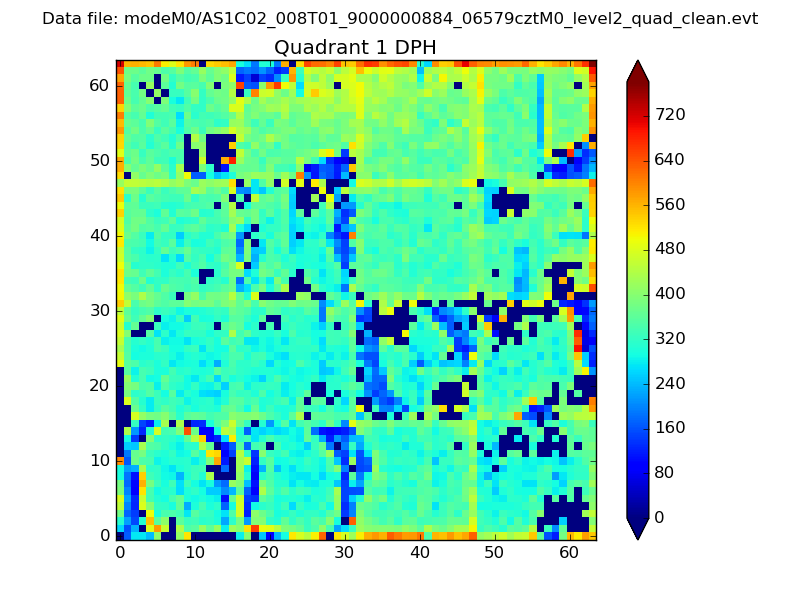 |
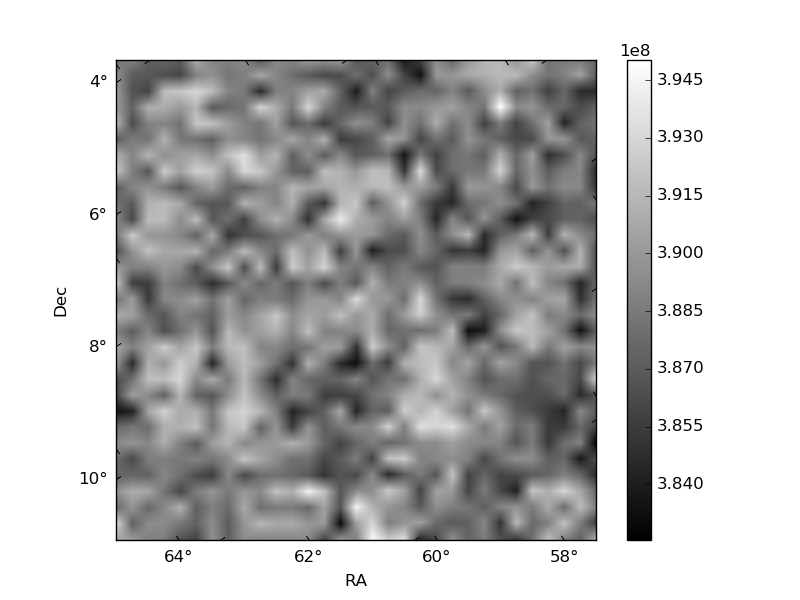
Quadrant B |
|---|---|---|---|
| Quadrant D | 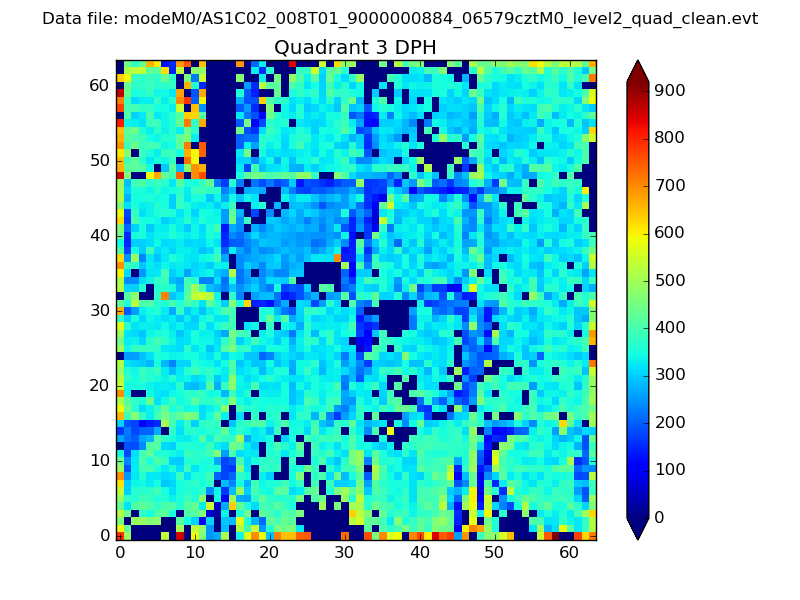 |
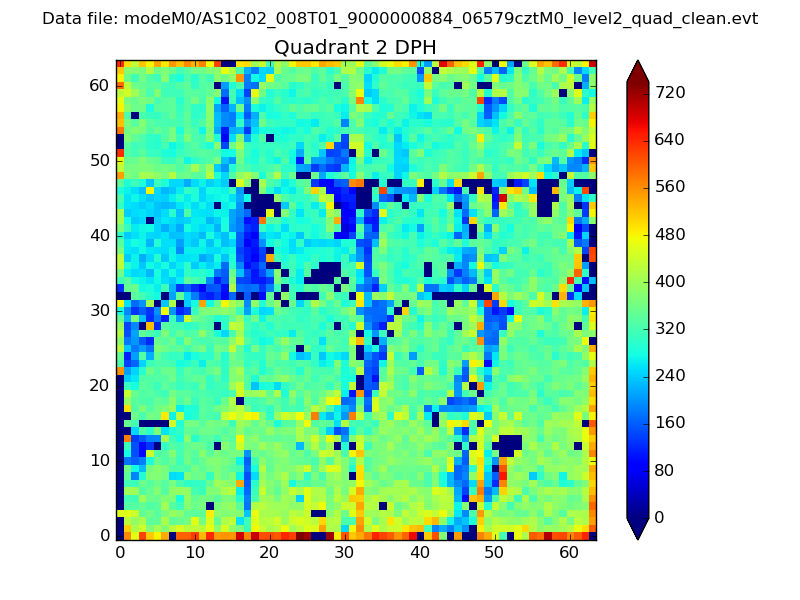 |
Quadrant C |
| Plot type | Count rate plots | Images |
|---|---|---|
| Comparison with Poisson distribution Blue bars denote a histogram of data divided into 1 sec bins. Red curve is a Poisson curve with rate = median count rate of data. |
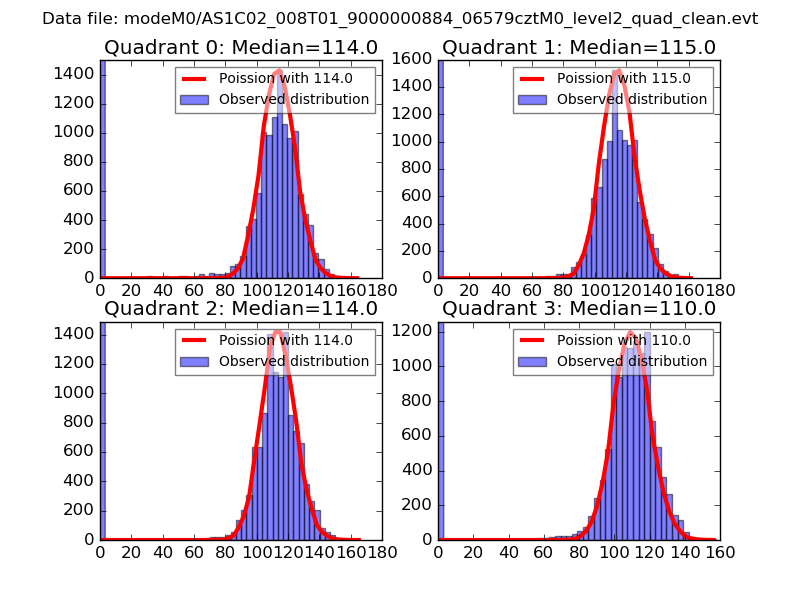 |
 |
| Quadrant-wise count rates Data is divided into 100 sec bins |
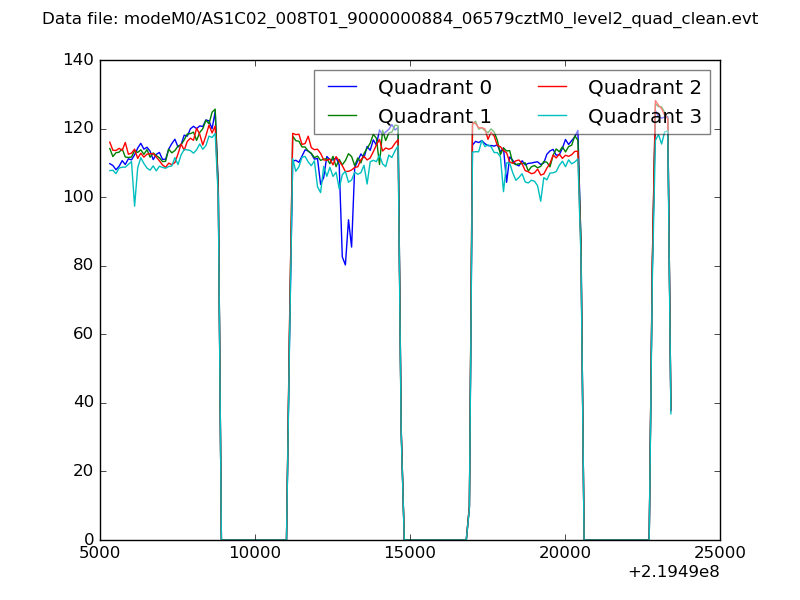 |
|
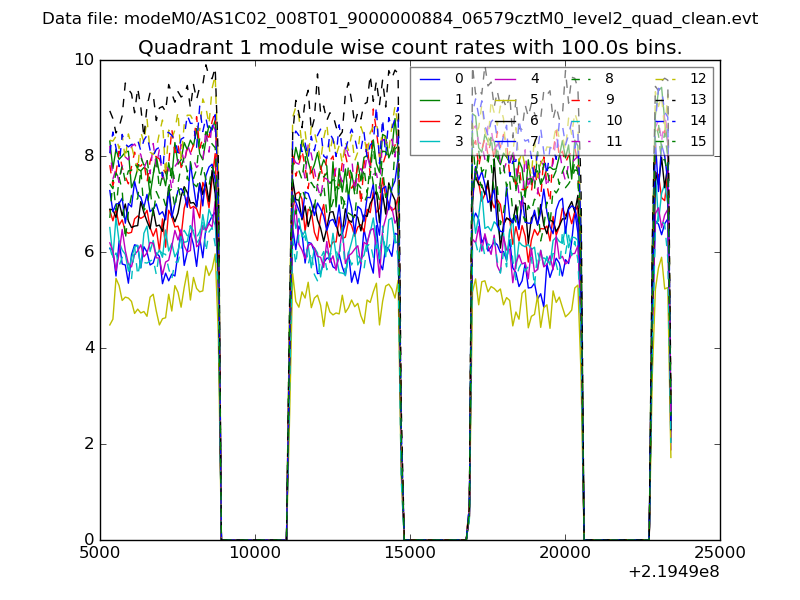
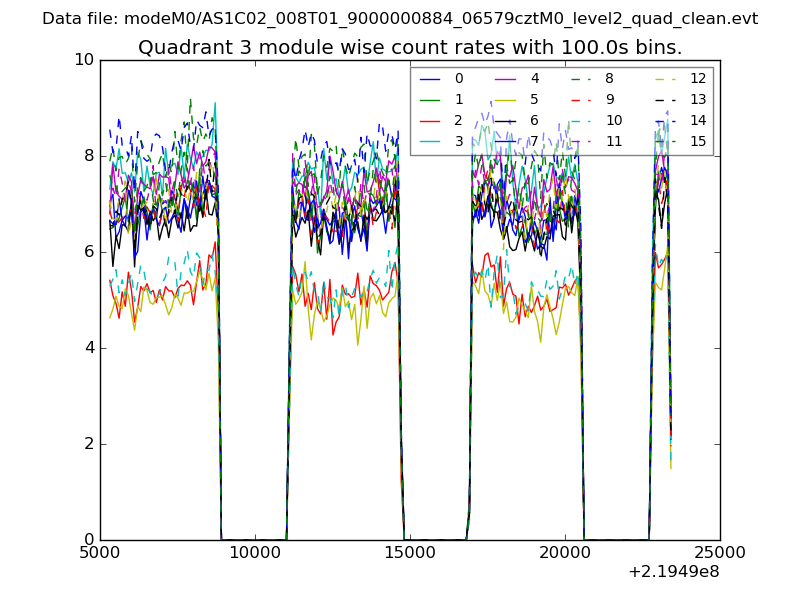
| Module-wise count rates for Quadrant A Data is divided into 100 sec bins |
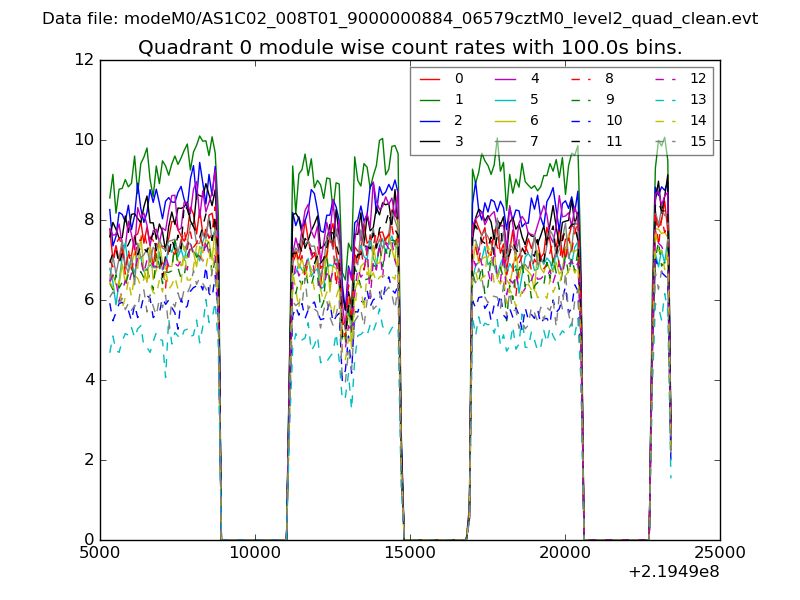 |
 |
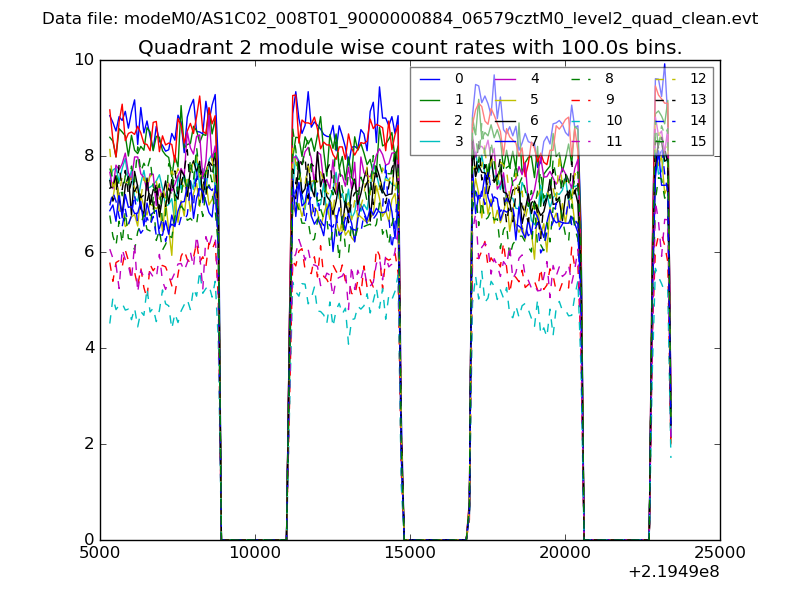
| Module-wise count rates for Quadrant B Data is divided into 100 sec bins |
 |
 |
| Module-wise count rates for Quadrant C Data is divided into 100 sec bins |
 |
 |
| Module-wise count rates for Quadrant D Data is divided into 100 sec bins |
 |
 |
| Parameter | Plot |
|---|---|
| CZT HV Monitor | 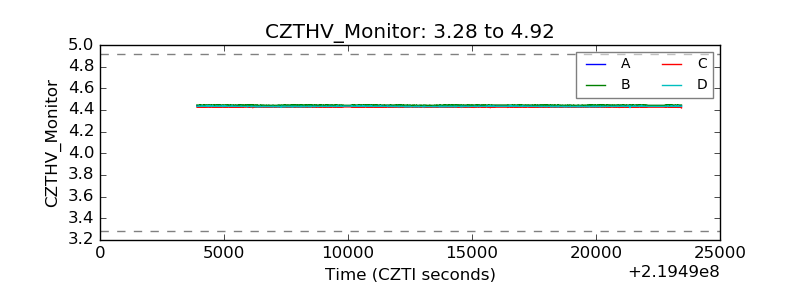 |
| D_VDD | 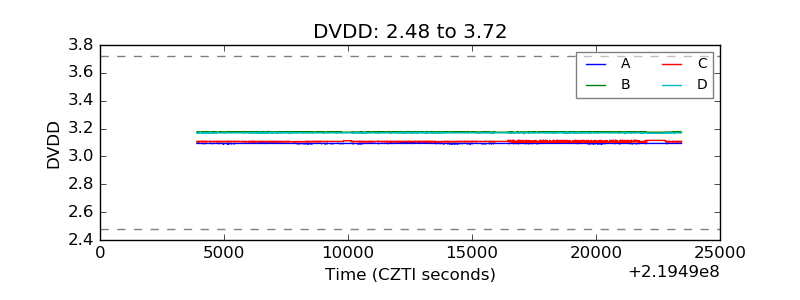 |
| Temperature 1 | 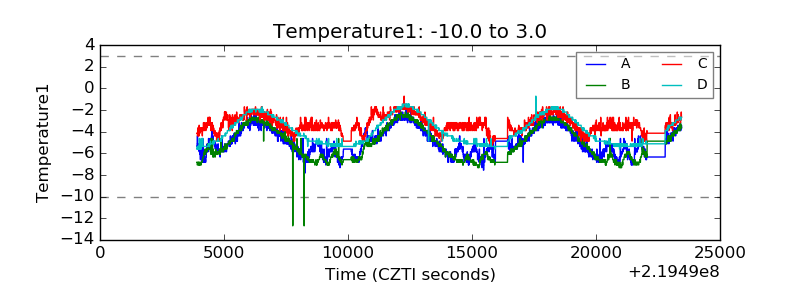 |
| Veto HV Monitor | 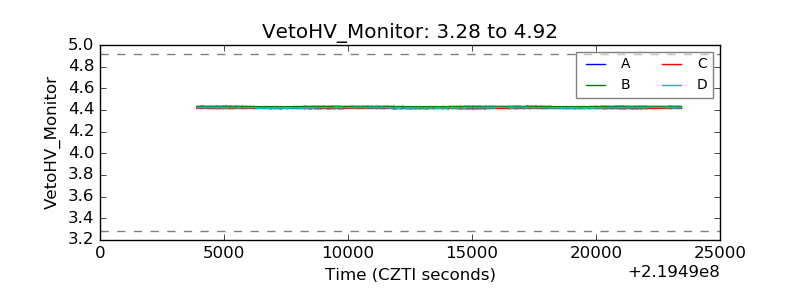 |
| Veto LLD | 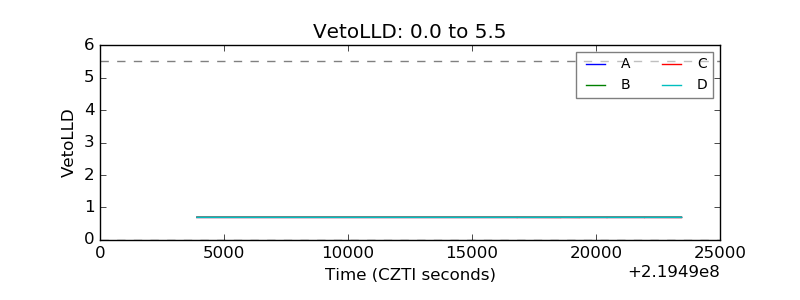 |
| Alpha Counter | 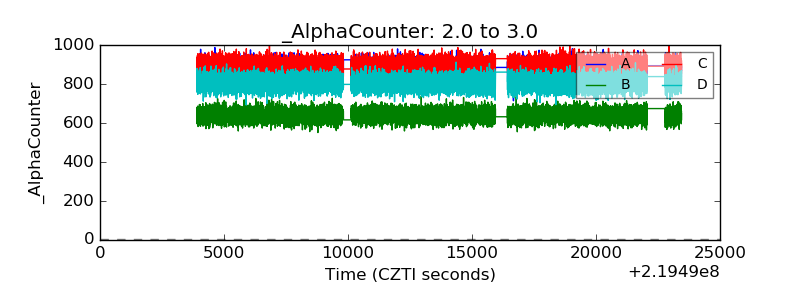 |
| _CPM_Rate | 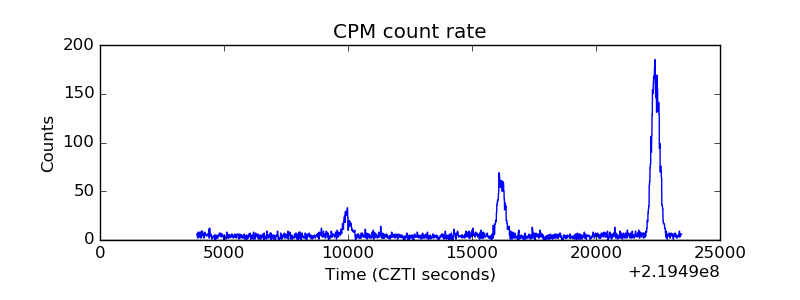 |
| CZT Counter | 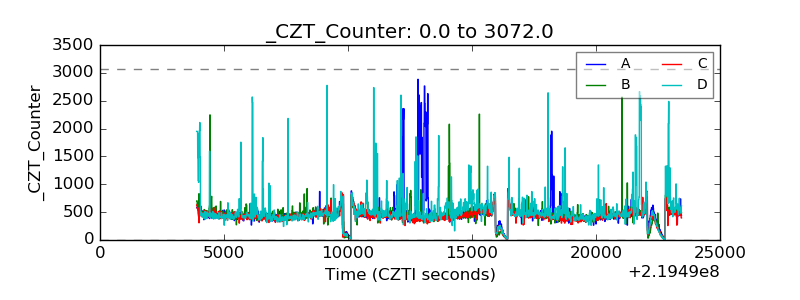 |
| +2.5 Volts monitor | 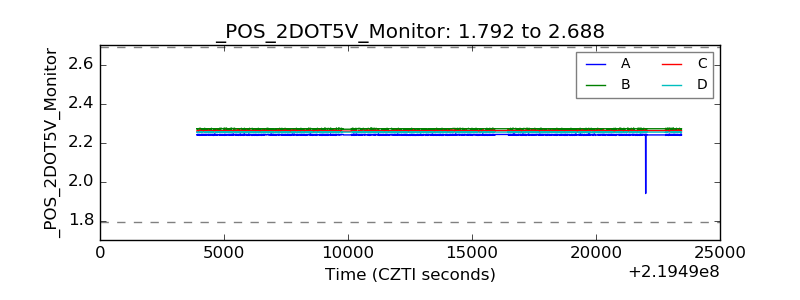 |
| +5 Volts monitor | 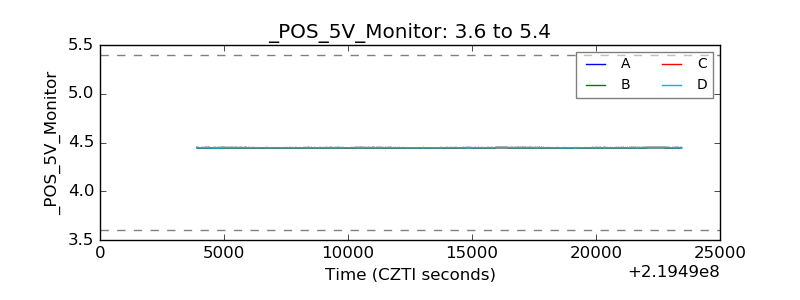 |
| _ROLL_ROT | 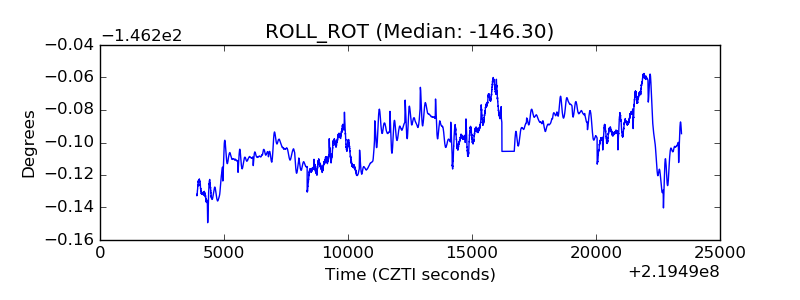 |
| _Roll_DEC | 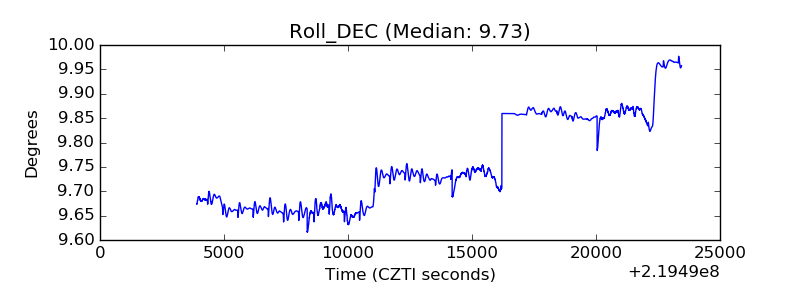 |
| _Roll_RA | 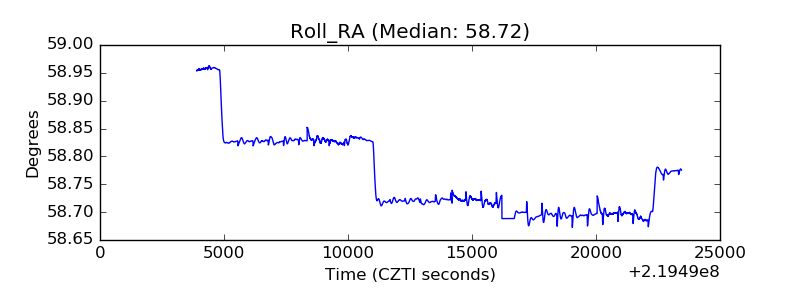 |
| Veto Counter |  |