| Param | Original file | Final file |
|---|---|---|
| Filename | modeM0/AS1C02_008T01_9000000884_06581cztM0_level2.evt | modeM0/AS1C02_008T01_9000000884_06581cztM0_level2_quad_clean.evt |
| Size (bytes) | 435,029,760 | 88,577,280 |
| Size | 414.9 MB | 84.5 MB |
| Events in quadrant A | 3,151,044 | 561,979 |
| Events in quadrant B | 3,326,373 | 567,552 |
| Events in quadrant C | 2,977,330 | 552,079 |
| Events in quadrant D | 3,268,143 | 537,366 |
| Mode M0 | |||
|---|---|---|---|
| Quadrant | BADHDUFLAG | Total packets | Discarded packets |
| A | 0 | 13964 | 3 |
| B | 0 | 14302 | 2 |
| C | 0 | 13600 | 2 |
| D | 0 | 14283 | 2 |
| Mode M9 | |||
|---|---|---|---|
| Quadrant | BADHDUFLAG | Total packets | Discarded packets |
| A | 0 | 10 | 0 |
| B | 0 | 10 | 0 |
| C | 0 | 10 | 0 |
| D | 0 | 10 | 0 |
| Mode SS | |||
|---|---|---|---|
| Quadrant | BADHDUFLAG | Total packets | Discarded packets |
| A | 0 | 136 | 0 |
| B | 0 | 136 | 0 |
| C | 0 | 136 | 0 |
| D | 0 | 136 | 0 |
| Quadrant | Total seconds | Saturated seconds | Saturation percentage |
|---|---|---|---|
| A | 6642 | 105 | 1.580849% |
| B | 6642 | 111 | 1.671183% |
| C | 6642 | 42 | 0.632340% |
| D | 6643 | 79 | 1.189222% |
Noise dominated data is calculated using 1-second bins in cleaned event files. If a bin has >2000 counts, and if more than 50% of those come from <1% of pixels, then it is considered to be noise-dominated and hence unusable.
| Quadrant | # 1 sec bins | Bins with >0 counts | Bins with >2000 counts | High rate bins dominated by noise | Noise dominated (total time) | Noise dominated (detector-on time) | Marked lightcurve |
|---|---|---|---|---|---|---|---|
| A | 7657 | 6643 | 20 | 20 | 0.26% | 0.30% | 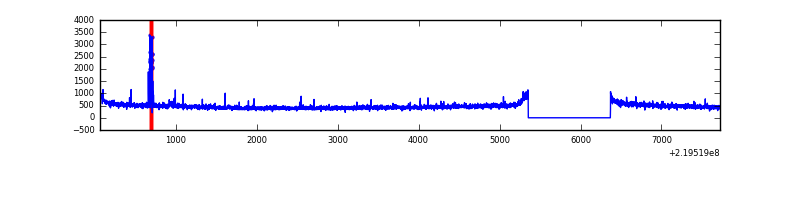 |
| B | 7657 | 6643 | 27 | 27 | 0.35% | 0.41% | 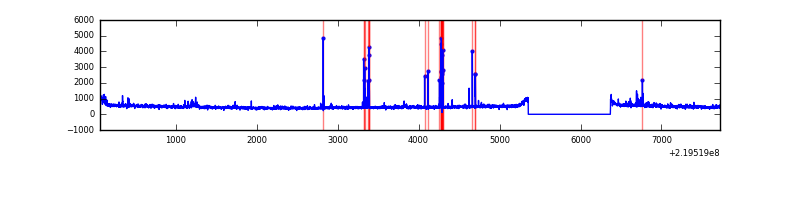 |
| C | 7657 | 6643 | 0 | 0 | 0.00% | 0.00% | 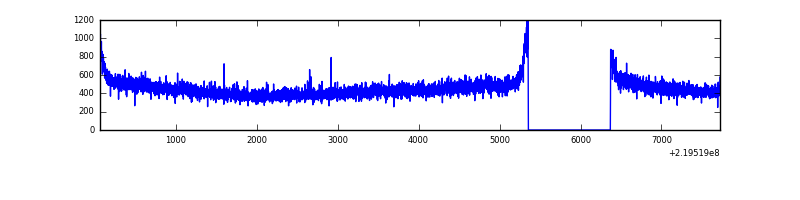 |
| D | 7658 | 6644 | 13 | 13 | 0.17% | 0.20% | 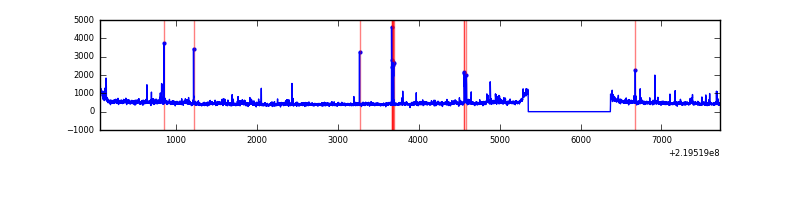 |
Top three noisy pixels from each quadrant. If the there are fewer than three noisy pixels in the level2.evt file, extra rows are filled as -1
| Pixel properties | Quadrant properties | ||||||
|---|---|---|---|---|---|---|---|
| Quadrant | DetID | PixID | Counts | Sigma | Mean | Median | Sigma |
| A | 14 | 111 | 75984 | 465.9 | 790 | 773 | 161.4 |
| A | 8 | 15 | 27908 | 168.09 | 790 | 773 | 161.4 |
| A | 0 | 226 | 7601 | 42.29 | 790 | 773 | 161.4 |
| B | 4 | 172 | 103694 | 664.0 | 793 | 773 | 155.0 |
| B | 0 | 219 | 33173 | 209.03 | 793 | 773 | 155.0 |
| B | 4 | 81 | 29871 | 187.73 | 793 | 773 | 155.0 |
| C | 13 | 61 | 5982 | 29.18 | 761 | 764 | 178.8 |
| C | 1 | 16 | 5441 | 26.16 | 761 | 764 | 178.8 |
| C | 9 | 54 | 3715 | 16.5 | 761 | 764 | 178.8 |
| D | 2 | 33 | 118155 | 618.9 | 767 | 743 | 189.7 |
| D | 8 | 195 | 68677 | 358.09 | 767 | 743 | 189.7 |
| D | 2 | 152 | 60421 | 314.57 | 767 | 743 | 189.7 |
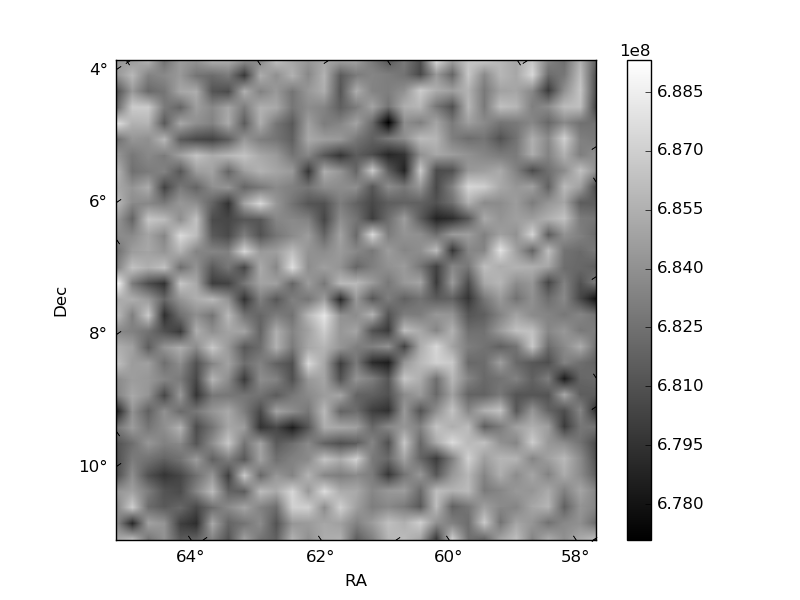
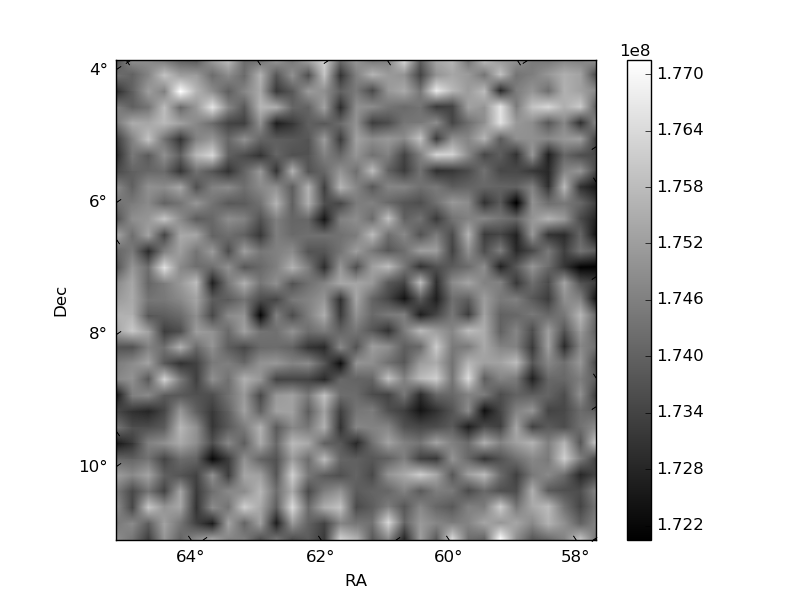
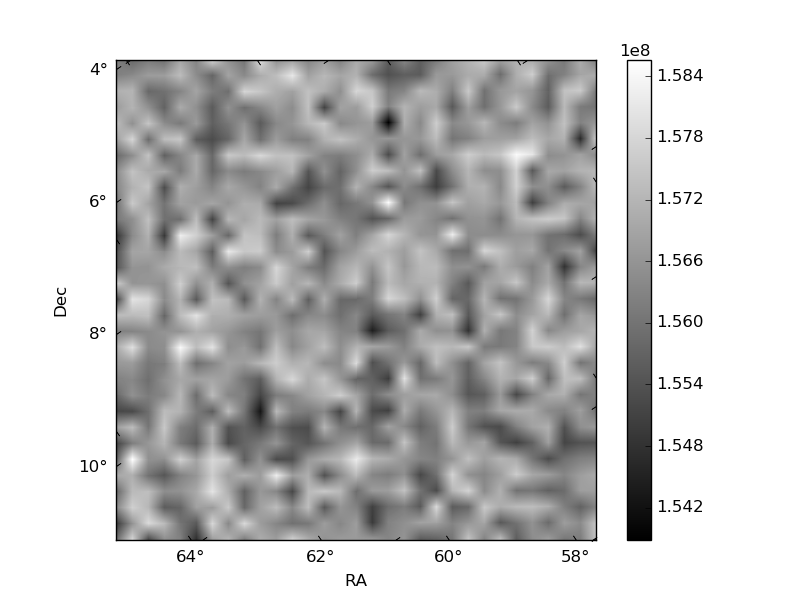
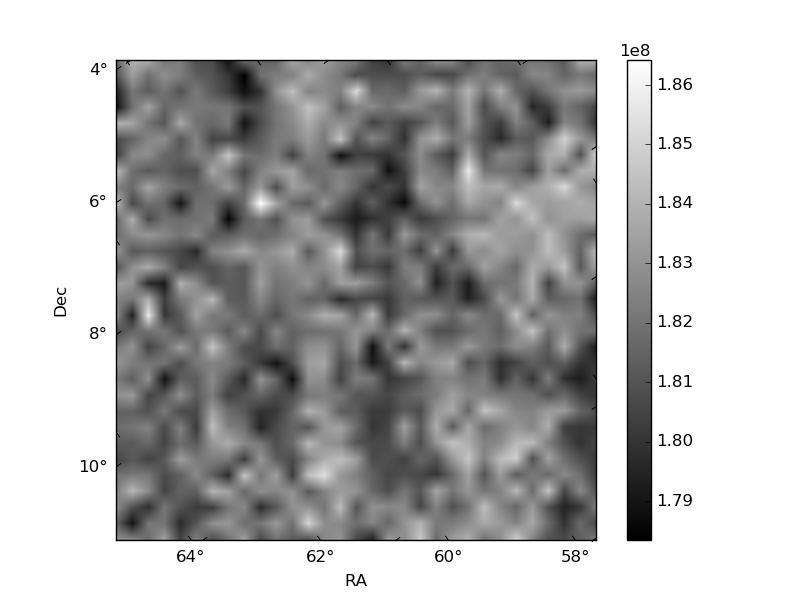
Histogram calculated using DETX and DETY for each event in the final _common_clean file
| Quadrant A | 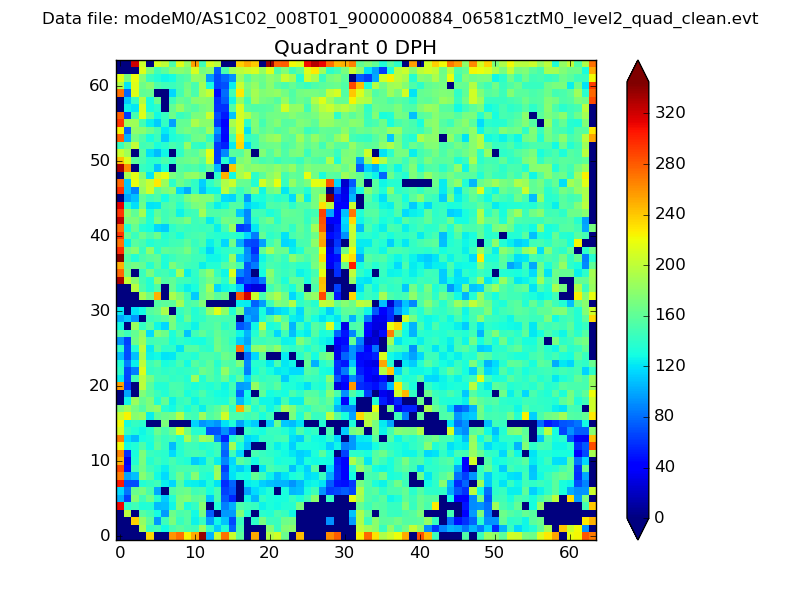 |
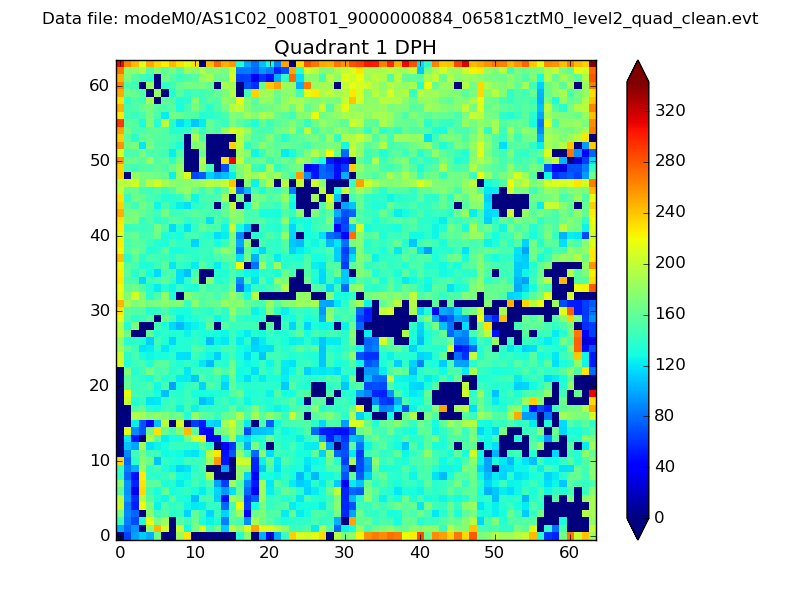 |
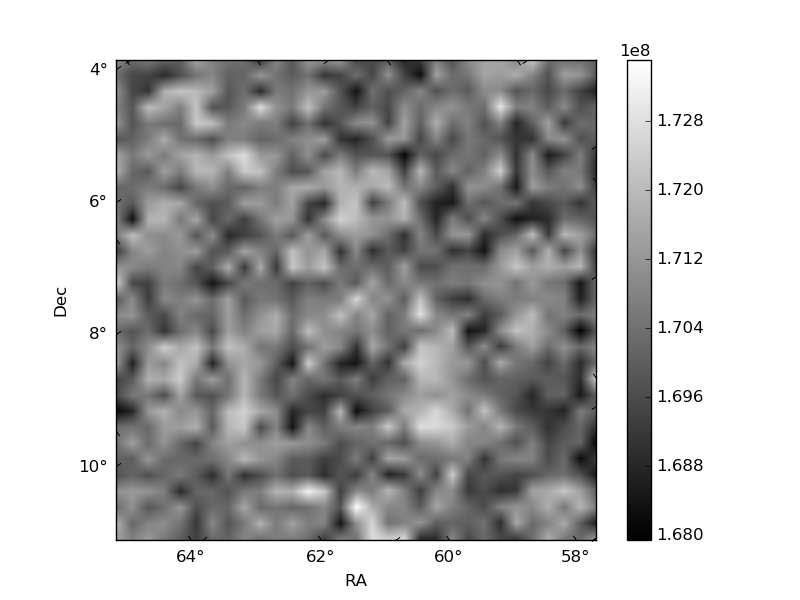
Quadrant B |
|---|---|---|---|
| Quadrant D | 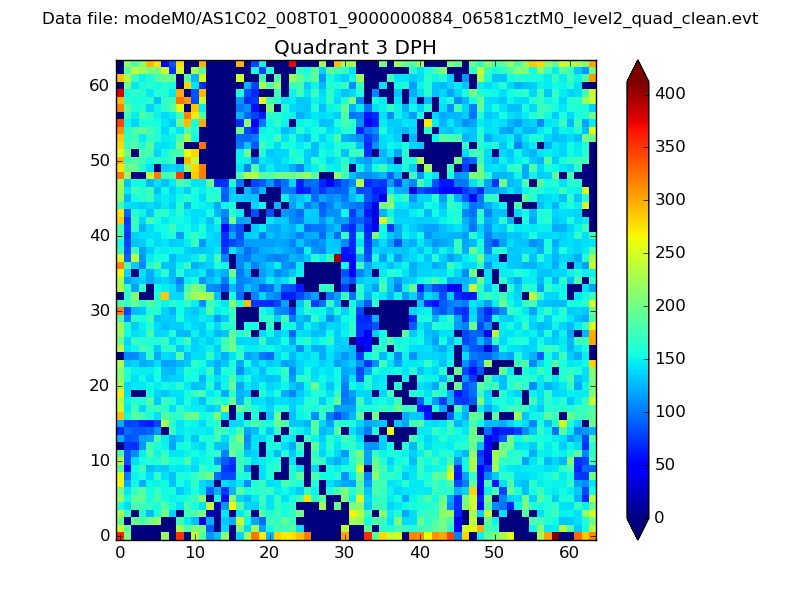 |
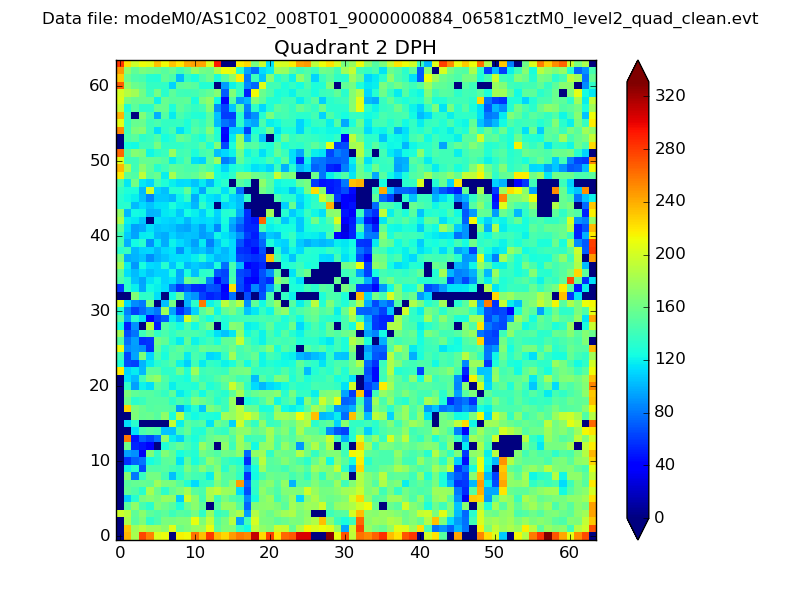 |
Quadrant C |
| Plot type | Count rate plots | Images |
|---|---|---|
| Comparison with Poisson distribution Blue bars denote a histogram of data divided into 1 sec bins. Red curve is a Poisson curve with rate = median count rate of data. |
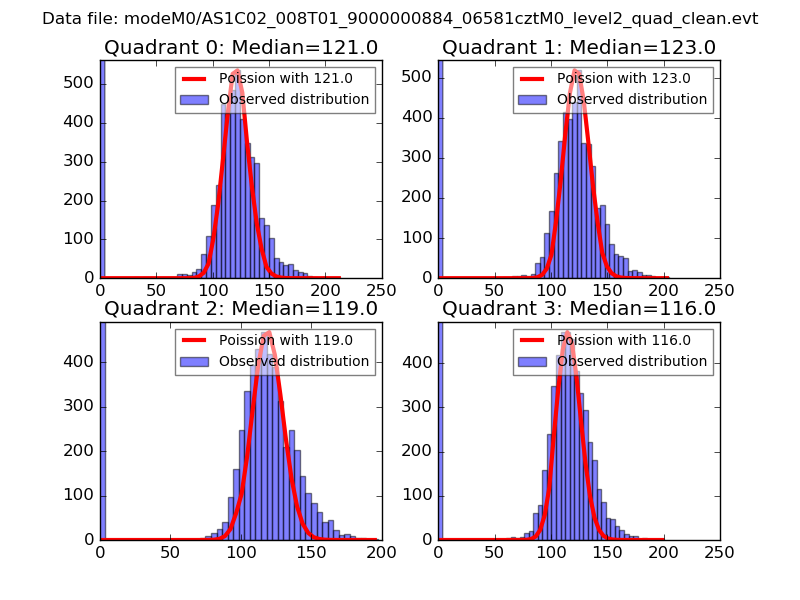 |
 |
| Quadrant-wise count rates Data is divided into 100 sec bins |
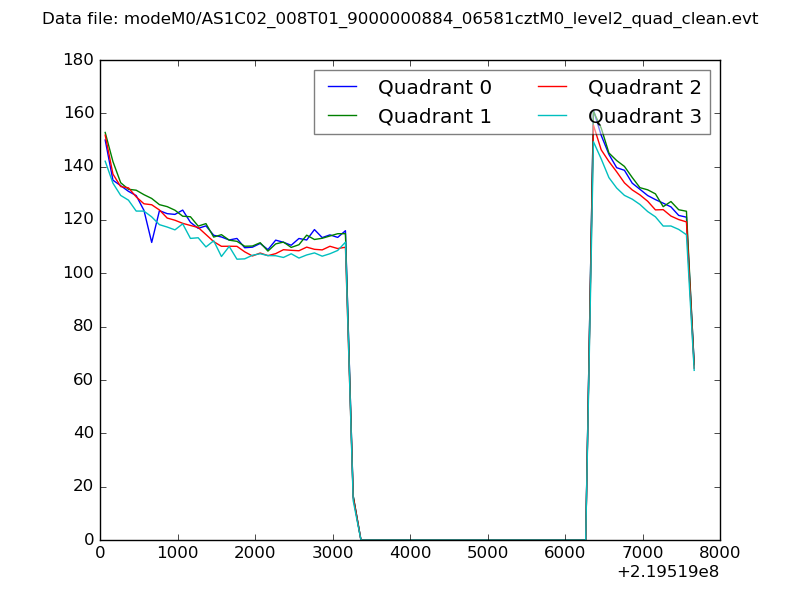 |
|
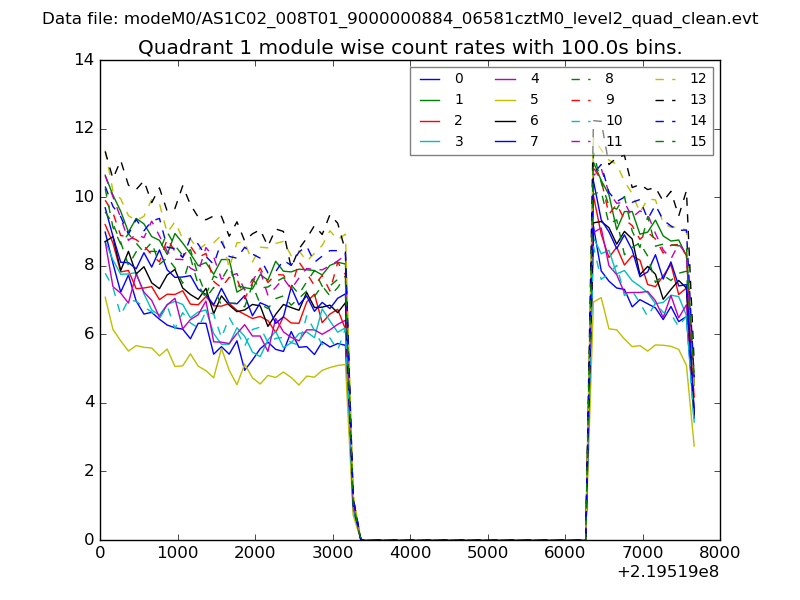
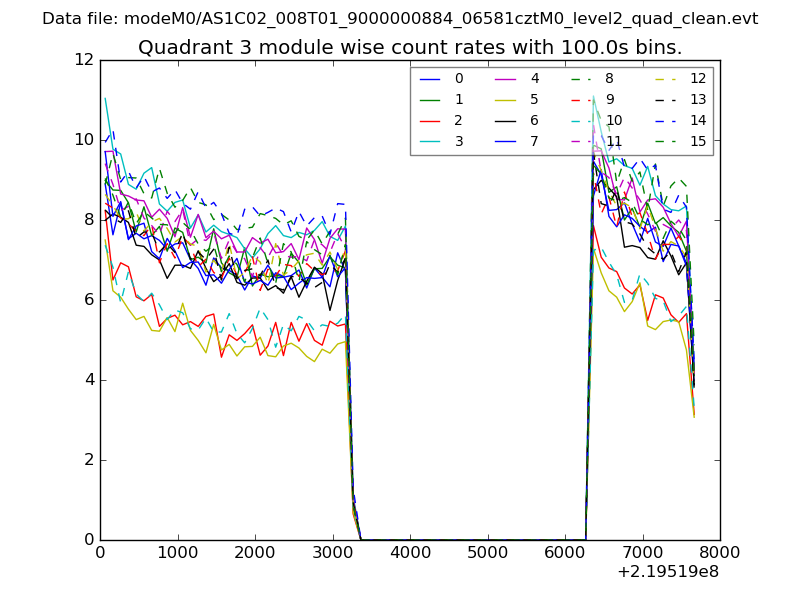
| Module-wise count rates for Quadrant A Data is divided into 100 sec bins |
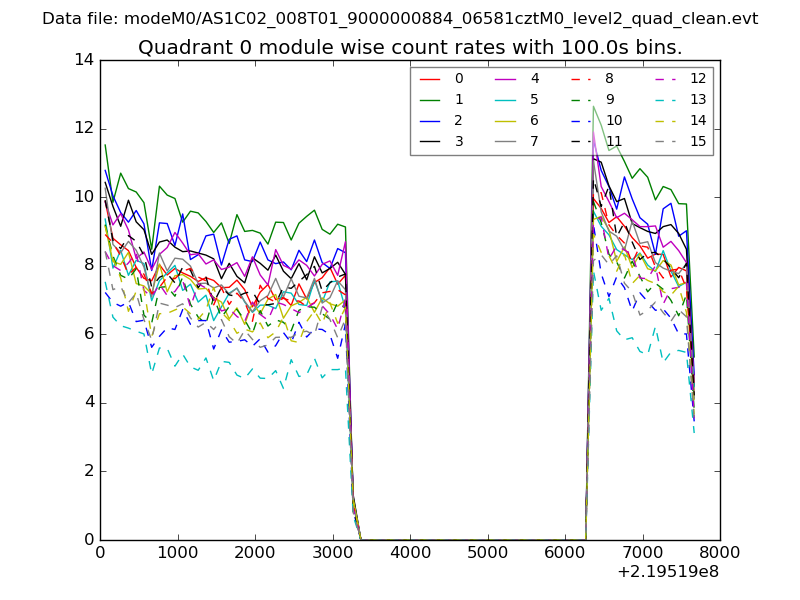 |
 |
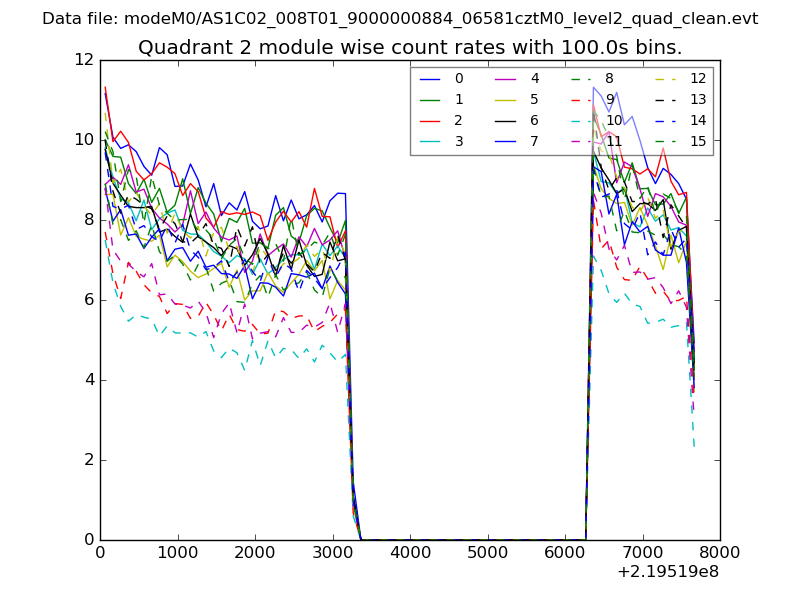
| Module-wise count rates for Quadrant B Data is divided into 100 sec bins |
 |
 |
| Module-wise count rates for Quadrant C Data is divided into 100 sec bins |
 |
 |
| Module-wise count rates for Quadrant D Data is divided into 100 sec bins |
 |
 |
| Parameter | Plot |
|---|---|
| CZT HV Monitor | 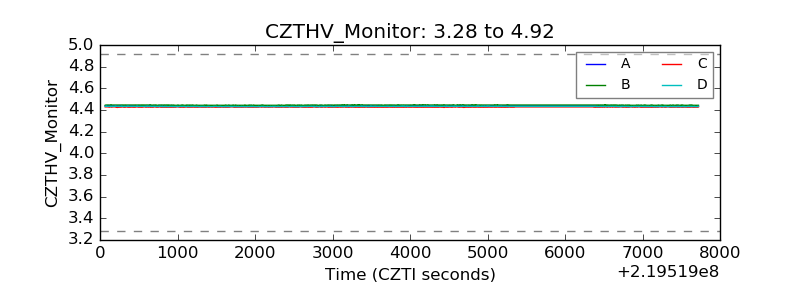 |
| D_VDD | 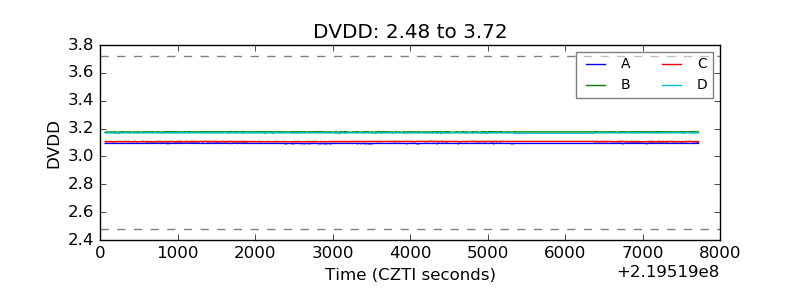 |
| Temperature 1 | 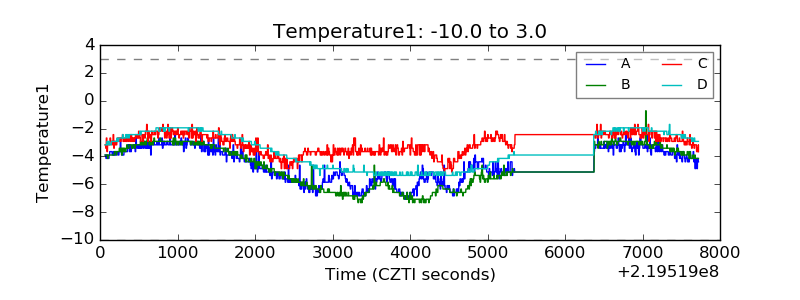 |
| Veto HV Monitor | 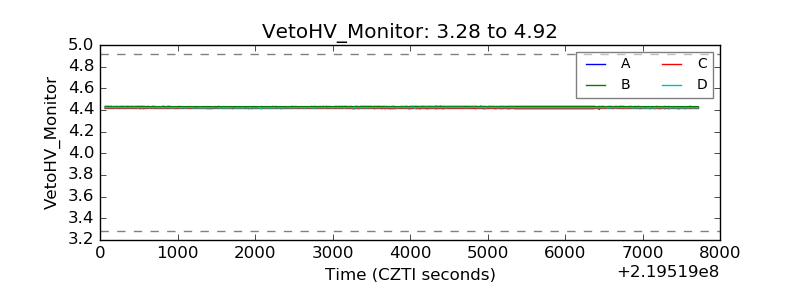 |
| Veto LLD | 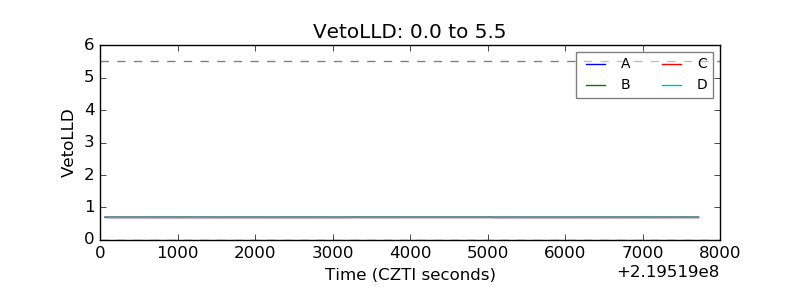 |
| Alpha Counter | 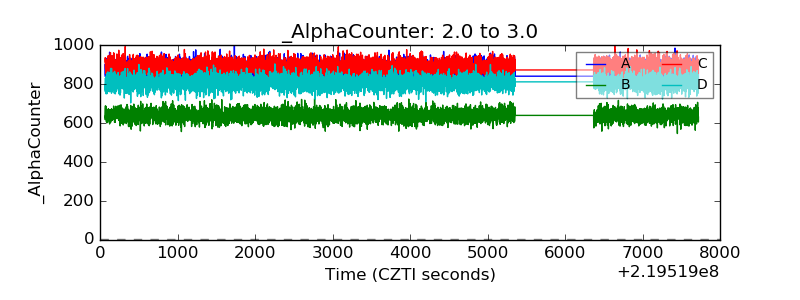 |
| _CPM_Rate | 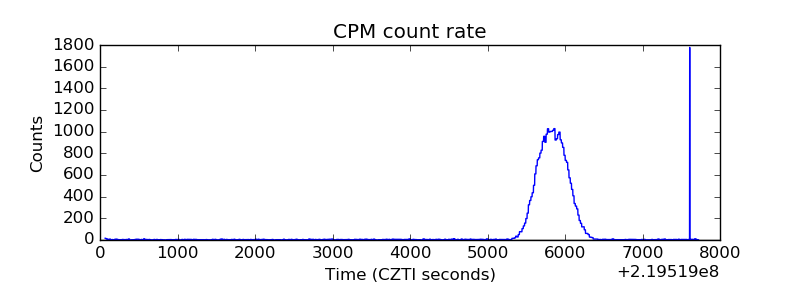 |
| CZT Counter | 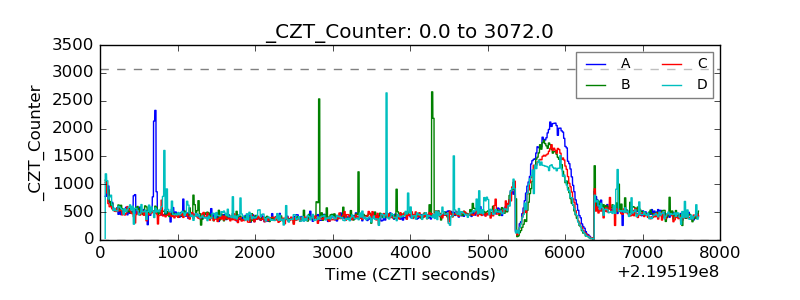 |
| +2.5 Volts monitor |  |
| +5 Volts monitor | 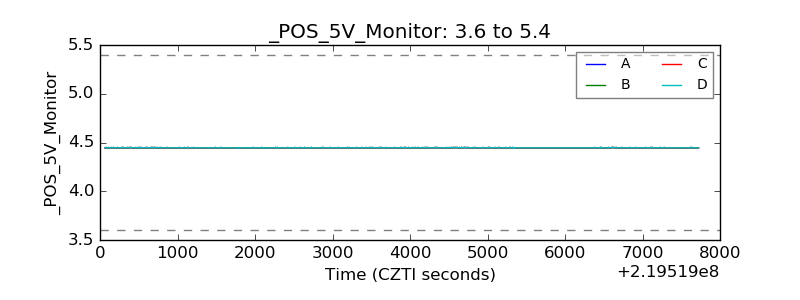 |
| _ROLL_ROT | 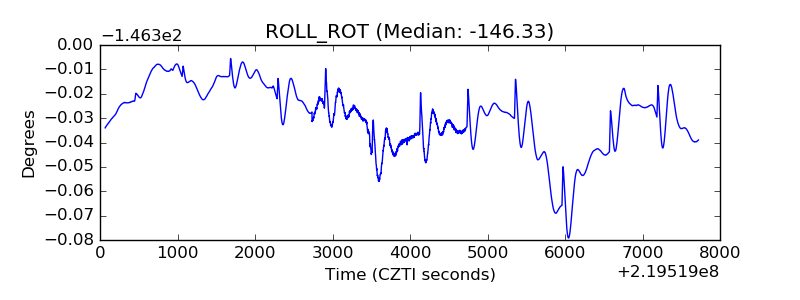 |
| _Roll_DEC | 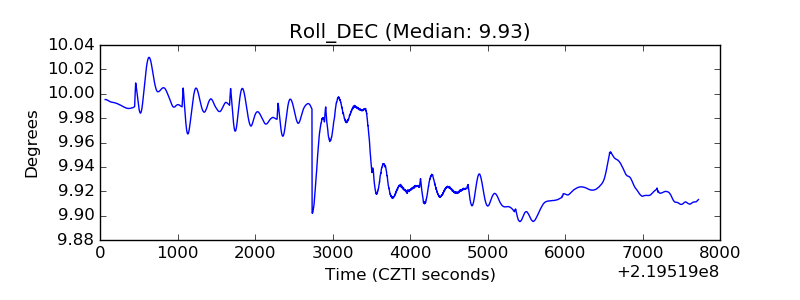 |
| _Roll_RA | 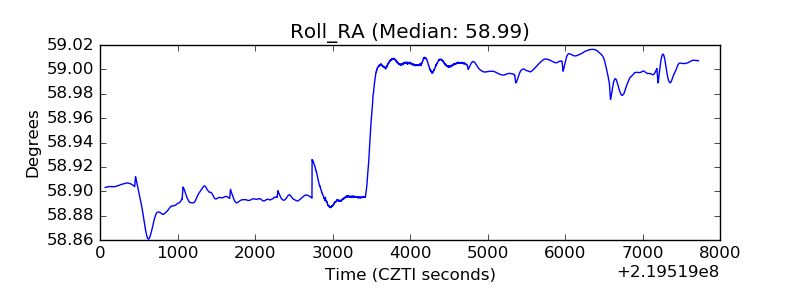 |
| Veto Counter | 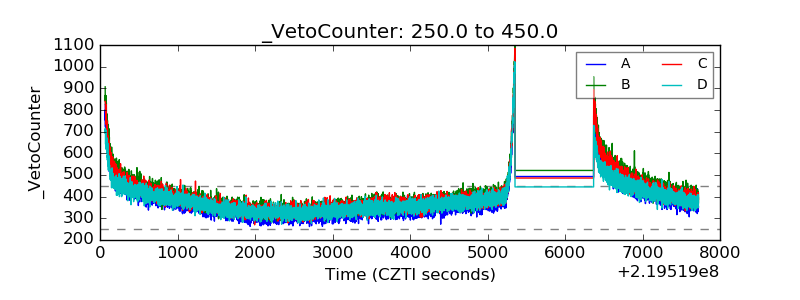 |