| Param | Original file | Final file |
|---|---|---|
| Filename | modeM0/AS1C02_008T01_9000000884_06583cztM0_level2.evt | modeM0/AS1C02_008T01_9000000884_06583cztM0_level2_quad_clean.evt |
| Size (bytes) | 452,160,000 | 90,757,440 |
| Size | 431.2 MB | 86.6 MB |
| Events in quadrant A | 3,169,657 | 581,707 |
| Events in quadrant B | 3,402,450 | 586,769 |
| Events in quadrant C | 3,054,171 | 566,532 |
| Events in quadrant D | 3,608,029 | 542,382 |
| Mode M0 | |||
|---|---|---|---|
| Quadrant | BADHDUFLAG | Total packets | Discarded packets |
| A | 0 | 13971 | 3 |
| B | 0 | 14570 | 2 |
| C | 0 | 13800 | 2 |
| D | 0 | 15547 | 2 |
| Mode M9 | |||
|---|---|---|---|
| Quadrant | BADHDUFLAG | Total packets | Discarded packets |
| A | 0 | 15 | 0 |
| B | 0 | 15 | 0 |
| C | 0 | 15 | 0 |
| D | 0 | 16 | 0 |
| Mode SS | |||
|---|---|---|---|
| Quadrant | BADHDUFLAG | Total packets | Discarded packets |
| A | 0 | 138 | 0 |
| B | 0 | 138 | 0 |
| C | 0 | 138 | 0 |
| D | 0 | 138 | 0 |
| Quadrant | Total seconds | Saturated seconds | Saturation percentage |
|---|---|---|---|
| A | 6755 | 52 | 0.769800% |
| B | 6755 | 75 | 1.110289% |
| C | 6755 | 32 | 0.473723% |
| D | 6755 | 182 | 2.694301% |
Noise dominated data is calculated using 1-second bins in cleaned event files. If a bin has >2000 counts, and if more than 50% of those come from <1% of pixels, then it is considered to be noise-dominated and hence unusable.
| Quadrant | # 1 sec bins | Bins with >0 counts | Bins with >2000 counts | High rate bins dominated by noise | Noise dominated (total time) | Noise dominated (detector-on time) | Marked lightcurve |
|---|---|---|---|---|---|---|---|
| A | 7940 | 6756 | 0 | 0 | 0.00% | 0.00% | 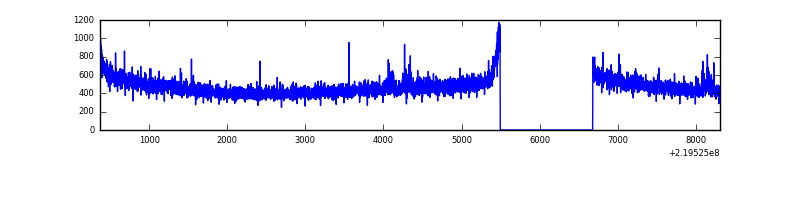 |
| B | 7940 | 6756 | 20 | 20 | 0.25% | 0.30% | 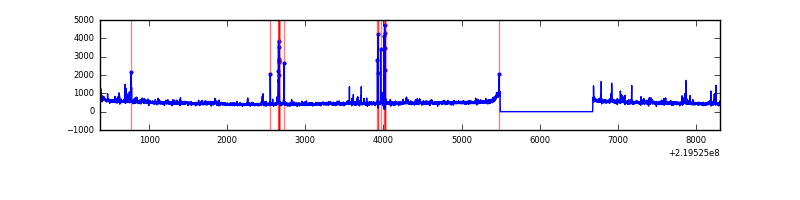 |
| C | 7940 | 6756 | 1 | 1 | 0.01% | 0.01% | 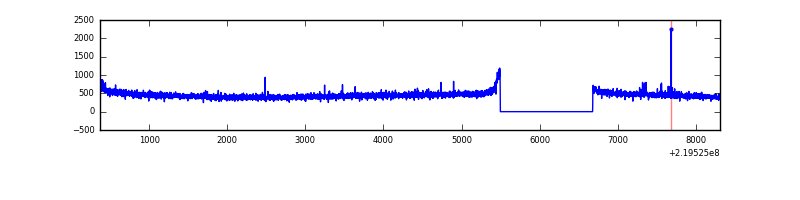 |
| D | 7940 | 6756 | 125 | 125 | 1.57% | 1.85% | 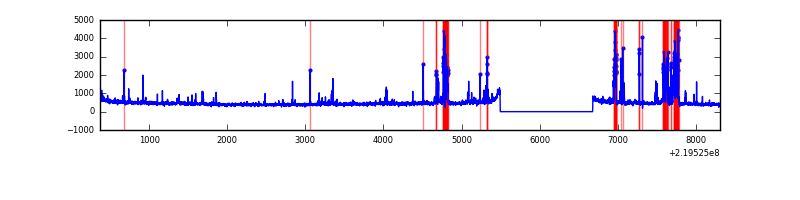 |
Top three noisy pixels from each quadrant. If the there are fewer than three noisy pixels in the level2.evt file, extra rows are filled as -1
| Pixel properties | Quadrant properties | ||||||
|---|---|---|---|---|---|---|---|
| Quadrant | DetID | PixID | Counts | Sigma | Mean | Median | Sigma |
| A | 8 | 15 | 37889 | 227.15 | 804 | 788 | 163.3 |
| A | 15 | 234 | 29580 | 176.27 | 804 | 788 | 163.3 |
| A | 0 | 226 | 7736 | 42.54 | 804 | 788 | 163.3 |
| B | 0 | 219 | 92106 | 587.07 | 808 | 790 | 155.5 |
| B | 4 | 81 | 52090 | 329.81 | 808 | 790 | 155.5 |
| B | 4 | 172 | 43193 | 272.61 | 808 | 790 | 155.5 |
| C | 9 | 54 | 20898 | 111.53 | 777 | 782 | 180.4 |
| C | 13 | 61 | 6152 | 29.77 | 777 | 782 | 180.4 |
| C | 12 | 4 | 2519 | 9.63 | 777 | 782 | 180.4 |
| D | 2 | 33 | 424905 | 2208.74 | 774 | 748 | 192.0 |
| D | 2 | 152 | 176332 | 914.33 | 774 | 748 | 192.0 |
| D | 2 | 136 | 30034 | 152.5 | 774 | 748 | 192.0 |
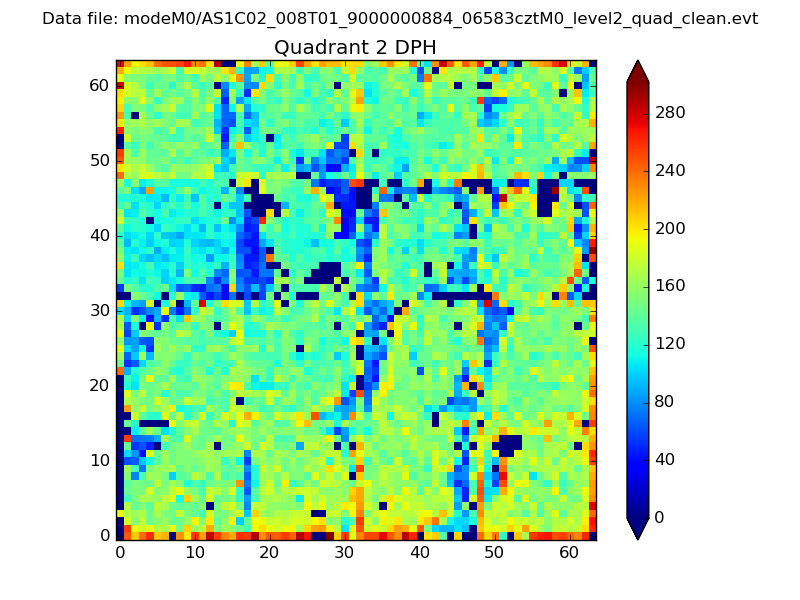
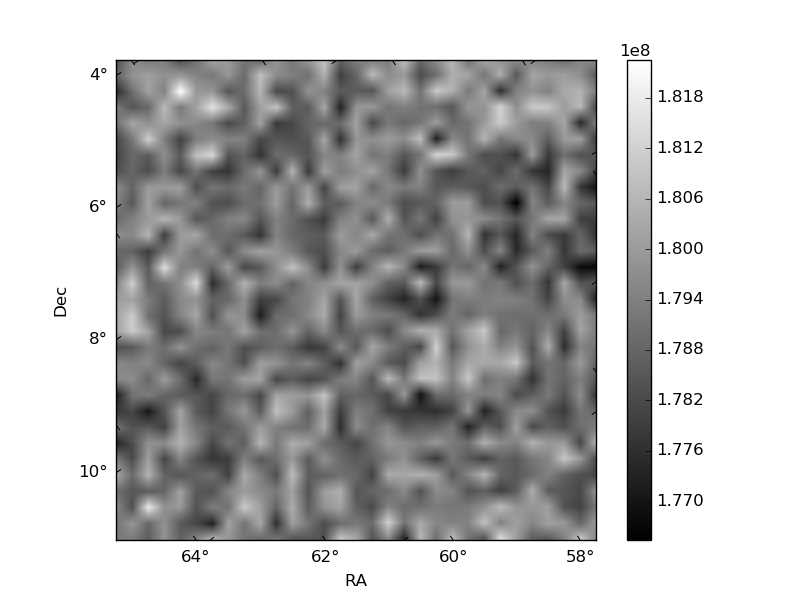
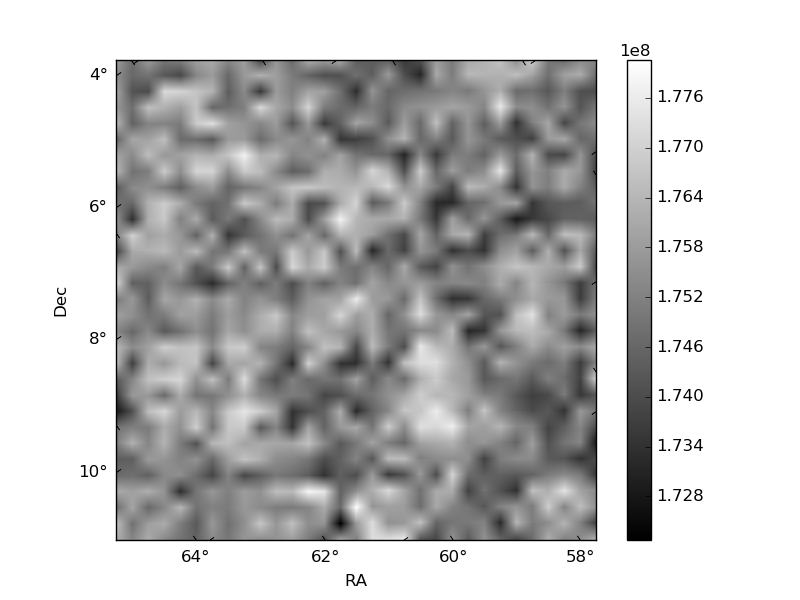
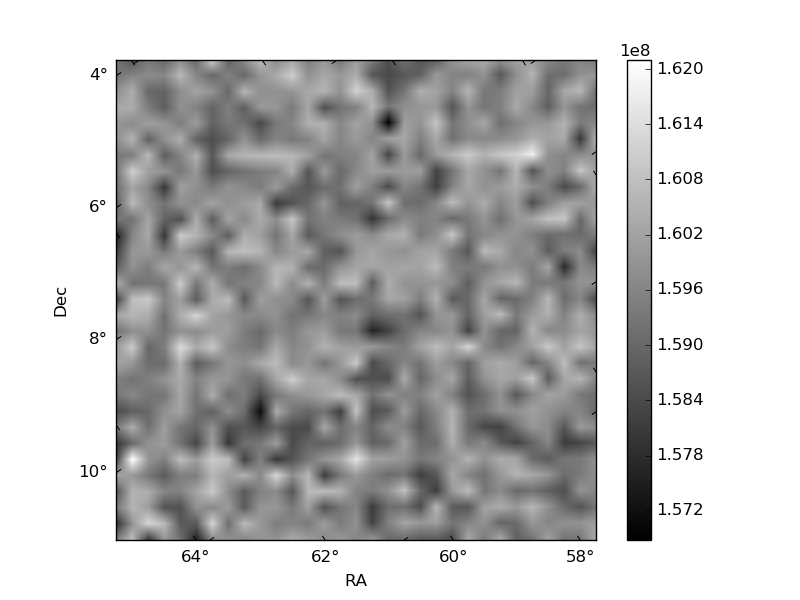
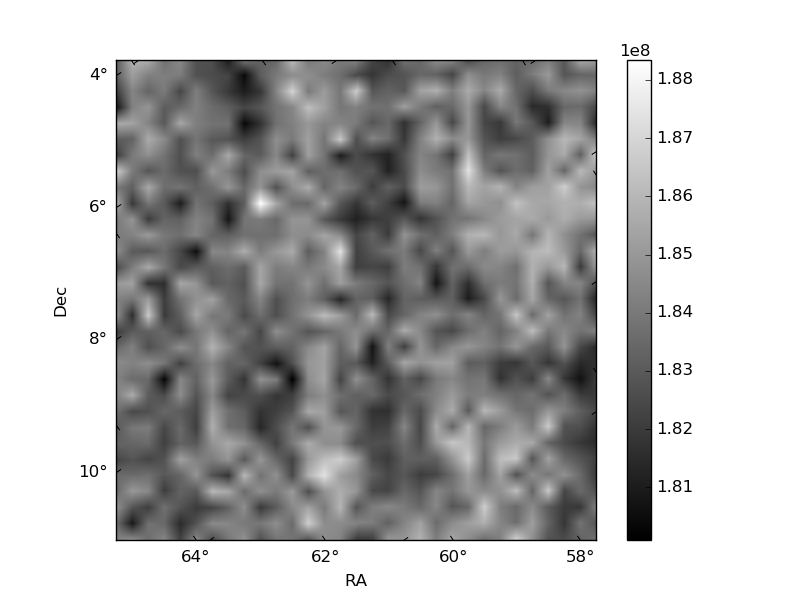
Histogram calculated using DETX and DETY for each event in the final _common_clean file
| Quadrant A |  |
 |
Quadrant B |
|---|---|---|---|
| Quadrant D | 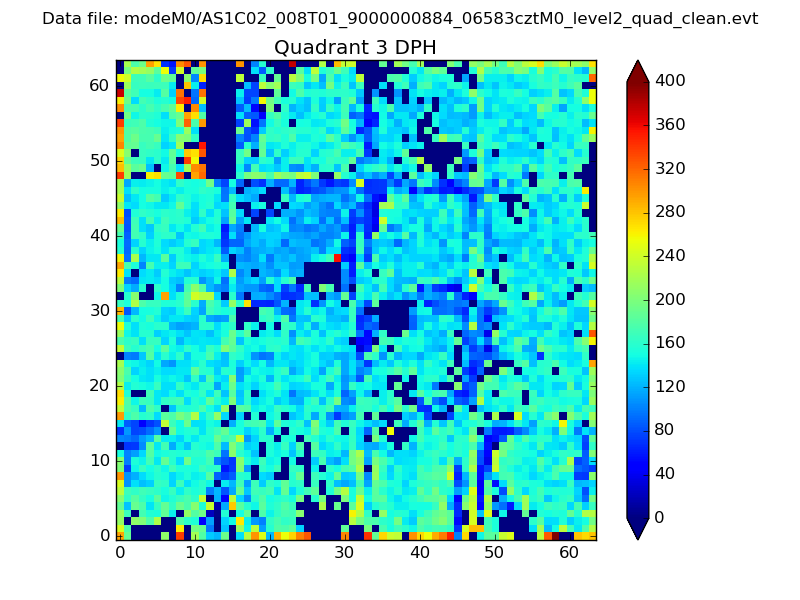 |
 |
Quadrant C |
| Plot type | Count rate plots | Images |
|---|---|---|
| Comparison with Poisson distribution Blue bars denote a histogram of data divided into 1 sec bins. Red curve is a Poisson curve with rate = median count rate of data. |
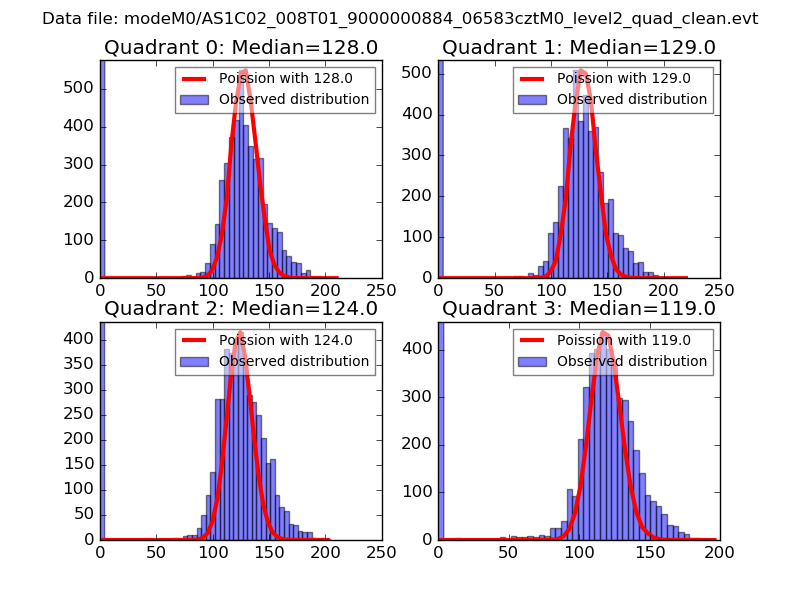 |
 |
| Quadrant-wise count rates Data is divided into 100 sec bins |
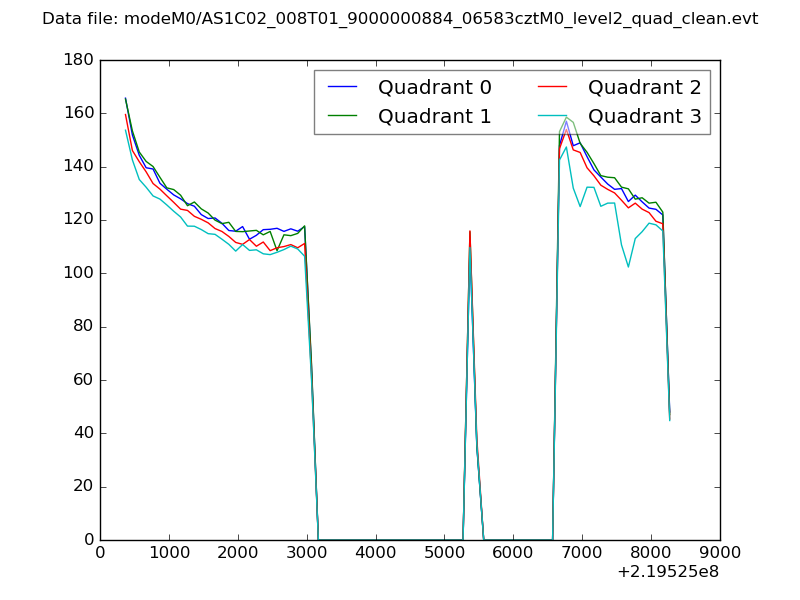 |
|
| Module-wise count rates for Quadrant A Data is divided into 100 sec bins |
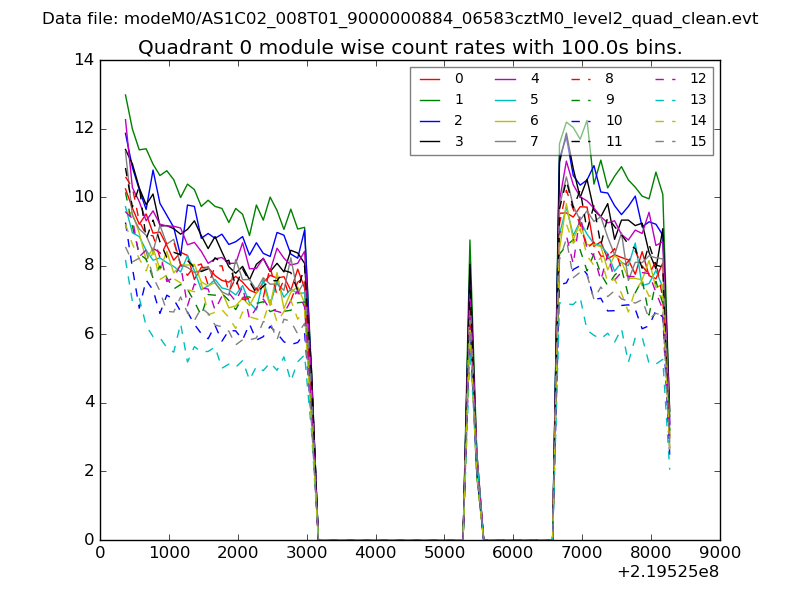 |
 |
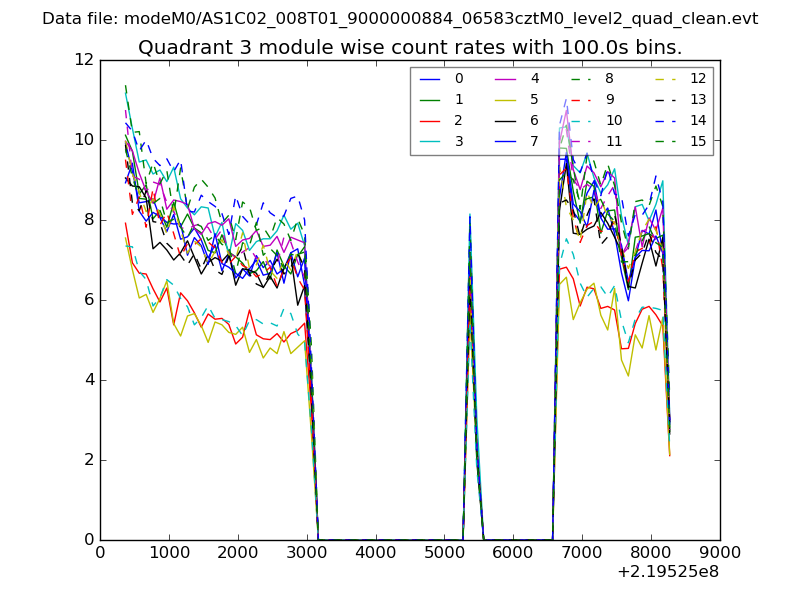
| Module-wise count rates for Quadrant B Data is divided into 100 sec bins |
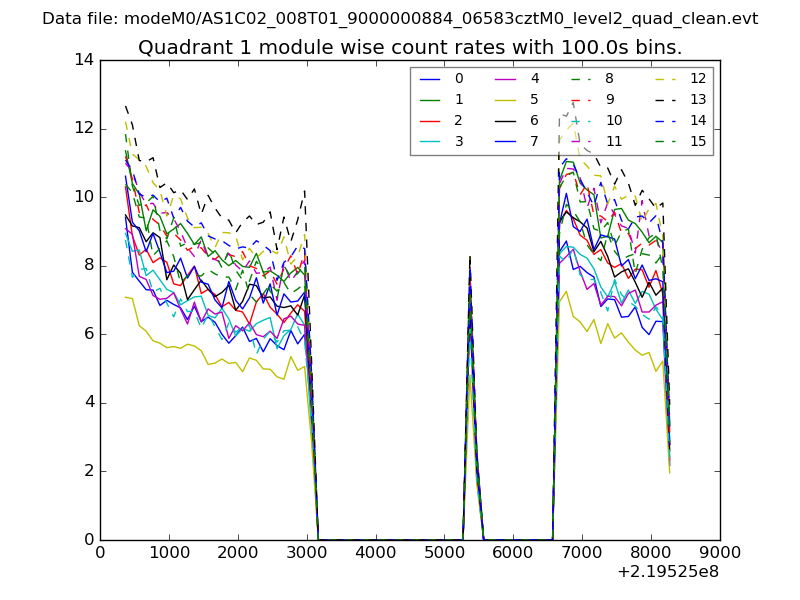 |
 |
| Module-wise count rates for Quadrant C Data is divided into 100 sec bins |
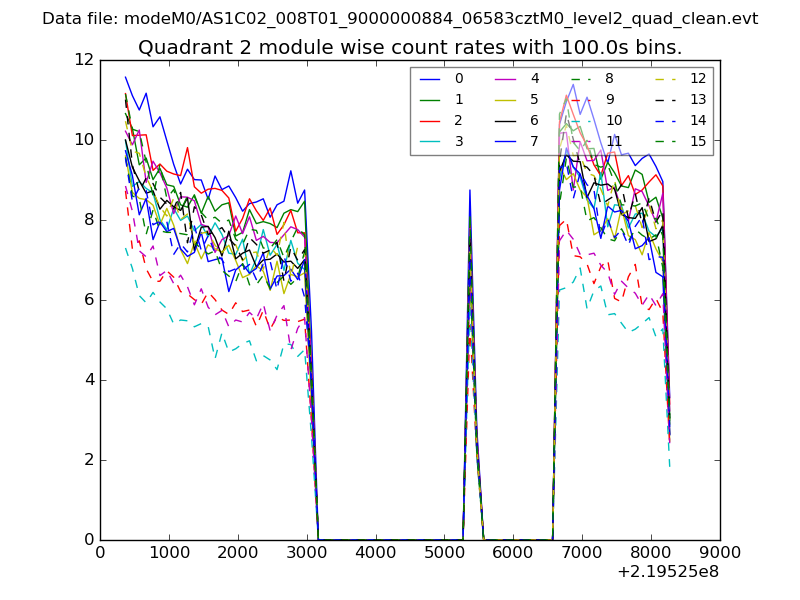 |
 |
| Module-wise count rates for Quadrant D Data is divided into 100 sec bins |
 |
 |
| Parameter | Plot |
|---|---|
| CZT HV Monitor | 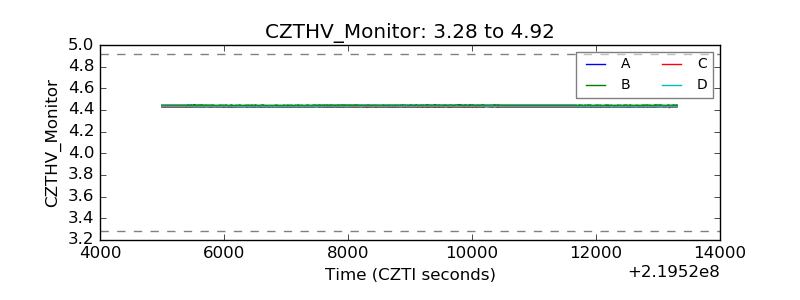 |
| D_VDD | 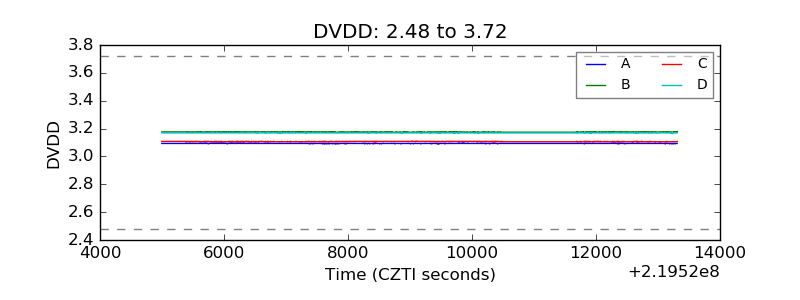 |
| Temperature 1 | 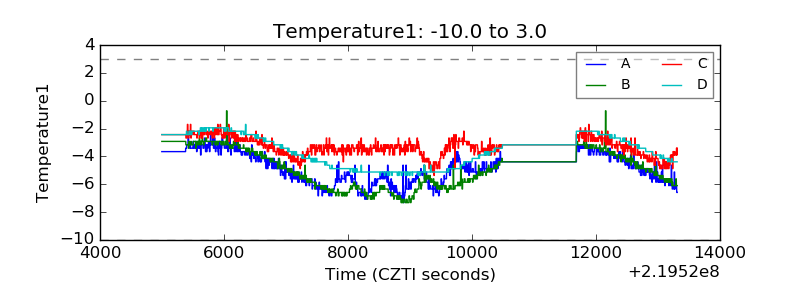 |
| Veto HV Monitor | 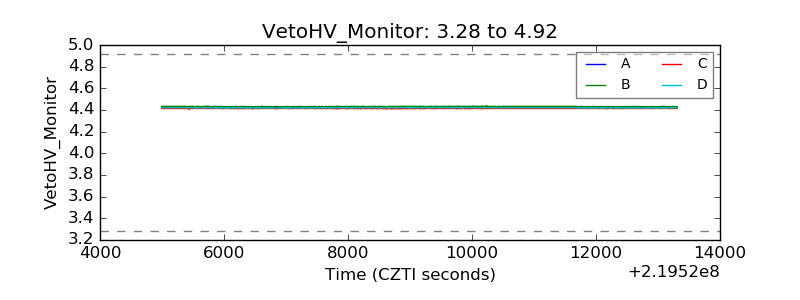 |
| Veto LLD | 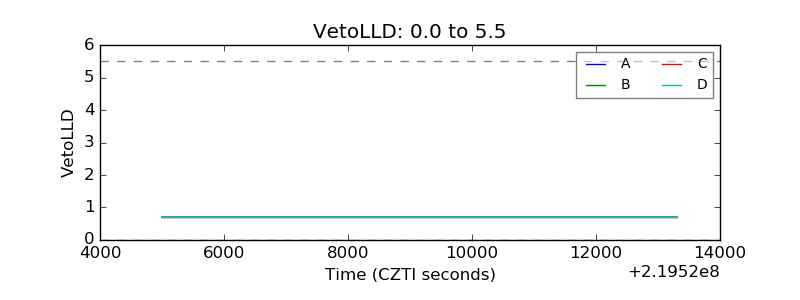 |
| Alpha Counter | 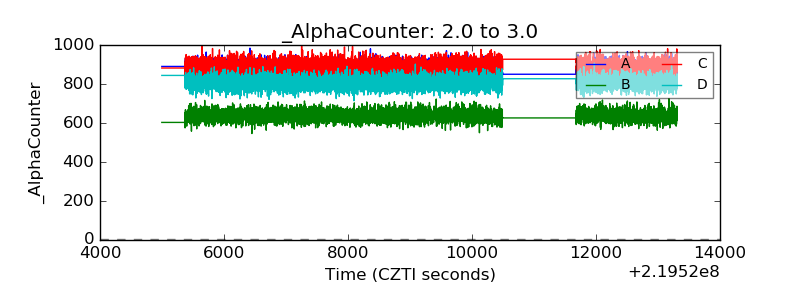 |
| _CPM_Rate | 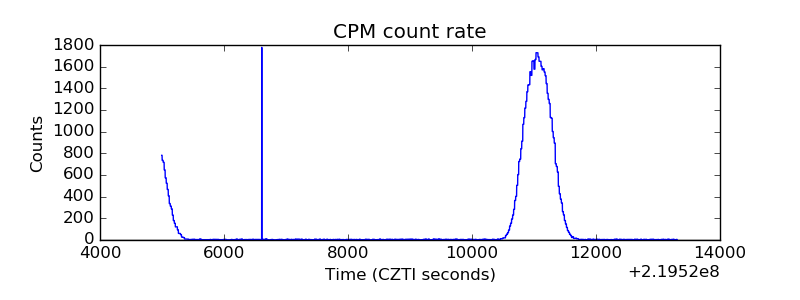 |
| CZT Counter | 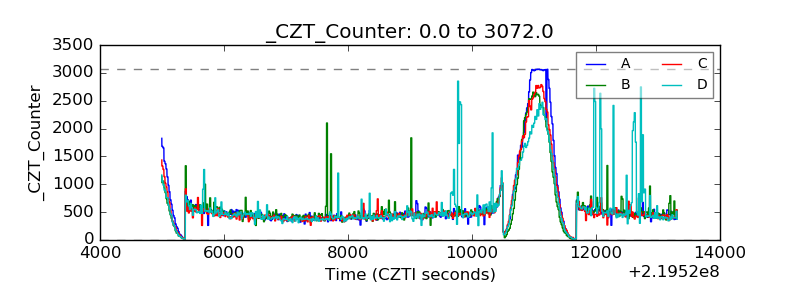 |
| +2.5 Volts monitor |  |
| +5 Volts monitor |  |
| _ROLL_ROT | 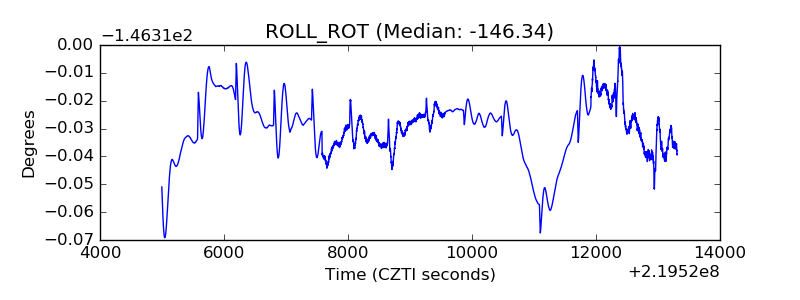 |
| _Roll_DEC | 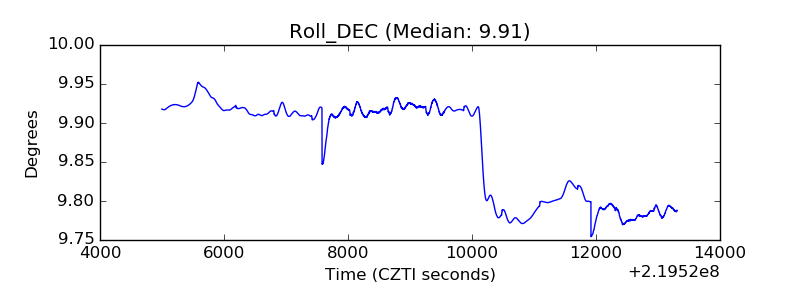 |
| _Roll_RA | 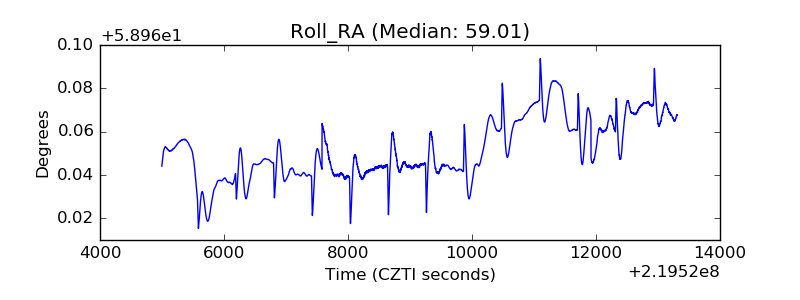 |
| Veto Counter | 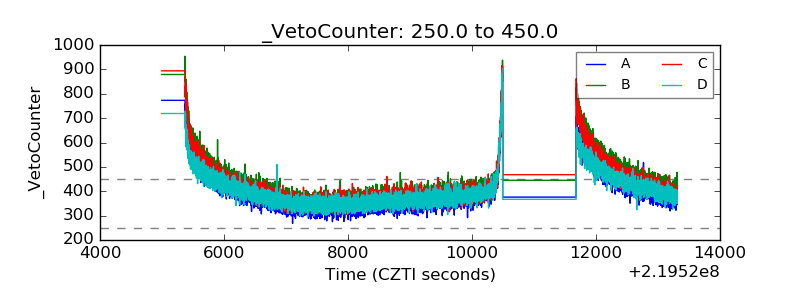 |