| Param | Original file | Final file |
|---|---|---|
| Filename | modeM0/AS1G06_169T01_9000000886cztM0_level2.fits | modeM0/AS1G06_169T01_9000000886cztM0_level2_quad_clean.evt |
| Size (bytes) | 263,160,000 | 188,648,640 |
| Size | 251.0 MB | 179.9 MB |
| Events in quadrant A | 1,590,110 | 1,001,841 |
| Events in quadrant B | 1,535,026 | 1,000,066 |
| Events in quadrant C | 1,568,100 | 950,807 |
| Events in quadrant D | 1,337,372 | 820,130 |
| Mode M9 | |||
|---|---|---|---|
| Quadrant | BADHDUFLAG | Total packets | Discarded packets |
| A | 0 | 47 | 0 |
| B | 0 | 47 | 0 |
| C | 0 | 47 | 0 |
| D | 0 | 47 | 0 |
| Mode M0 | |||
|---|---|---|---|
| Quadrant | BADHDUFLAG | Total packets | Discarded packets |
| A | 0 | 58742 | 0 |
| B | 0 | 62714 | 0 |
| C | 0 | 58164 | 0 |
| D | 0 | 72945 | 0 |
| Mode SS | |||
|---|---|---|---|
| Quadrant | BADHDUFLAG | Total packets | Discarded packets |
| A | 0 | 576 | 0 |
| B | 0 | 576 | 0 |
| C | 0 | 576 | 0 |
| D | 0 | 576 | 0 |
| Quadrant | Total seconds | Saturated seconds | Saturation percentage |
|---|---|---|---|
| A | 28189 | 509 | 1.805669% |
| B | 28189 | 597 | 2.117847% |
| C | 28189 | 310 | 1.099720% |
| D | 28189 | 1373 | 4.870694% |
Noise dominated data is calculated using 1-second bins in cleaned event files. If a bin has >2000 counts, and if more than 50% of those come from <1% of pixels, then it is considered to be noise-dominated and hence unusable.
| Quadrant | # 1 sec bins | Bins with >0 counts | Bins with >2000 counts | High rate bins dominated by noise | Noise dominated (total time) | Noise dominated (detector-on time) | Marked lightcurve |
|---|---|---|---|---|---|---|---|
| A | 32994 | 28189 | 0 | 0 | 0.00% | 0.00% |  |
| B | 32994 | 28189 | 0 | 0 | 0.00% | 0.00% |  |
| C | 32994 | 28189 | 0 | 0 | 0.00% | 0.00% |  |
| D | 32994 | 28186 | 0 | 0 | 0.00% | 0.00% |  |
Top three noisy pixels from each quadrant. If the there are fewer than three noisy pixels in the level2.evt file, extra rows are filled as -1
| Pixel properties | Quadrant properties | ||||||
|---|---|---|---|---|---|---|---|
| Quadrant | DetID | PixID | Counts | Sigma | Mean | Median | Sigma |
| A | 0 | 29 | 1542 | 10.86 | 413 | 385 | 106.5 |
| A | 7 | 110 | 1400 | 9.52 | 413 | 385 | 106.5 |
| A | 0 | 30 | 1219 | 7.82 | 413 | 385 | 106.5 |
| B | 2 | 9 | 1369 | 11.8 | 405 | 385 | 83.4 |
| B | 5 | 128 | 1086 | 8.4 | 405 | 385 | 83.4 |
| B | 12 | 226 | 1084 | 8.38 | 405 | 385 | 83.4 |
| C | 1 | 80 | 1176 | 7.21 | 414 | 382 | 110.2 |
| C | 1 | 81 | 1132 | 6.81 | 414 | 382 | 110.2 |
| C | 2 | 191 | 1062 | 6.17 | 414 | 382 | 110.2 |
| D | 3 | 14 | 1005 | 6.41 | 381 | 346 | 102.8 |
| D | 11 | 82 | 983 | 6.2 | 381 | 346 | 102.8 |
| D | 6 | 231 | 972 | 6.09 | 381 | 346 | 102.8 |
Histogram calculated using DETX and DETY for each event in the final _common_clean file
| Quadrant A | 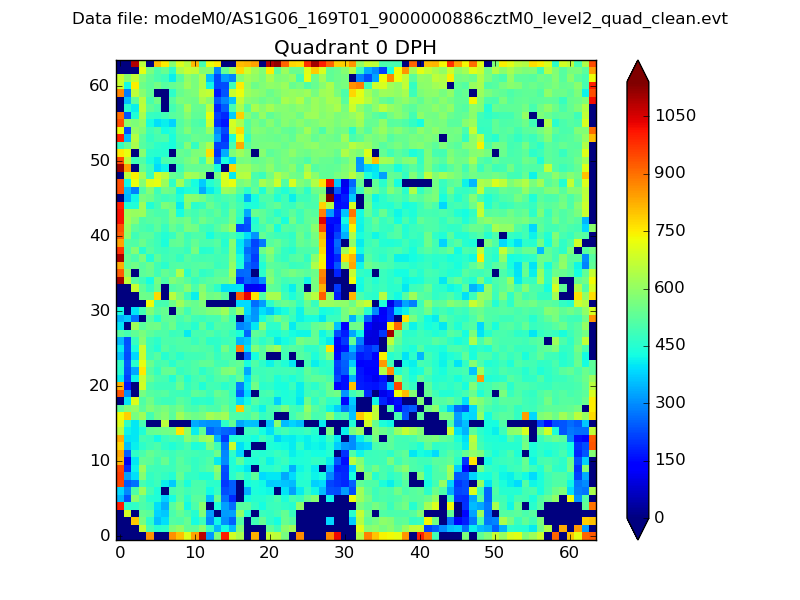 |
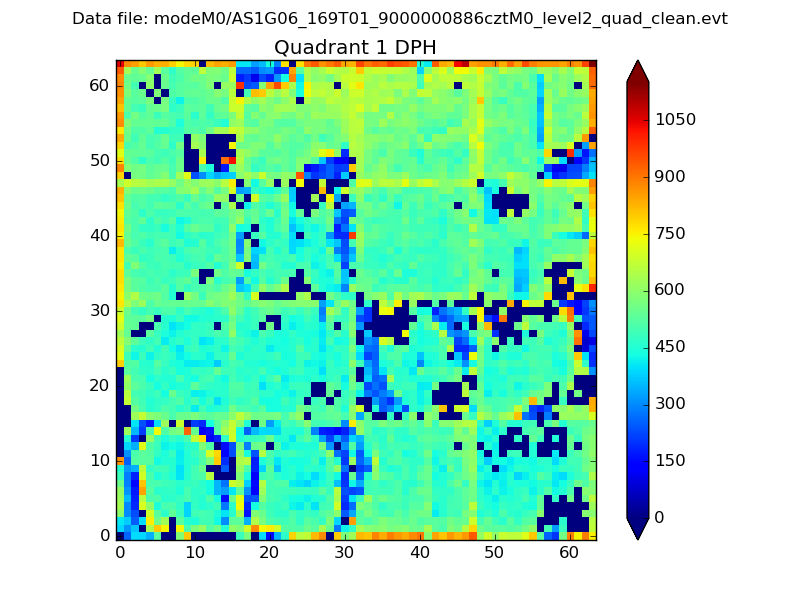 |
Quadrant B |
|---|---|---|---|
| Quadrant D |  |
 |
Quadrant C |
| Plot type | Count rate plots | Images |
|---|---|---|
| Comparison with Poisson distribution Blue bars denote a histogram of data divided into 1 sec bins. Red curve is a Poisson curve with rate = median count rate of data. |
 |
 |
| Quadrant-wise count rates Data is divided into 100 sec bins |
 |
|
| Module-wise count rates for Quadrant A Data is divided into 100 sec bins |
 |
 |
| Module-wise count rates for Quadrant B Data is divided into 100 sec bins |
 |
 |
| Module-wise count rates for Quadrant C Data is divided into 100 sec bins |
 |
 |
| Module-wise count rates for Quadrant D Data is divided into 100 sec bins |
 |
 |
| Parameter | Plot |
|---|---|
| CZT HV Monitor |  |
| D_VDD |  |
| Temperature 1 |  |
| Veto HV Monitor |  |
| Veto LLD |  |
| Alpha Counter |  |
| _CPM_Rate |  |
| CZT Counter |  |
| +2.5 Volts monitor |  |
| +5 Volts monitor |  |
| _ROLL_ROT |  |
| _Roll_DEC |  |
| _Roll_RA |  |
| Veto Counter |  |