| Param | Original file | Final file |
|---|---|---|
| Filename | modeM0/AS1G06_169T01_9000000886_06585cztM0_level2.evt | modeM0/AS1G06_169T01_9000000886_06585cztM0_level2_quad_clean.evt |
| Size (bytes) | 296,867,520 | 54,907,200 |
| Size | 283.1 MB | 52.4 MB |
| Events in quadrant A | 2,115,147 | 341,955 |
| Events in quadrant B | 2,261,819 | 350,181 |
| Events in quadrant C | 2,032,323 | 338,921 |
| Events in quadrant D | 2,283,965 | 324,666 |
| Mode M9 | |||
|---|---|---|---|
| Quadrant | BADHDUFLAG | Total packets | Discarded packets |
| A | 0 | 13 | 0 |
| B | 0 | 13 | 0 |
| C | 0 | 13 | 0 |
| D | 0 | 13 | 0 |
| Mode M0 | |||
|---|---|---|---|
| Quadrant | BADHDUFLAG | Total packets | Discarded packets |
| A | 0 | 9067 | 2 |
| B | 0 | 9534 | 1 |
| C | 0 | 9001 | 1 |
| D | 0 | 9814 | 1 |
| Mode SS | |||
|---|---|---|---|
| Quadrant | BADHDUFLAG | Total packets | Discarded packets |
| A | 0 | 88 | 0 |
| B | 0 | 88 | 0 |
| C | 0 | 88 | 0 |
| D | 0 | 88 | 0 |
| Quadrant | Total seconds | Saturated seconds | Saturation percentage |
|---|---|---|---|
| A | 4360 | 30 | 0.688073% |
| B | 4360 | 54 | 1.238532% |
| C | 4360 | 22 | 0.504587% |
| D | 4360 | 58 | 1.330275% |
Noise dominated data is calculated using 1-second bins in cleaned event files. If a bin has >2000 counts, and if more than 50% of those come from <1% of pixels, then it is considered to be noise-dominated and hence unusable.
| Quadrant | # 1 sec bins | Bins with >0 counts | Bins with >2000 counts | High rate bins dominated by noise | Noise dominated (total time) | Noise dominated (detector-on time) | Marked lightcurve |
|---|---|---|---|---|---|---|---|
| A | 5655 | 4361 | 0 | 0 | 0.00% | 0.00% | 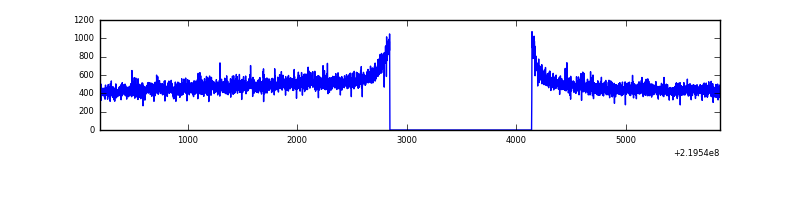 |
| B | 5655 | 4361 | 5 | 5 | 0.09% | 0.11% | 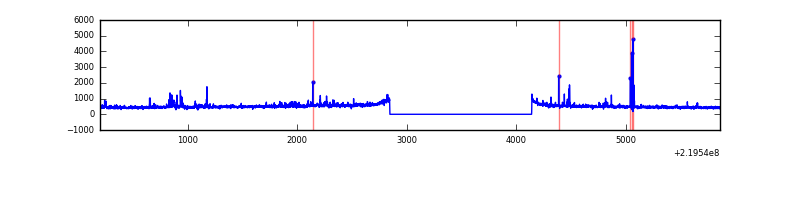 |
| C | 5655 | 4361 | 0 | 0 | 0.00% | 0.00% | 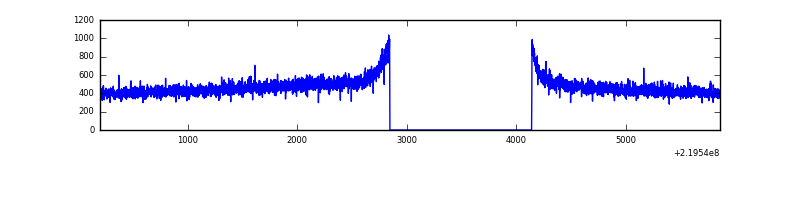 |
| D | 5655 | 4361 | 35 | 35 | 0.62% | 0.80% | 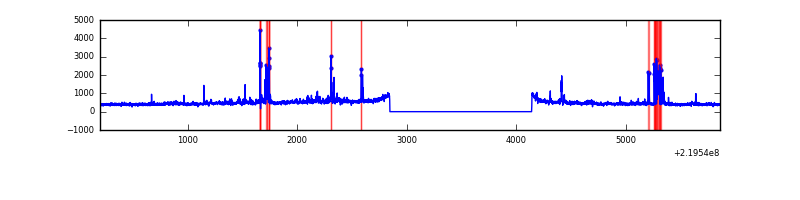 |
Top three noisy pixels from each quadrant. If the there are fewer than three noisy pixels in the level2.evt file, extra rows are filled as -1
| Pixel properties | Quadrant properties | ||||||
|---|---|---|---|---|---|---|---|
| Quadrant | DetID | PixID | Counts | Sigma | Mean | Median | Sigma |
| A | 8 | 15 | 42216 | 381.45 | 536 | 524 | 109.3 |
| A | 0 | 226 | 5234 | 43.09 | 536 | 524 | 109.3 |
| A | 12 | 194 | 4784 | 38.98 | 536 | 524 | 109.3 |
| B | 4 | 81 | 77215 | 734.29 | 541 | 528 | 104.4 |
| B | 0 | 219 | 22583 | 211.18 | 541 | 528 | 104.4 |
| B | 4 | 80 | 16727 | 155.11 | 541 | 528 | 104.4 |
| C | 13 | 61 | 4022 | 28.93 | 520 | 522 | 121.0 |
| C | 1 | 16 | 3256 | 22.6 | 520 | 522 | 121.0 |
| C | 12 | 4 | 1487 | 7.98 | 520 | 522 | 121.0 |
| D | 2 | 33 | 106893 | 828.89 | 518 | 503 | 128.4 |
| D | 14 | 34 | 100040 | 775.5 | 518 | 503 | 128.4 |
| D | 2 | 136 | 50543 | 389.87 | 518 | 503 | 128.4 |
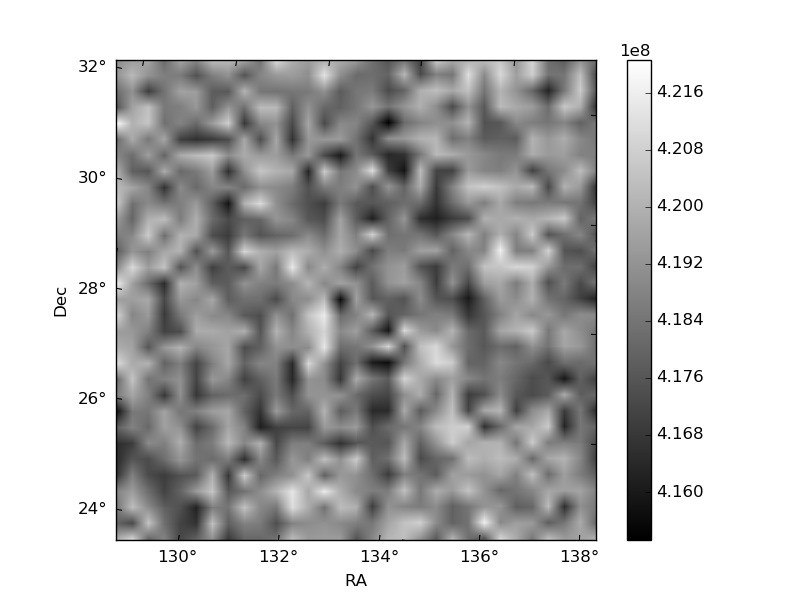
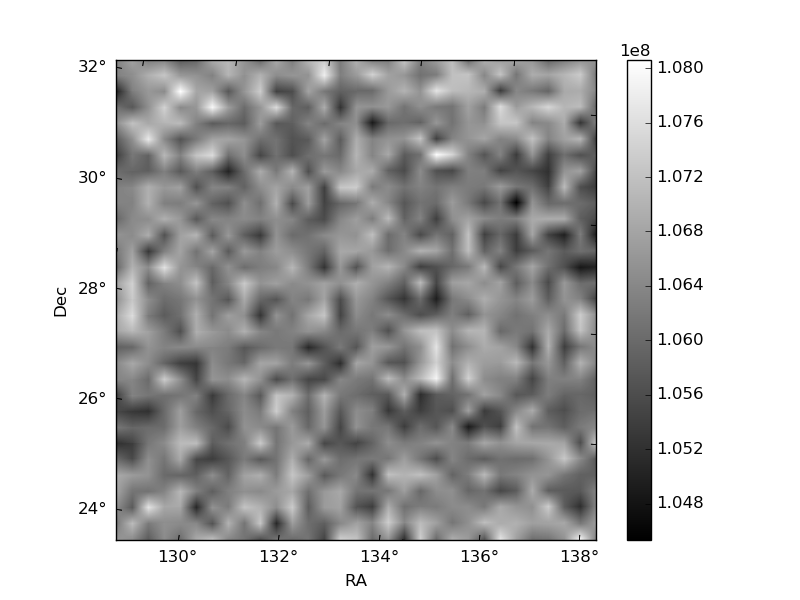
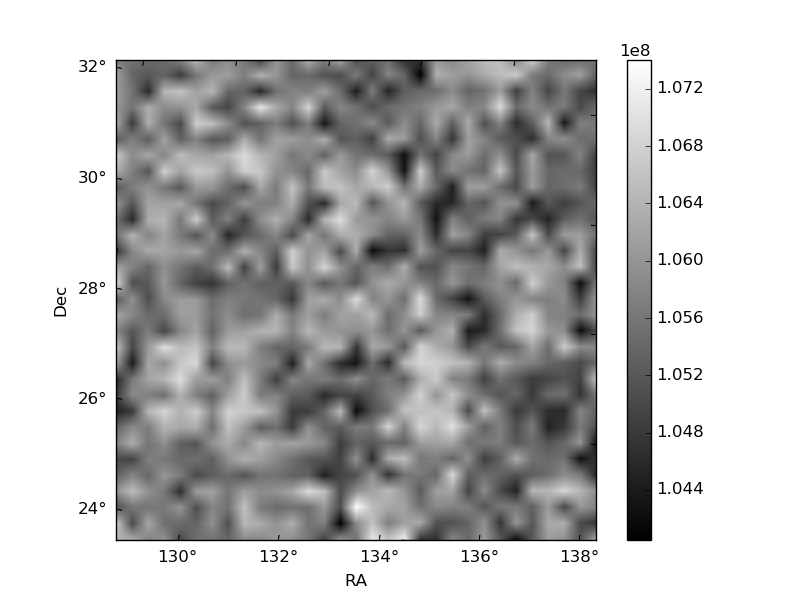
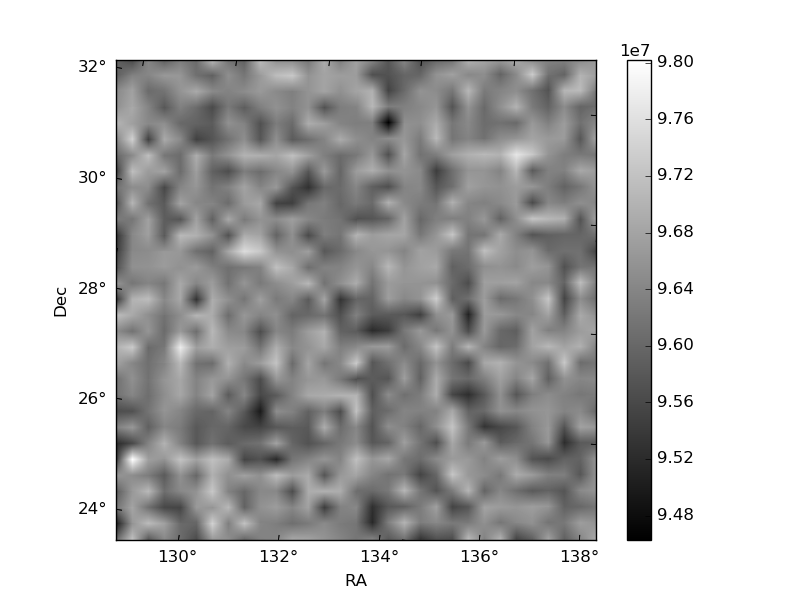
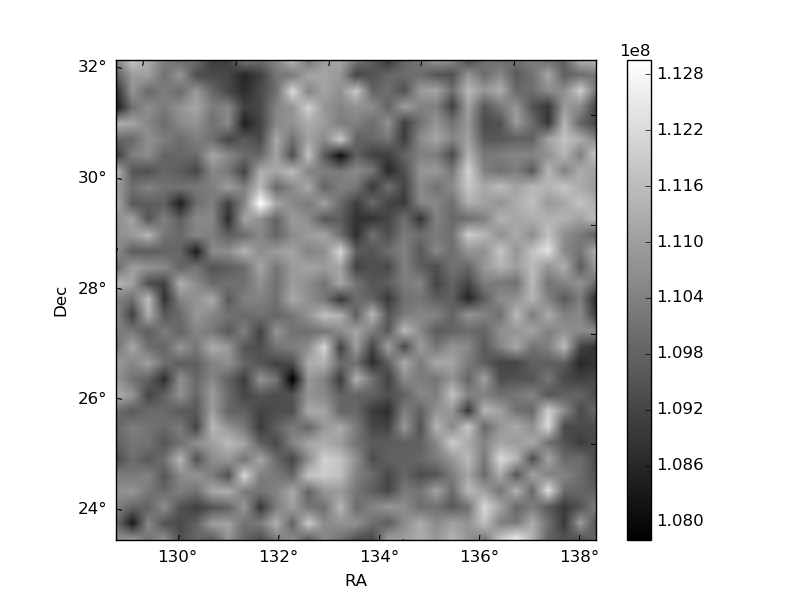
Histogram calculated using DETX and DETY for each event in the final _common_clean file
| Quadrant A | 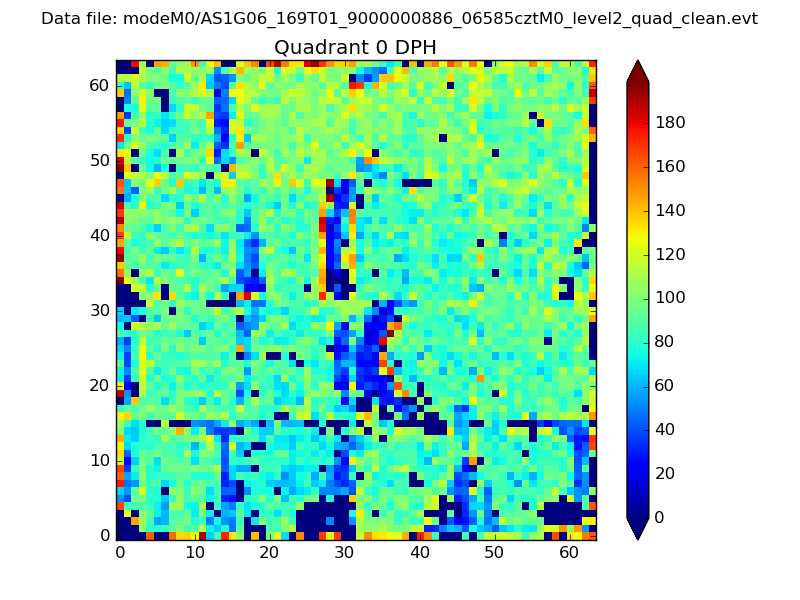 |
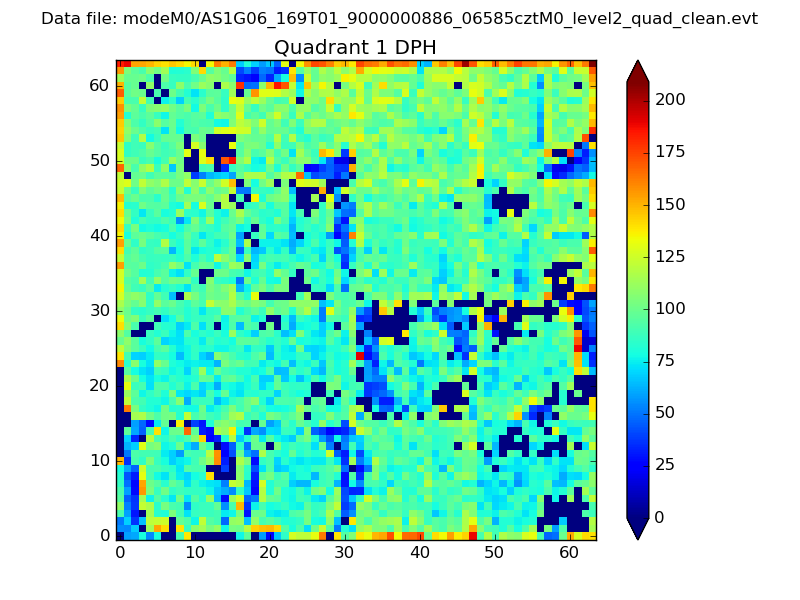 |
Quadrant B |
|---|---|---|---|
| Quadrant D | 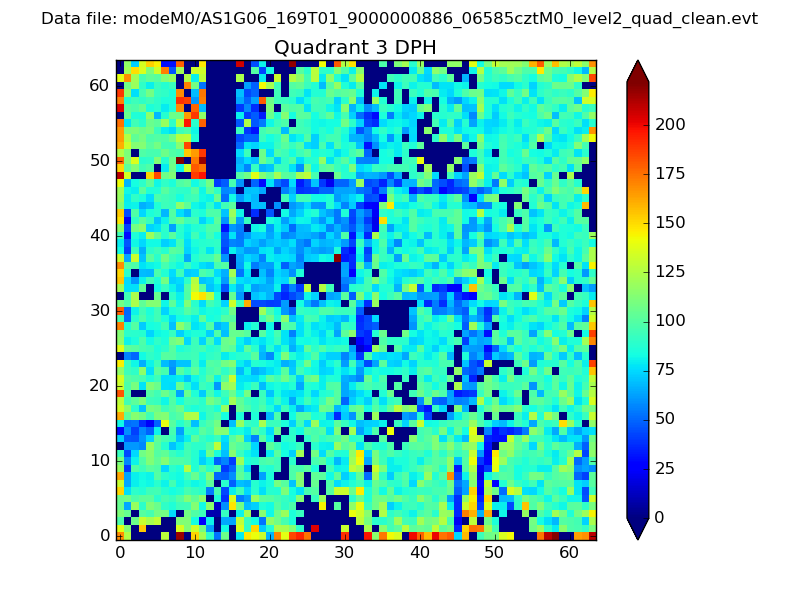 |
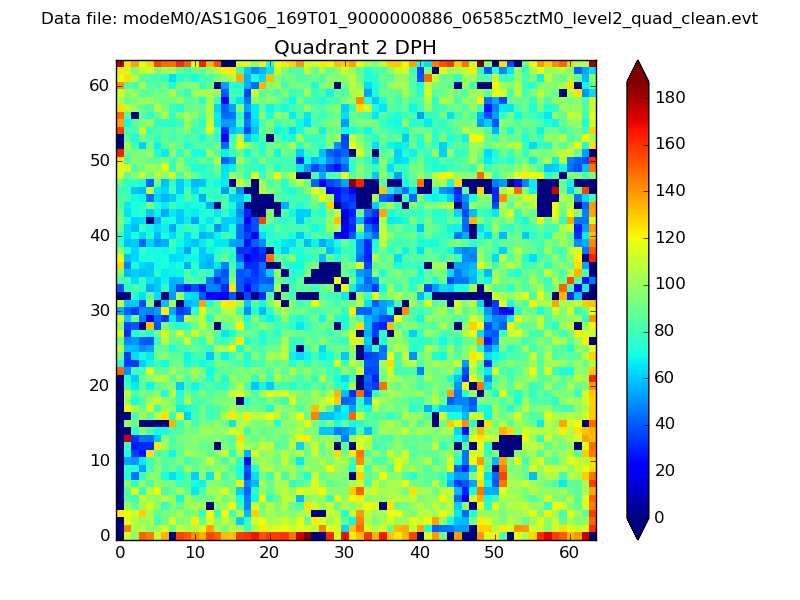 |
Quadrant C |
| Plot type | Count rate plots | Images |
|---|---|---|
| Comparison with Poisson distribution Blue bars denote a histogram of data divided into 1 sec bins. Red curve is a Poisson curve with rate = median count rate of data. |
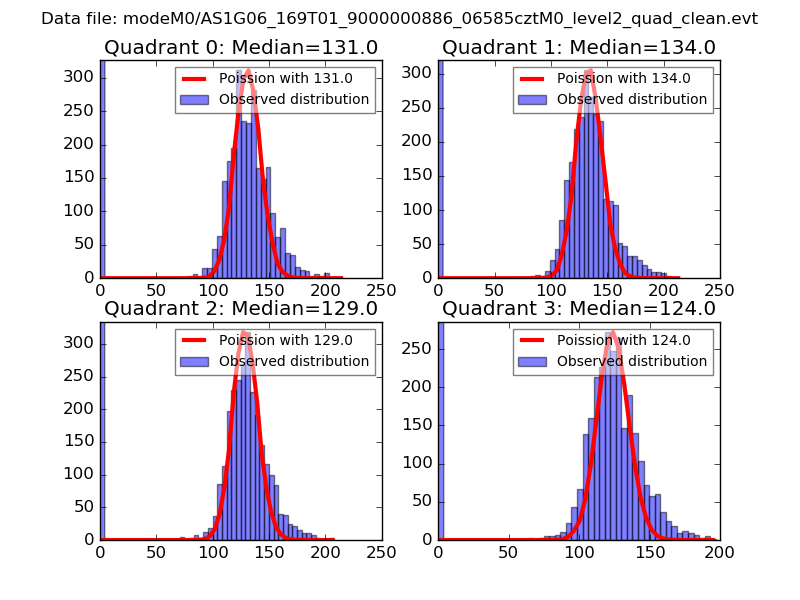 |
 |
| Quadrant-wise count rates Data is divided into 100 sec bins |
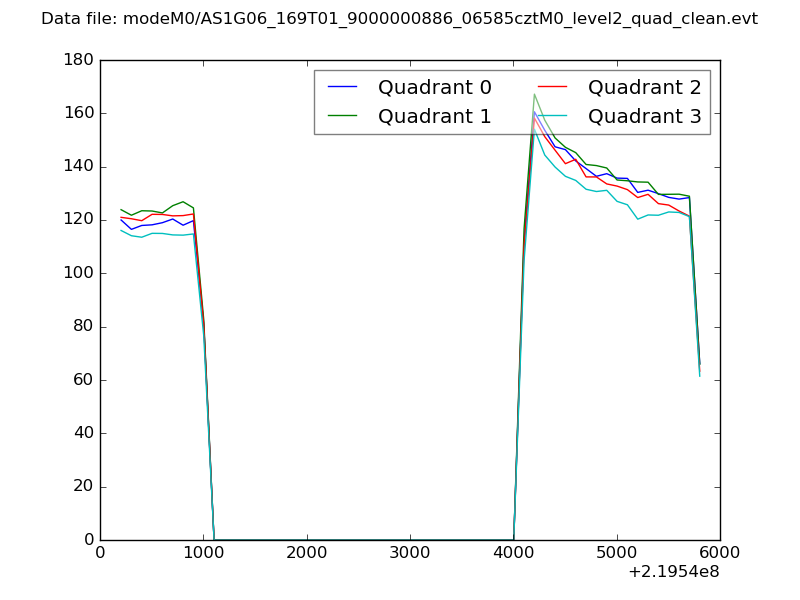 |
|
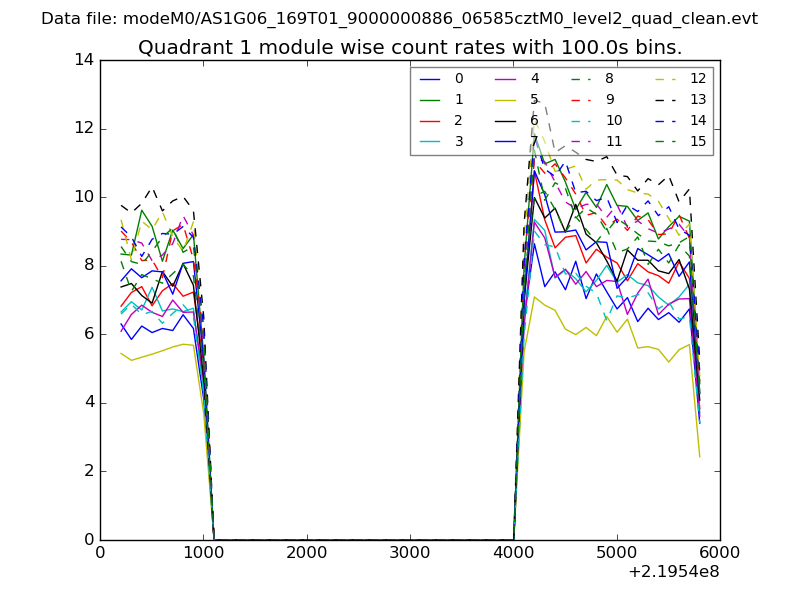
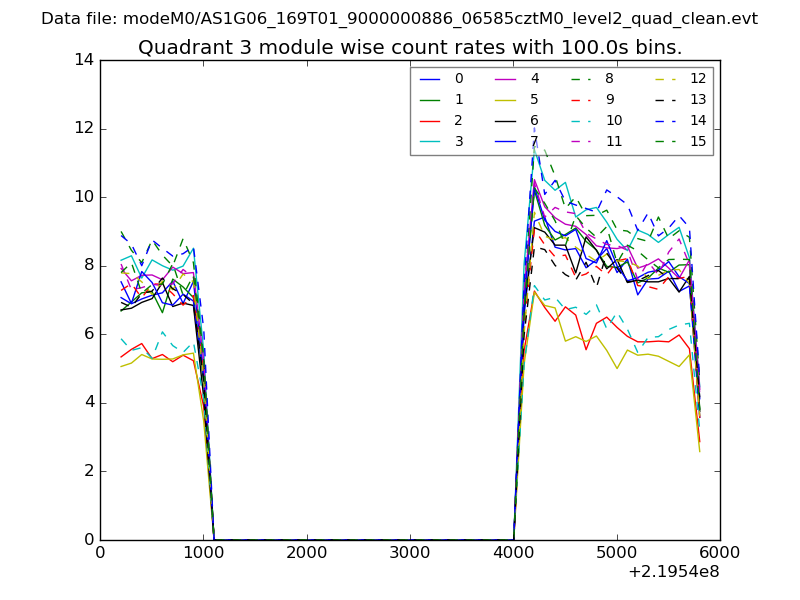
| Module-wise count rates for Quadrant A Data is divided into 100 sec bins |
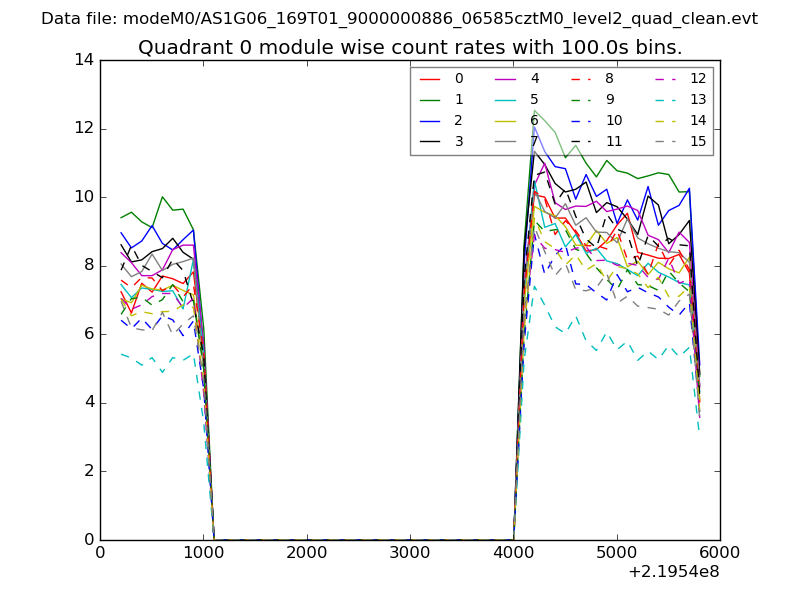 |
 |
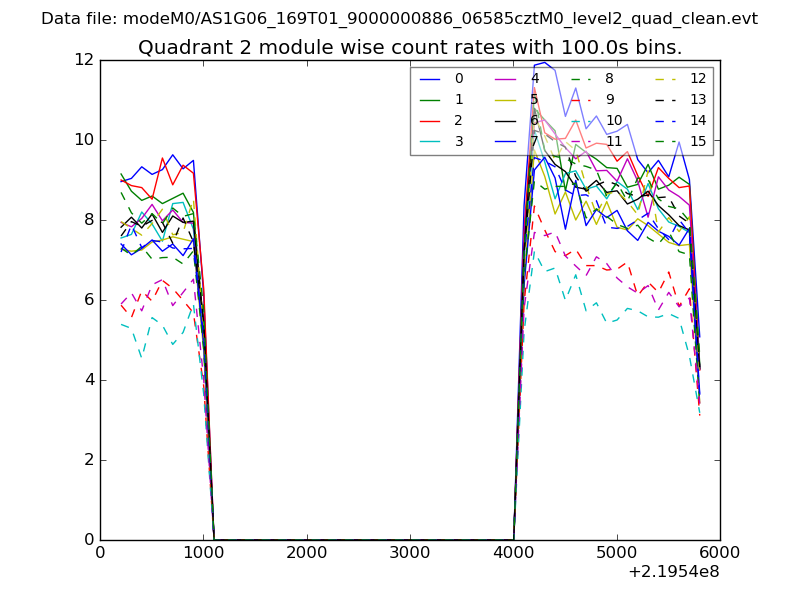
| Module-wise count rates for Quadrant B Data is divided into 100 sec bins |
 |
 |
| Module-wise count rates for Quadrant C Data is divided into 100 sec bins |
 |
 |
| Module-wise count rates for Quadrant D Data is divided into 100 sec bins |
 |
 |
| Parameter | Plot |
|---|---|
| CZT HV Monitor | 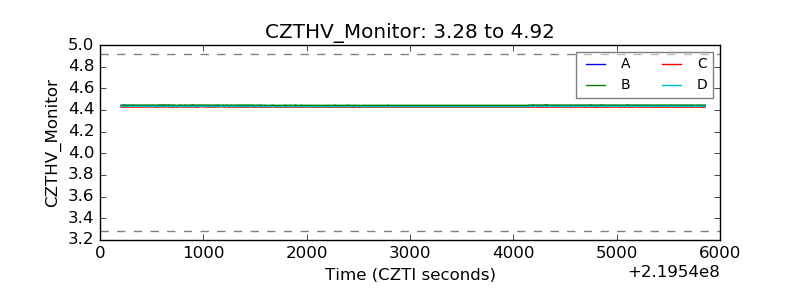 |
| D_VDD | 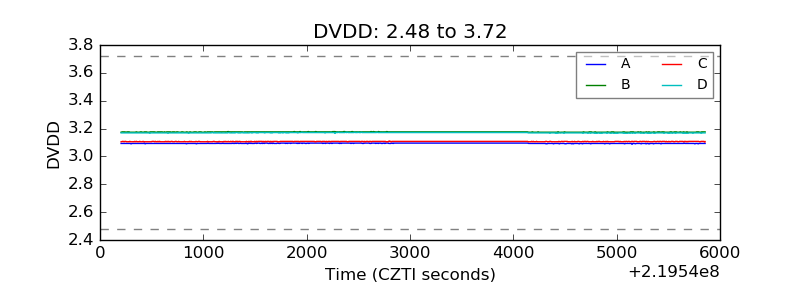 |
| Temperature 1 | 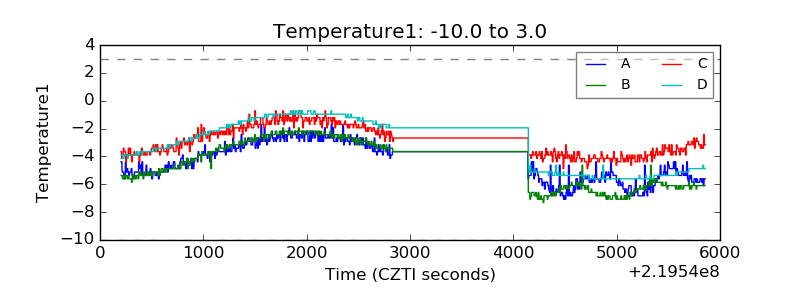 |
| Veto HV Monitor | 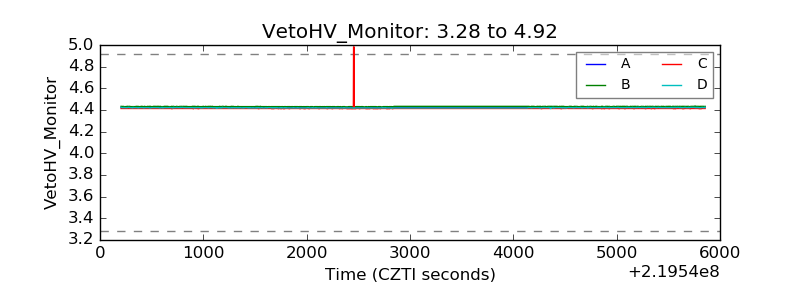 |
| Veto LLD | 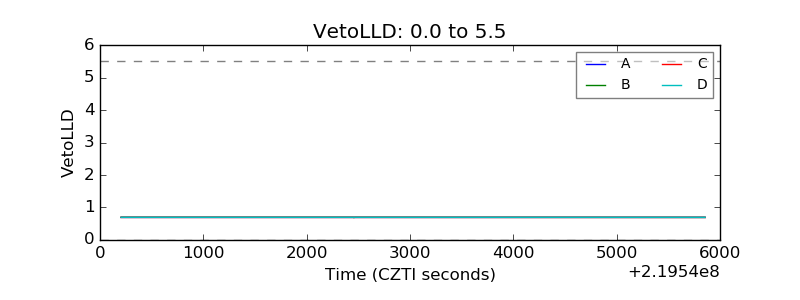 |
| Alpha Counter |  |
| _CPM_Rate | 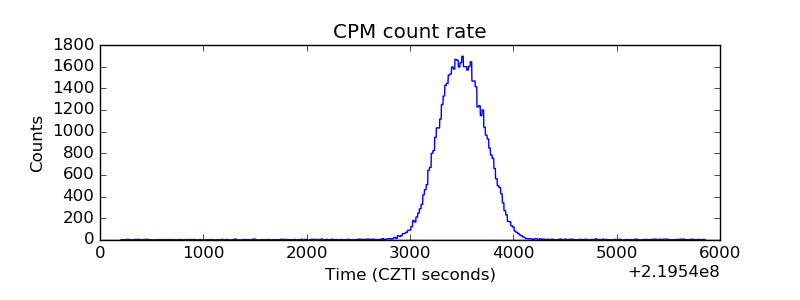 |
| CZT Counter | 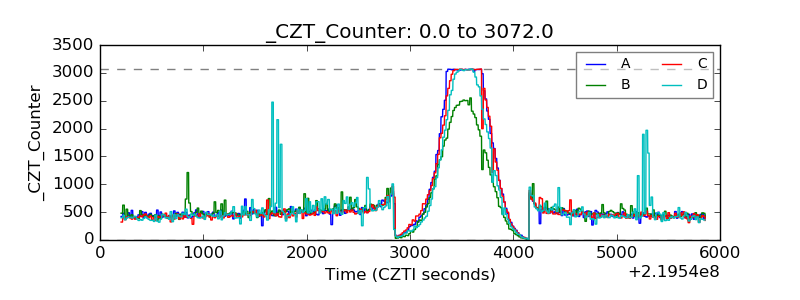 |
| +2.5 Volts monitor |  |
| +5 Volts monitor |  |
| _ROLL_ROT | 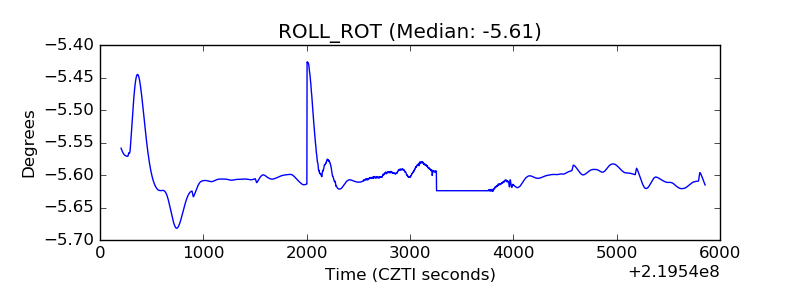 |
| _Roll_DEC | 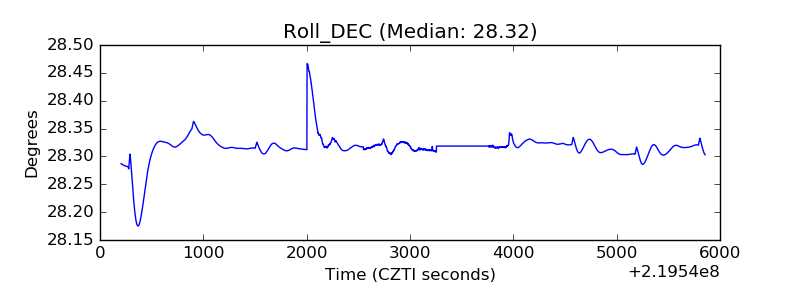 |
| _Roll_RA | 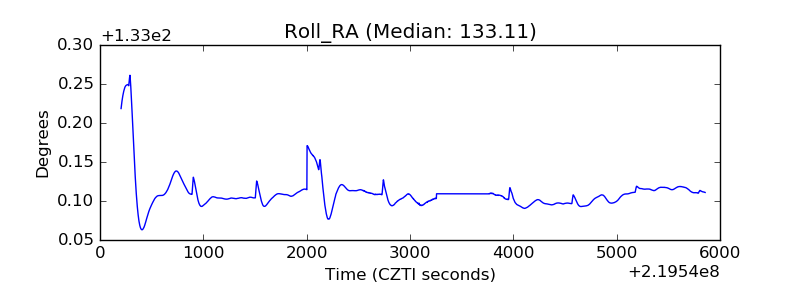 |
| Veto Counter | 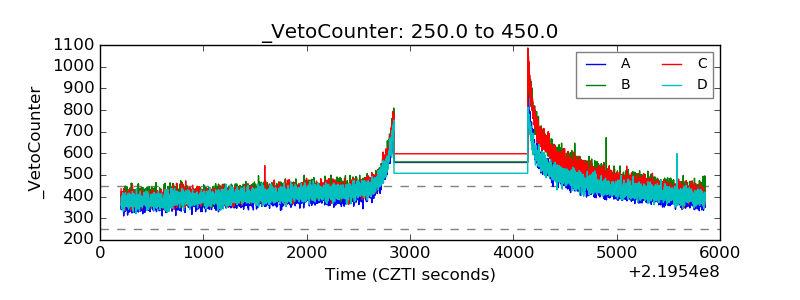 |