| Param | Original file | Final file |
|---|---|---|
| Filename | modeM0/AS1G06_169T01_9000000886_06587cztM0_level2.evt | modeM0/AS1G06_169T01_9000000886_06587cztM0_level2_quad_clean.evt |
| Size (bytes) | 461,280,960 | 81,397,440 |
| Size | 439.9 MB | 77.6 MB |
| Events in quadrant A | 3,058,809 | 515,220 |
| Events in quadrant B | 3,244,036 | 522,821 |
| Events in quadrant C | 2,886,440 | 510,053 |
| Events in quadrant D | 4,351,861 | 476,277 |
| Mode M9 | |||
|---|---|---|---|
| Quadrant | BADHDUFLAG | Total packets | Discarded packets |
| A | 0 | 10 | 0 |
| B | 0 | 10 | 0 |
| C | 0 | 10 | 0 |
| D | 0 | 10 | 0 |
| Mode M0 | |||
|---|---|---|---|
| Quadrant | BADHDUFLAG | Total packets | Discarded packets |
| A | 0 | 13328 | 3 |
| B | 0 | 13743 | 2 |
| C | 0 | 13064 | 2 |
| D | 0 | 17318 | 2 |
| Mode SS | |||
|---|---|---|---|
| Quadrant | BADHDUFLAG | Total packets | Discarded packets |
| A | 0 | 130 | 0 |
| B | 0 | 130 | 0 |
| C | 0 | 130 | 0 |
| D | 0 | 130 | 0 |
| Quadrant | Total seconds | Saturated seconds | Saturation percentage |
|---|---|---|---|
| A | 6304 | 139 | 2.204949% |
| B | 6304 | 96 | 1.522843% |
| C | 6304 | 51 | 0.809010% |
| D | 6304 | 287 | 4.552665% |
Noise dominated data is calculated using 1-second bins in cleaned event files. If a bin has >2000 counts, and if more than 50% of those come from <1% of pixels, then it is considered to be noise-dominated and hence unusable.
| Quadrant | # 1 sec bins | Bins with >0 counts | Bins with >2000 counts | High rate bins dominated by noise | Noise dominated (total time) | Noise dominated (detector-on time) | Marked lightcurve |
|---|---|---|---|---|---|---|---|
| A | 7429 | 6306 | 33 | 33 | 0.44% | 0.52% |  |
| B | 7429 | 6306 | 3 | 3 | 0.04% | 0.05% |  |
| C | 7429 | 6306 | 1 | 1 | 0.01% | 0.02% | 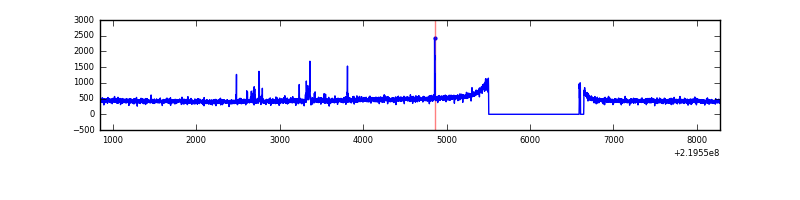 |
| D | 7429 | 6306 | 218 | 218 | 2.93% | 3.46% | 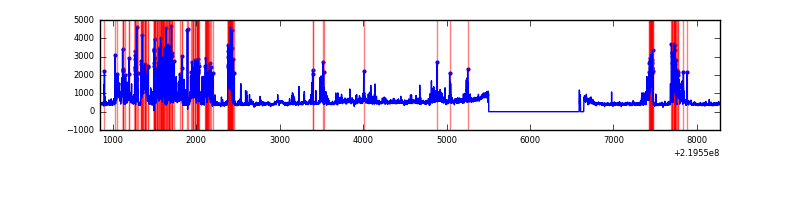 |
Top three noisy pixels from each quadrant. If the there are fewer than three noisy pixels in the level2.evt file, extra rows are filled as -1
| Pixel properties | Quadrant properties | ||||||
|---|---|---|---|---|---|---|---|
| Quadrant | DetID | PixID | Counts | Sigma | Mean | Median | Sigma |
| A | 14 | 111 | 130168 | 856.33 | 747 | 730 | 151.2 |
| A | 8 | 15 | 30708 | 198.33 | 747 | 730 | 151.2 |
| A | 0 | 226 | 7178 | 42.66 | 747 | 730 | 151.2 |
| B | 0 | 219 | 103549 | 713.15 | 753 | 736 | 144.2 |
| B | 4 | 81 | 101431 | 698.46 | 753 | 736 | 144.2 |
| B | 0 | 198 | 57148 | 391.29 | 753 | 736 | 144.2 |
| C | 9 | 54 | 46806 | 272.38 | 723 | 727 | 169.2 |
| C | 1 | 16 | 13556 | 75.83 | 723 | 727 | 169.2 |
| C | 13 | 61 | 5600 | 28.8 | 723 | 727 | 169.2 |
| D | 2 | 33 | 1277607 | 7208.73 | 719 | 695 | 177.1 |
| D | 2 | 152 | 104683 | 587.06 | 719 | 695 | 177.1 |
| D | 2 | 136 | 79932 | 447.33 | 719 | 695 | 177.1 |
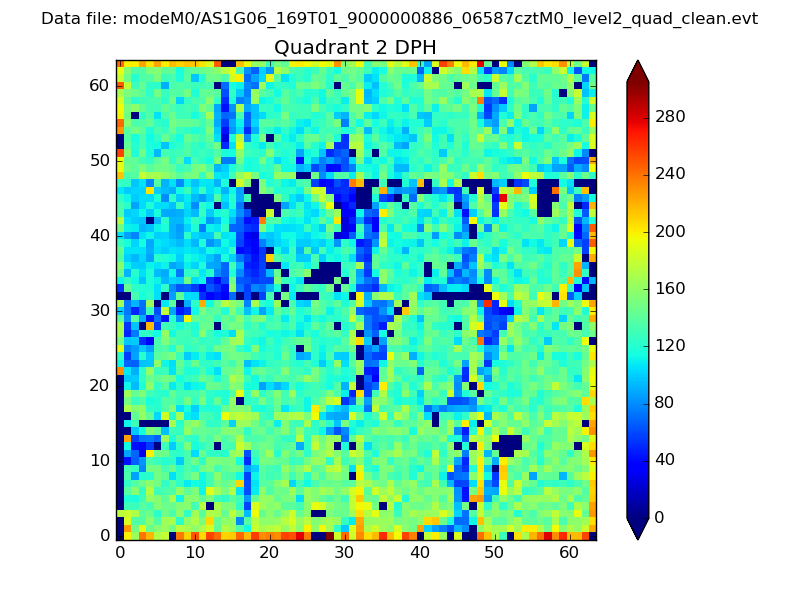
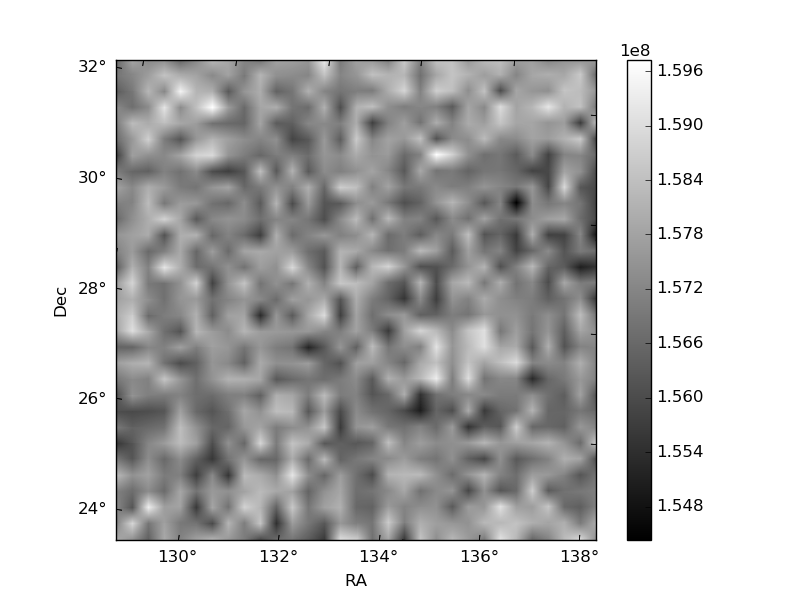
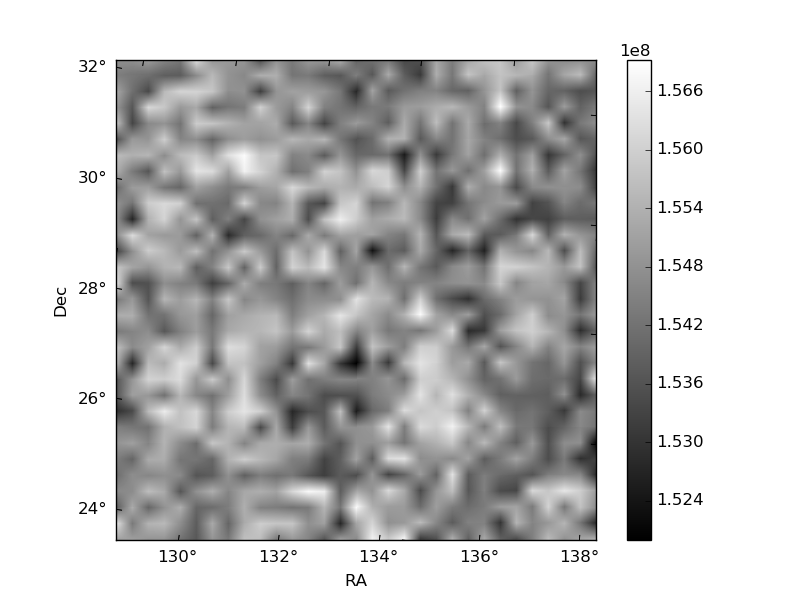
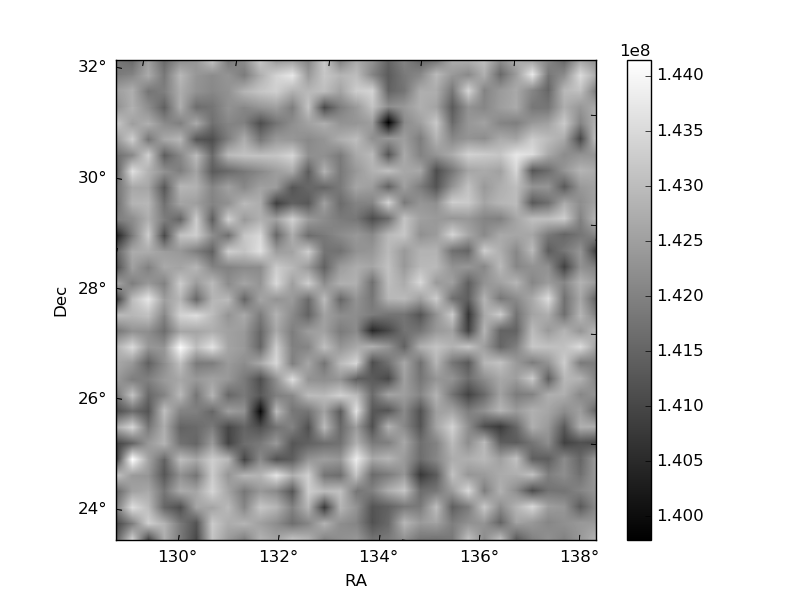
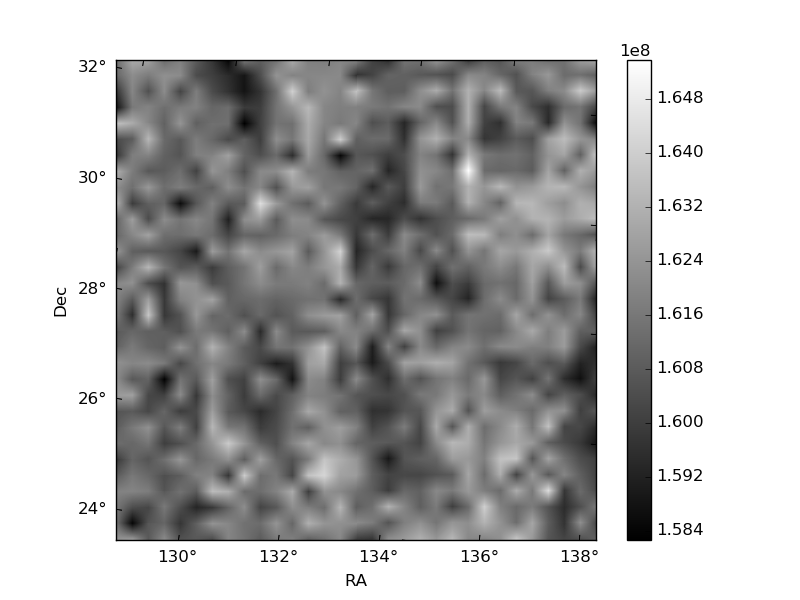
Histogram calculated using DETX and DETY for each event in the final _common_clean file
| Quadrant A | 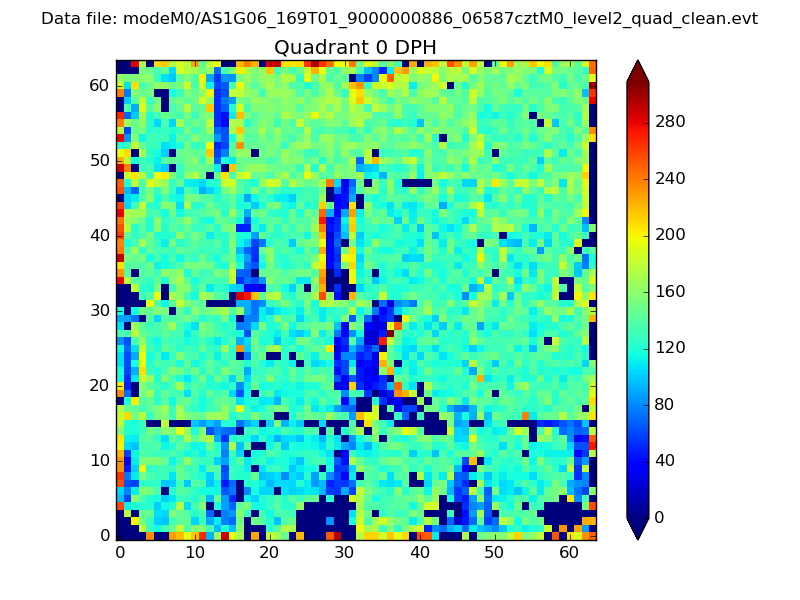 |
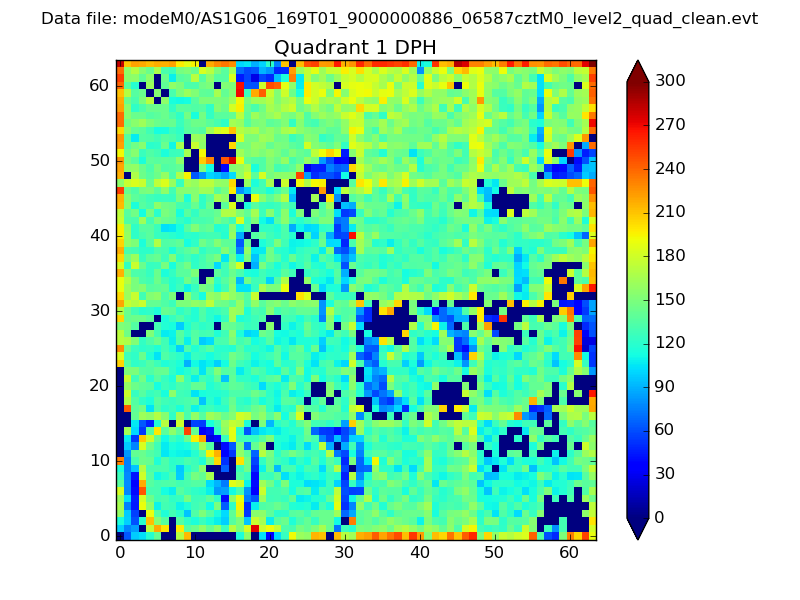 |
Quadrant B |
|---|---|---|---|
| Quadrant D | 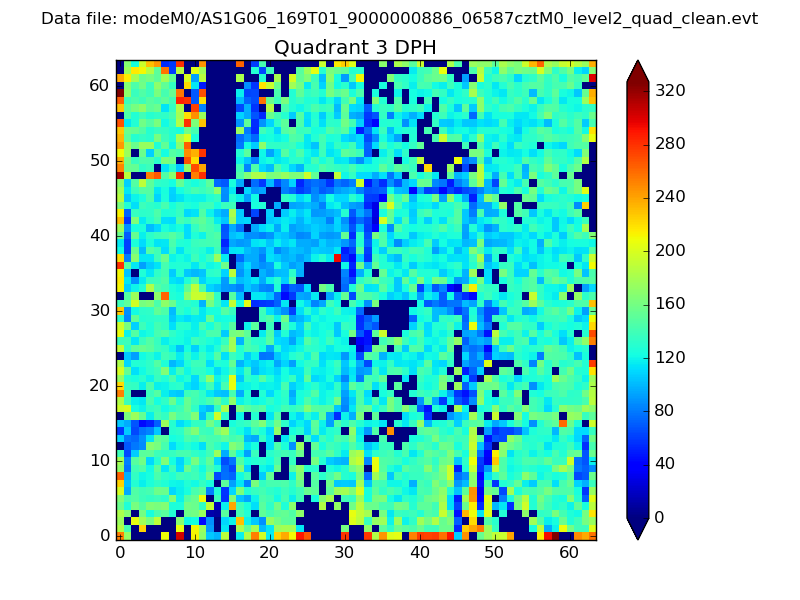 |
 |
Quadrant C |
| Plot type | Count rate plots | Images |
|---|---|---|
| Comparison with Poisson distribution Blue bars denote a histogram of data divided into 1 sec bins. Red curve is a Poisson curve with rate = median count rate of data. |
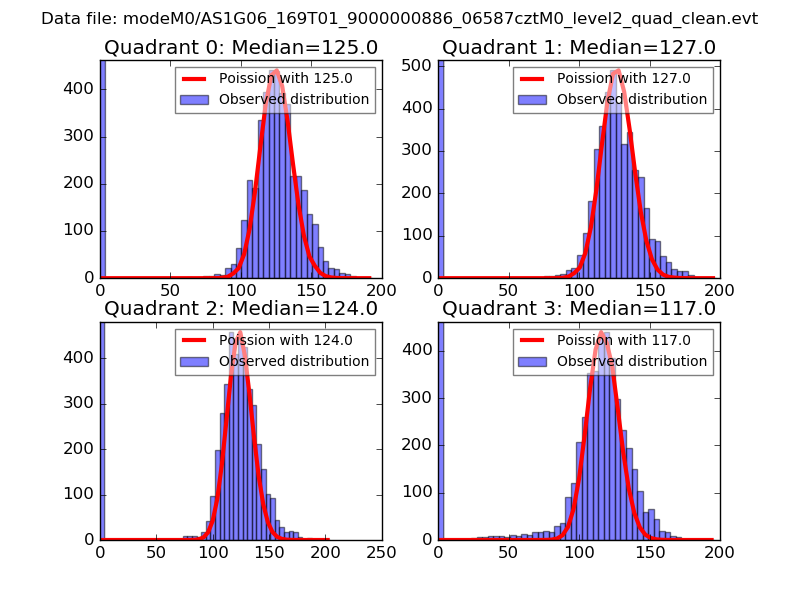 |
 |
| Quadrant-wise count rates Data is divided into 100 sec bins |
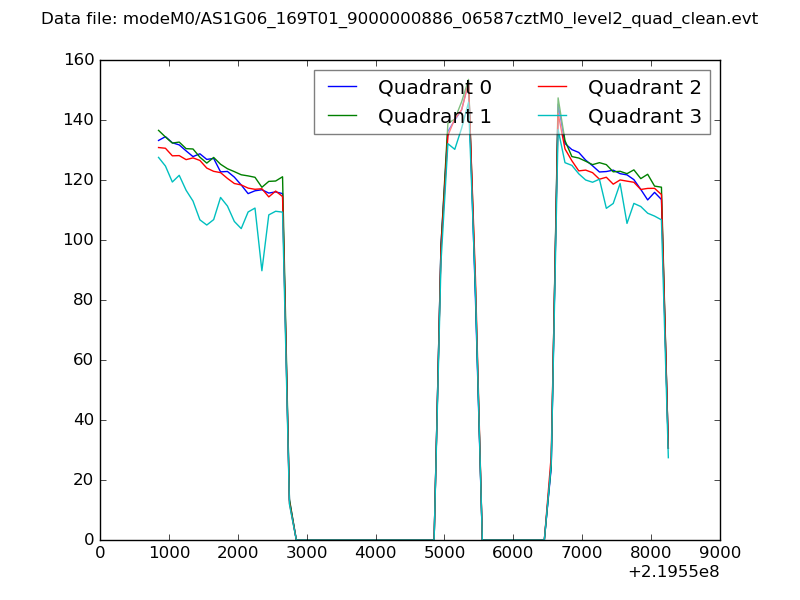 |
|
| Module-wise count rates for Quadrant A Data is divided into 100 sec bins |
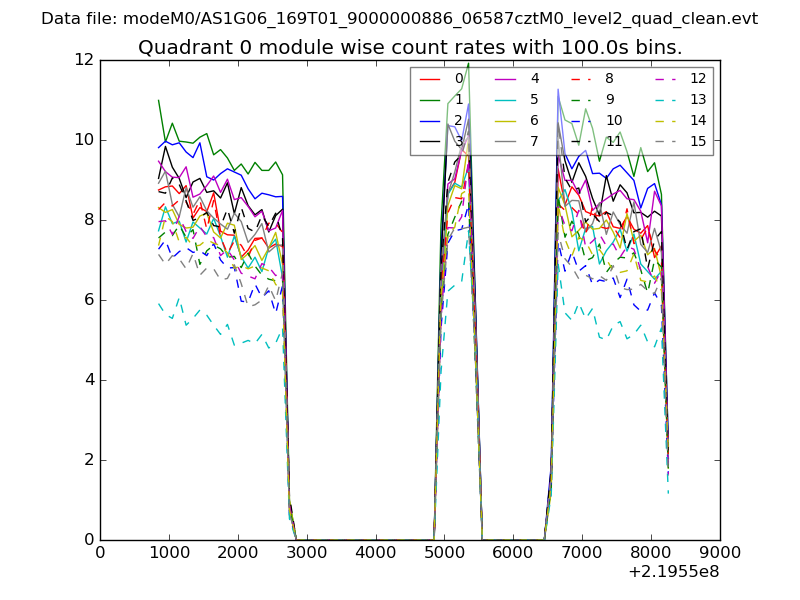 |
 |
| Module-wise count rates for Quadrant B Data is divided into 100 sec bins |
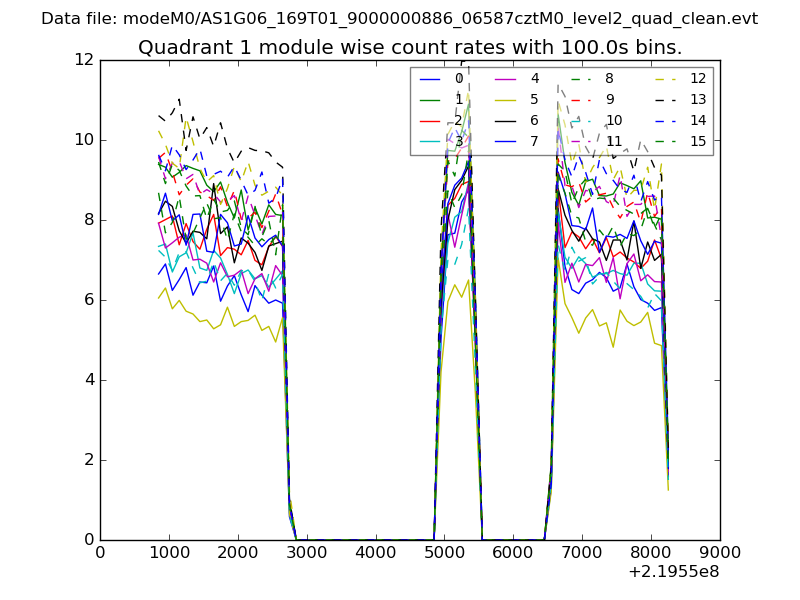 |
 |
| Module-wise count rates for Quadrant C Data is divided into 100 sec bins |
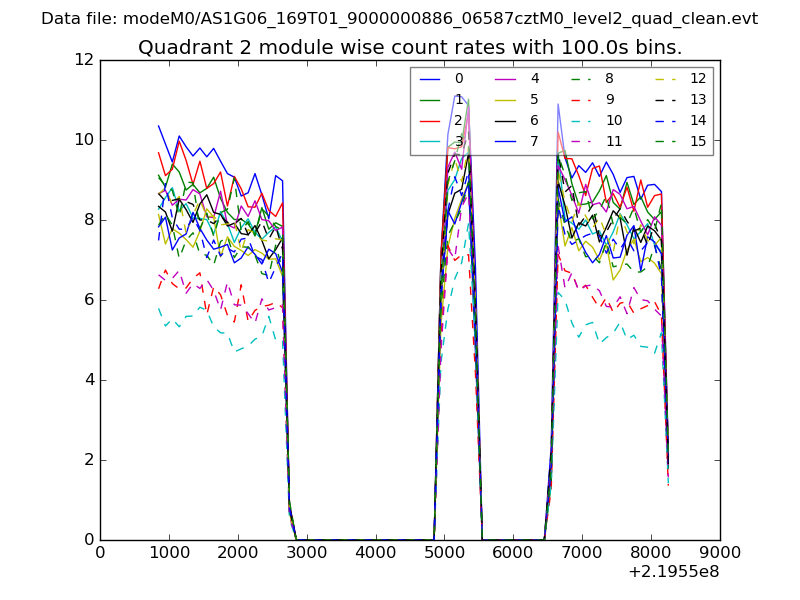 |
 |
| Module-wise count rates for Quadrant D Data is divided into 100 sec bins |
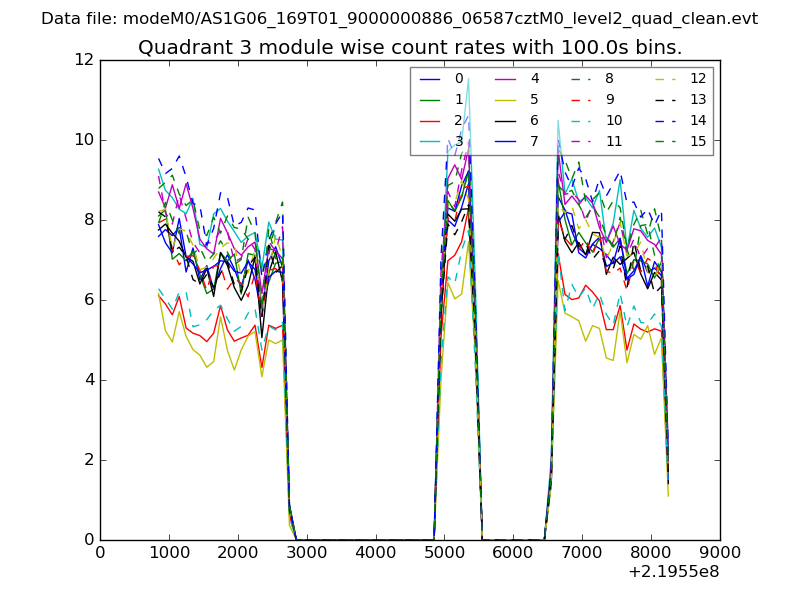 |
 |
| Parameter | Plot |
|---|---|
| CZT HV Monitor | 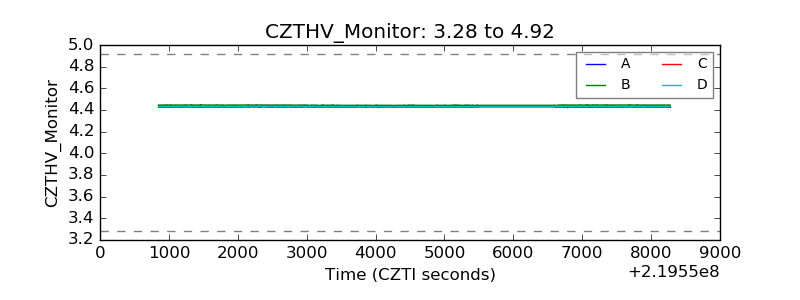 |
| D_VDD | 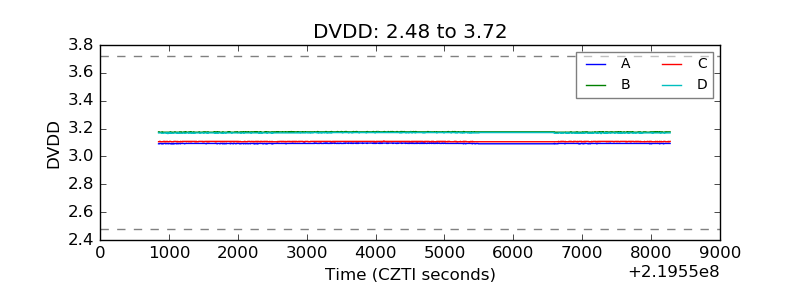 |
| Temperature 1 | 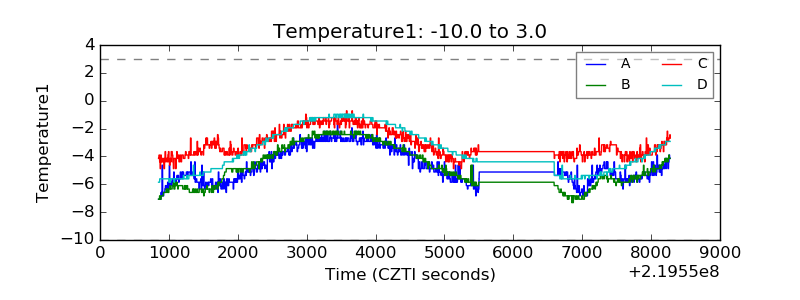 |
| Veto HV Monitor | 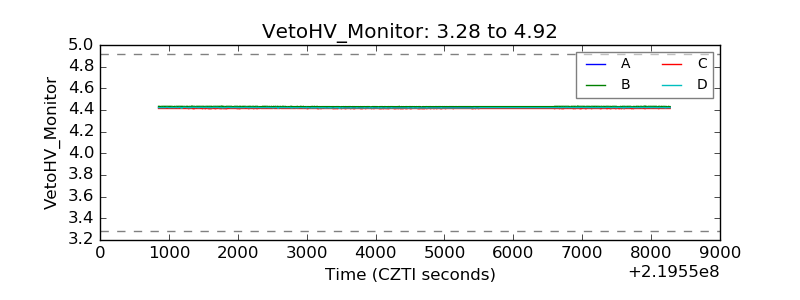 |
| Veto LLD | 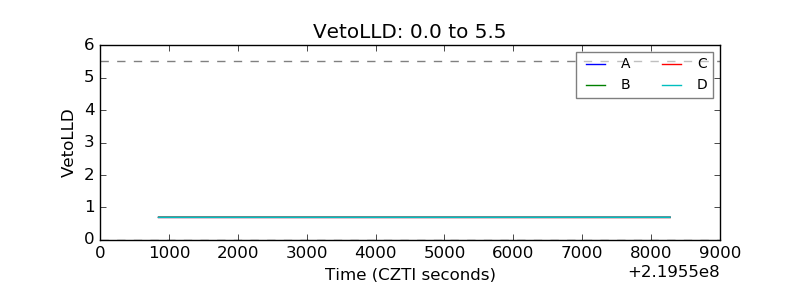 |
| Alpha Counter | 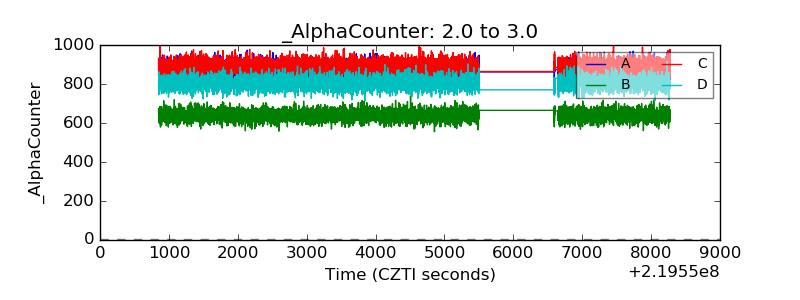 |
| _CPM_Rate | 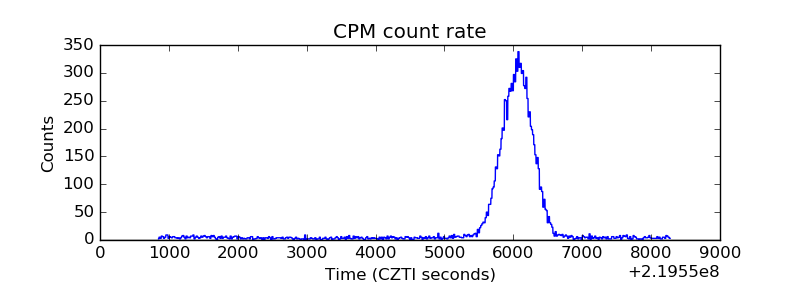 |
| CZT Counter | 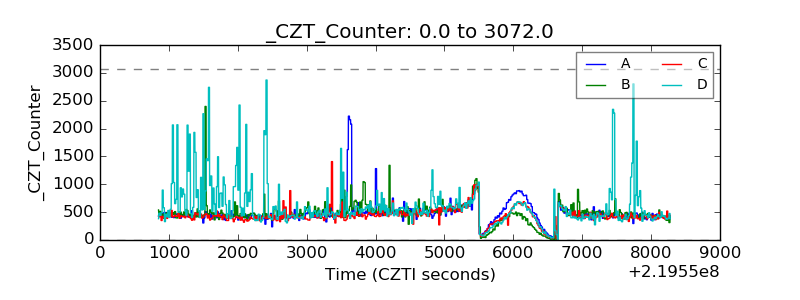 |
| +2.5 Volts monitor | 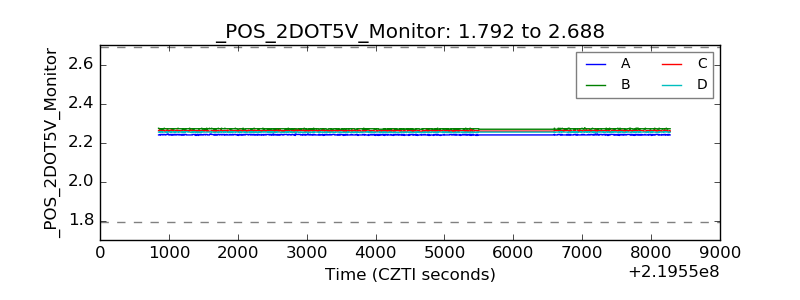 |
| +5 Volts monitor |  |
| _ROLL_ROT | 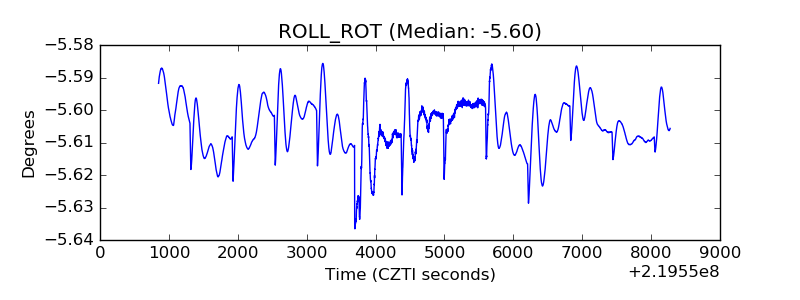 |
| _Roll_DEC | 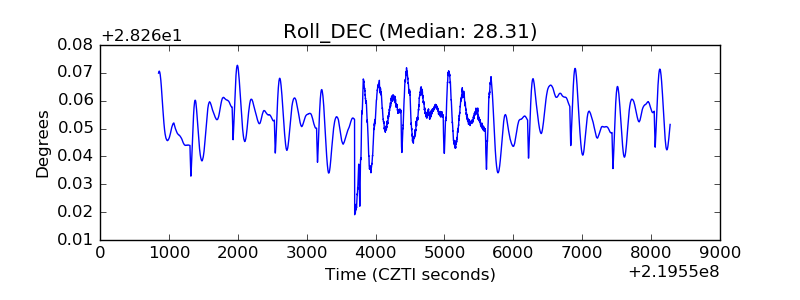 |
| _Roll_RA | 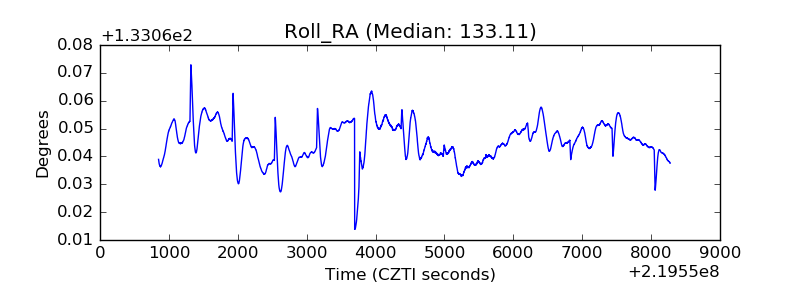 |
| Veto Counter | 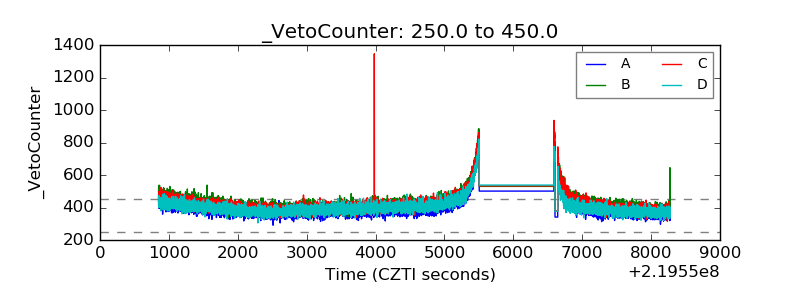 |