| Param | Original file | Final file |
|---|---|---|
| Filename | modeM0/AS1G06_169T01_9000000886_06588cztM0_level2.evt | modeM0/AS1G06_169T01_9000000886_06588cztM0_level2_quad_clean.evt |
| Size (bytes) | 460,261,440 | 74,764,800 |
| Size | 438.9 MB | 71.3 MB |
| Events in quadrant A | 2,807,742 | 471,722 |
| Events in quadrant B | 3,291,070 | 477,031 |
| Events in quadrant C | 2,752,470 | 469,400 |
| Events in quadrant D | 4,674,165 | 420,691 |
| Mode M9 | |||
|---|---|---|---|
| Quadrant | BADHDUFLAG | Total packets | Discarded packets |
| A | 0 | 8 | 0 |
| B | 0 | 8 | 0 |
| C | 0 | 8 | 0 |
| D | 0 | 8 | 0 |
| Mode M0 | |||
|---|---|---|---|
| Quadrant | BADHDUFLAG | Total packets | Discarded packets |
| A | 0 | 12459 | 2 |
| B | 0 | 13777 | 1 |
| C | 0 | 12515 | 1 |
| D | 0 | 18037 | 1 |
| Mode SS | |||
|---|---|---|---|
| Quadrant | BADHDUFLAG | Total packets | Discarded packets |
| A | 0 | 124 | 0 |
| B | 0 | 124 | 0 |
| C | 0 | 124 | 0 |
| D | 0 | 124 | 0 |
| Quadrant | Total seconds | Saturated seconds | Saturation percentage |
|---|---|---|---|
| A | 6082 | 98 | 1.611312% |
| B | 6082 | 157 | 2.581388% |
| C | 6082 | 62 | 1.019402% |
| D | 6082 | 627 | 10.309109% |
Noise dominated data is calculated using 1-second bins in cleaned event files. If a bin has >2000 counts, and if more than 50% of those come from <1% of pixels, then it is considered to be noise-dominated and hence unusable.
| Quadrant | # 1 sec bins | Bins with >0 counts | Bins with >2000 counts | High rate bins dominated by noise | Noise dominated (total time) | Noise dominated (detector-on time) | Marked lightcurve |
|---|---|---|---|---|---|---|---|
| A | 6877 | 6084 | 0 | 0 | 0.00% | 0.00% | 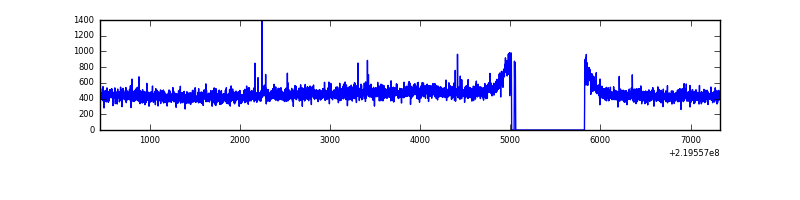 |
| B | 6877 | 6084 | 35 | 35 | 0.51% | 0.58% | 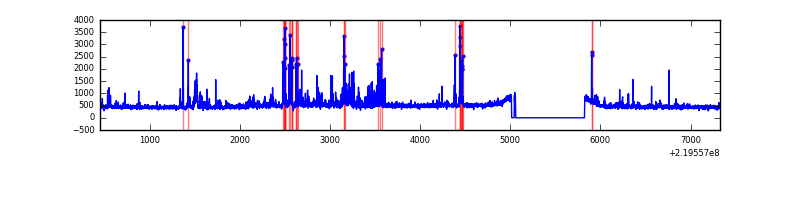 |
| C | 6877 | 6084 | 2 | 2 | 0.03% | 0.03% | 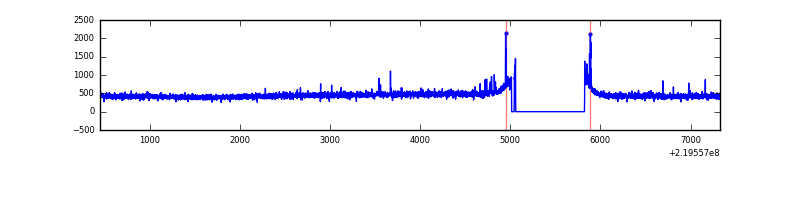 |
| D | 6876 | 6083 | 534 | 534 | 7.77% | 8.78% | 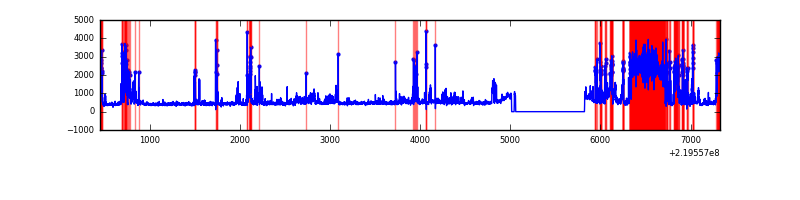 |
Top three noisy pixels from each quadrant. If the there are fewer than three noisy pixels in the level2.evt file, extra rows are filled as -1
| Pixel properties | Quadrant properties | ||||||
|---|---|---|---|---|---|---|---|
| Quadrant | DetID | PixID | Counts | Sigma | Mean | Median | Sigma |
| A | 8 | 15 | 12571 | 80.42 | 719 | 703 | 147.6 |
| A | 3 | 1 | 8533 | 53.06 | 719 | 703 | 147.6 |
| A | 14 | 111 | 7172 | 43.84 | 719 | 703 | 147.6 |
| B | 0 | 219 | 95499 | 686.19 | 717 | 698 | 138.2 |
| B | 4 | 80 | 92392 | 663.7 | 717 | 698 | 138.2 |
| B | 4 | 48 | 90116 | 647.23 | 717 | 698 | 138.2 |
| C | 9 | 16 | 46213 | 282.04 | 690 | 691 | 161.4 |
| C | 1 | 16 | 9054 | 51.81 | 690 | 691 | 161.4 |
| C | 9 | 54 | 6168 | 33.93 | 690 | 691 | 161.4 |
| D | 2 | 33 | 1759430 | 10454.14 | 674 | 652 | 168.2 |
| D | 2 | 152 | 107948 | 637.77 | 674 | 652 | 168.2 |
| D | 2 | 136 | 84967 | 501.17 | 674 | 652 | 168.2 |
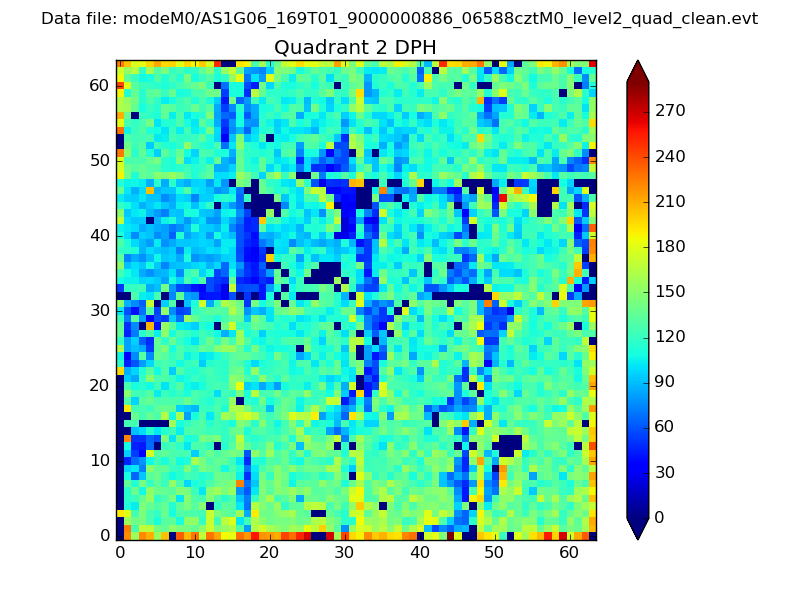
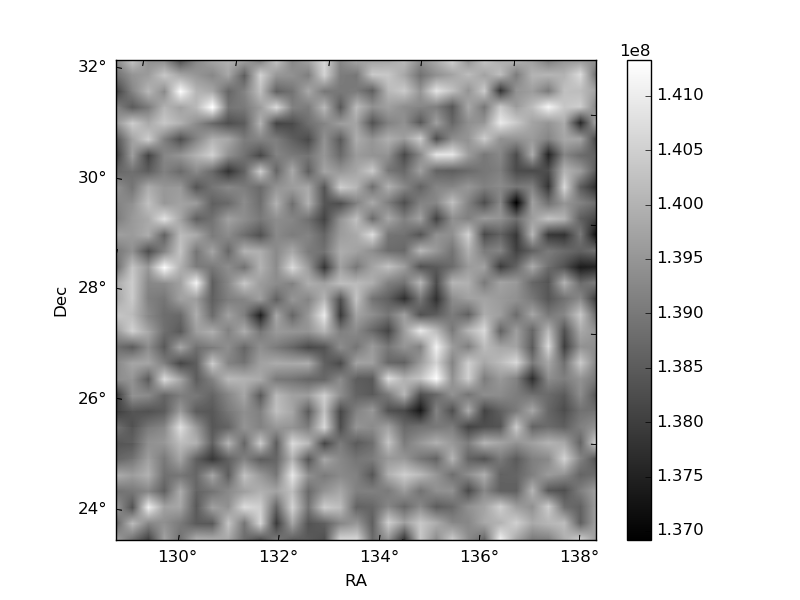
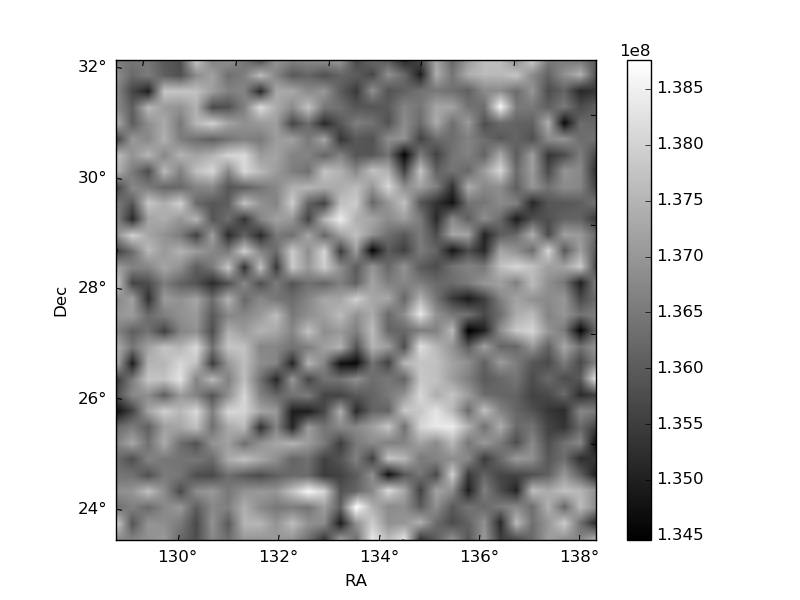
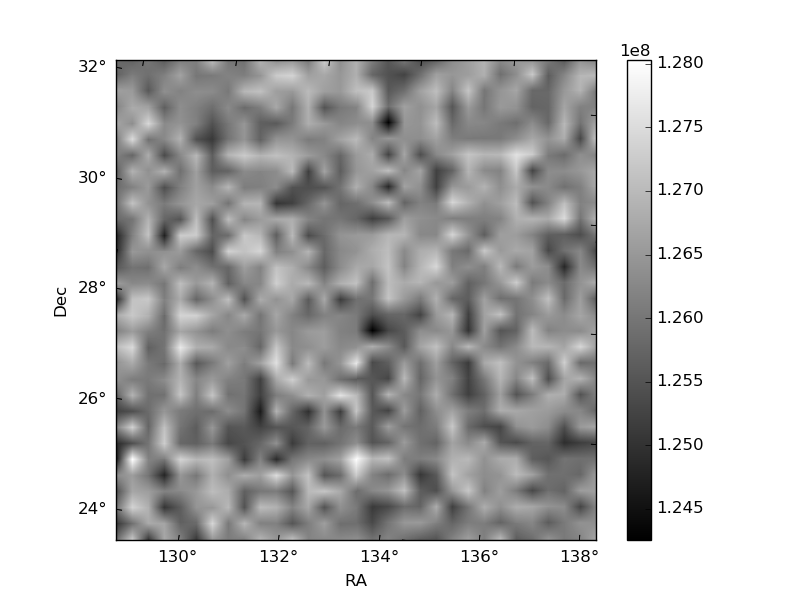
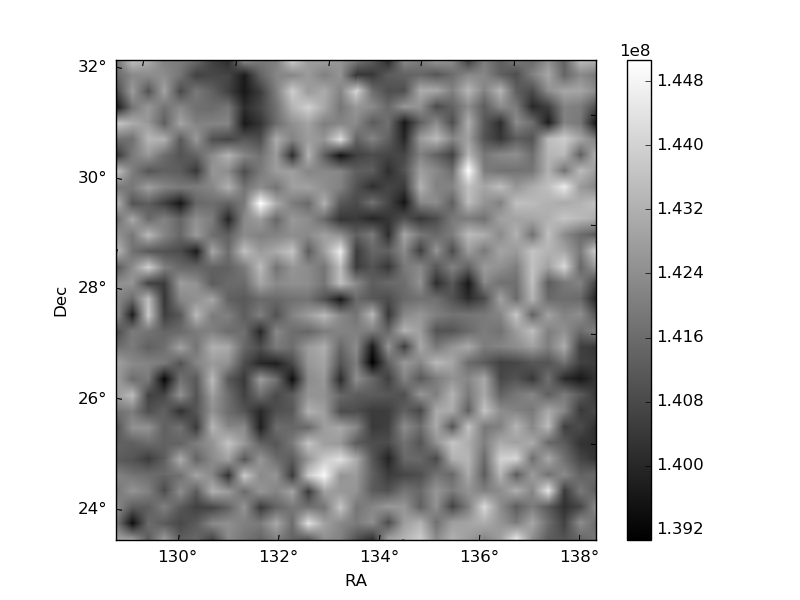
Histogram calculated using DETX and DETY for each event in the final _common_clean file
| Quadrant A | 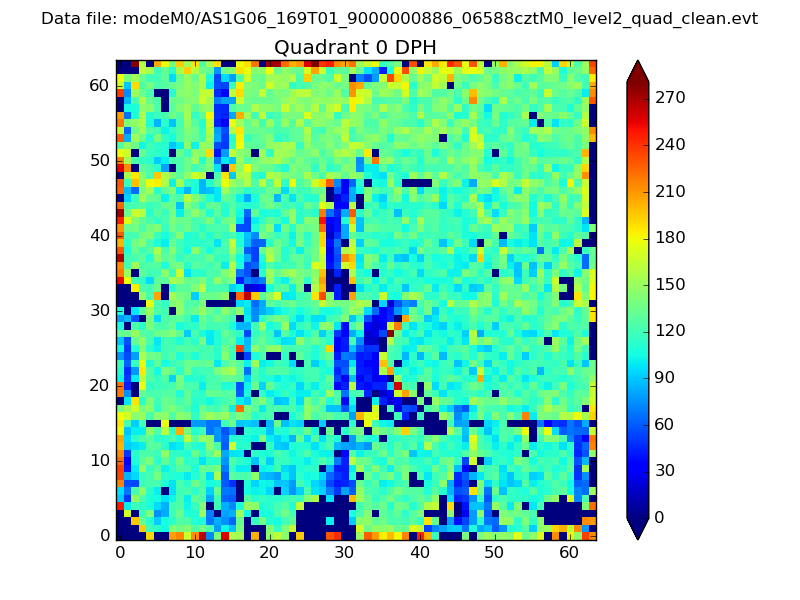 |
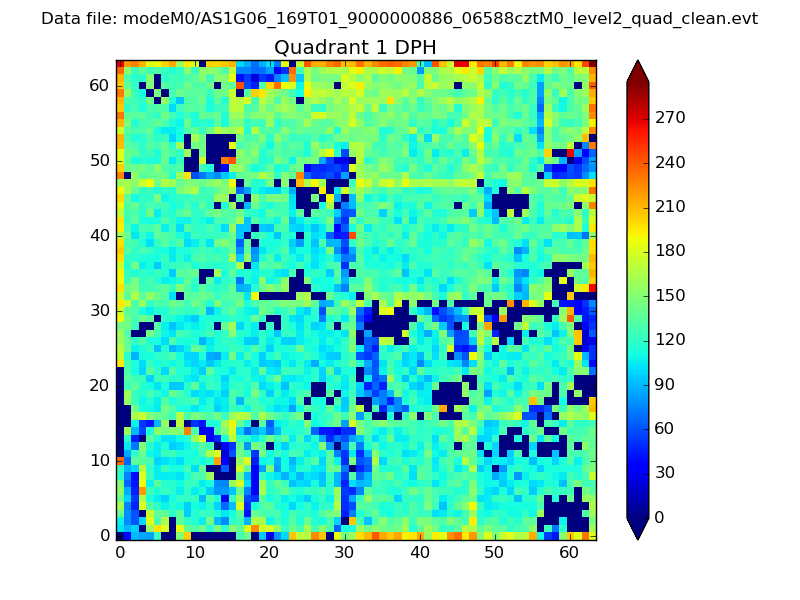 |
Quadrant B |
|---|---|---|---|
| Quadrant D | 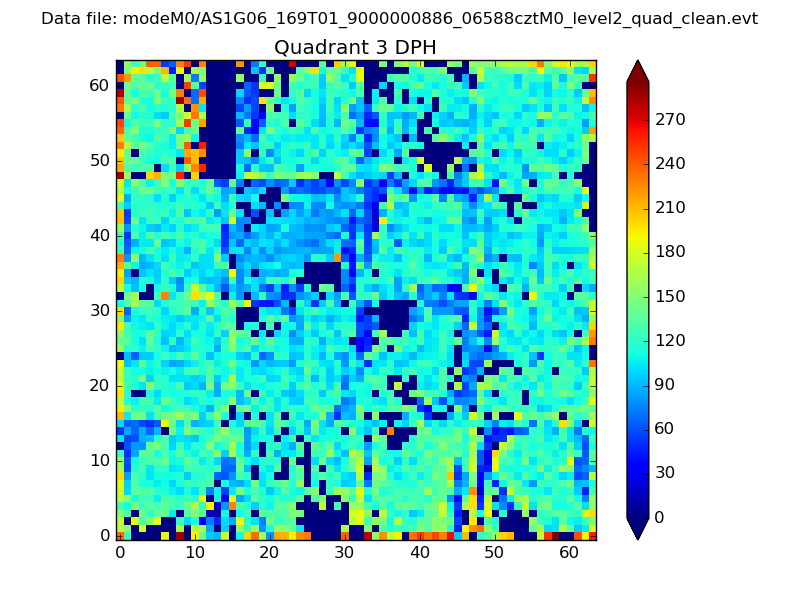 |
 |
Quadrant C |
| Plot type | Count rate plots | Images |
|---|---|---|
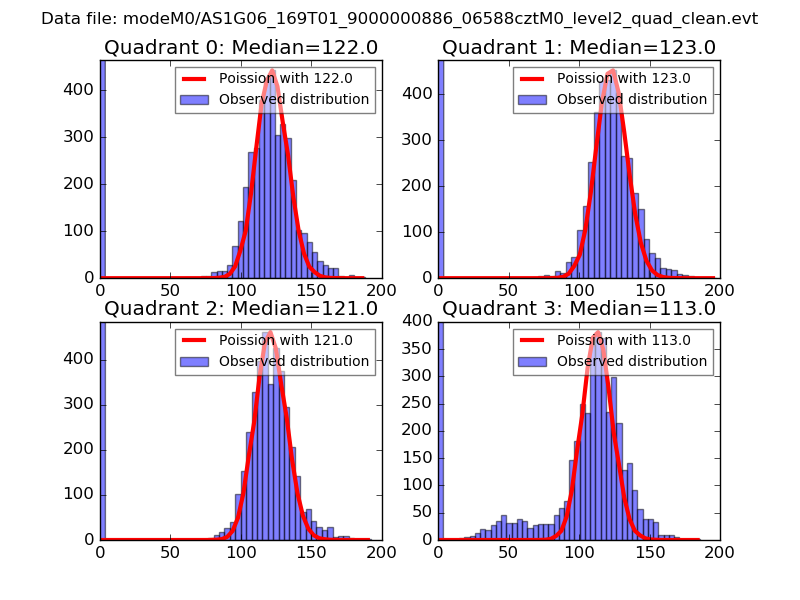
| Comparison with Poisson distribution Blue bars denote a histogram of data divided into 1 sec bins. Red curve is a Poisson curve with rate = median count rate of data. |
 |
 |
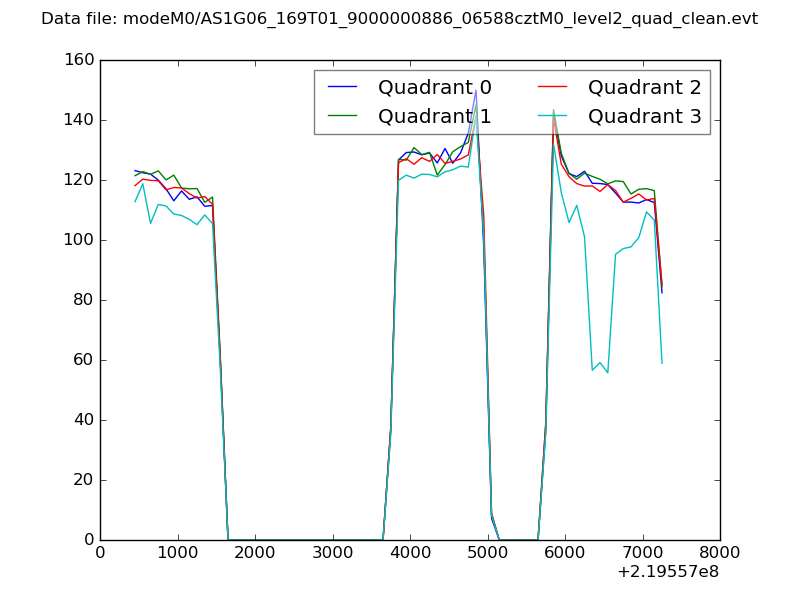
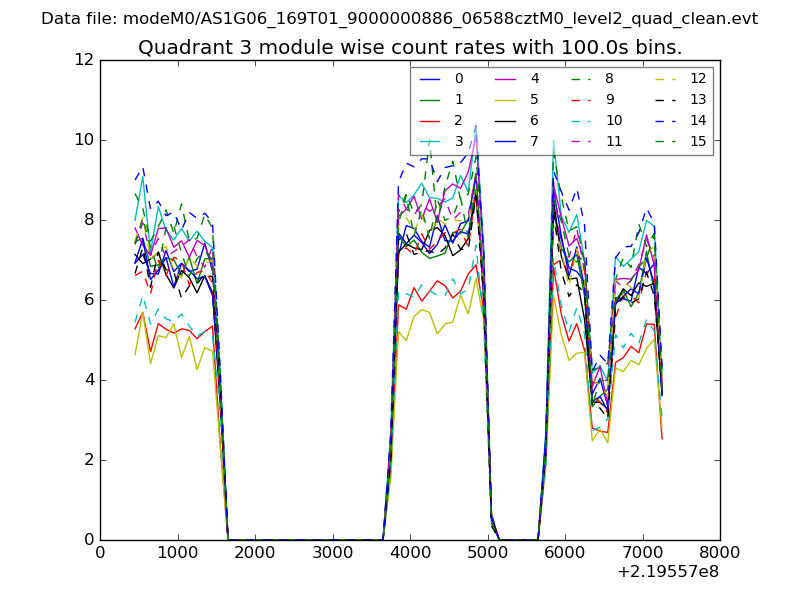
| Quadrant-wise count rates Data is divided into 100 sec bins |
 |
|
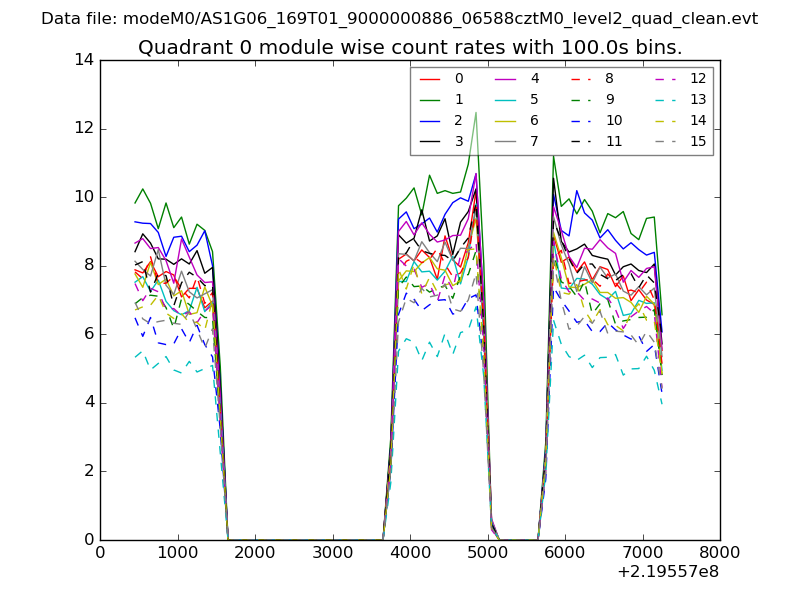
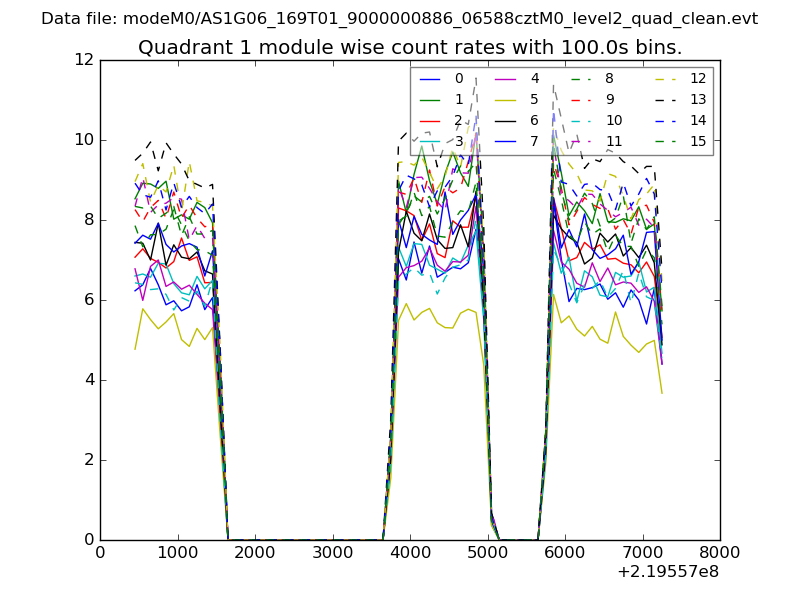
| Module-wise count rates for Quadrant A Data is divided into 100 sec bins |
 |
 |
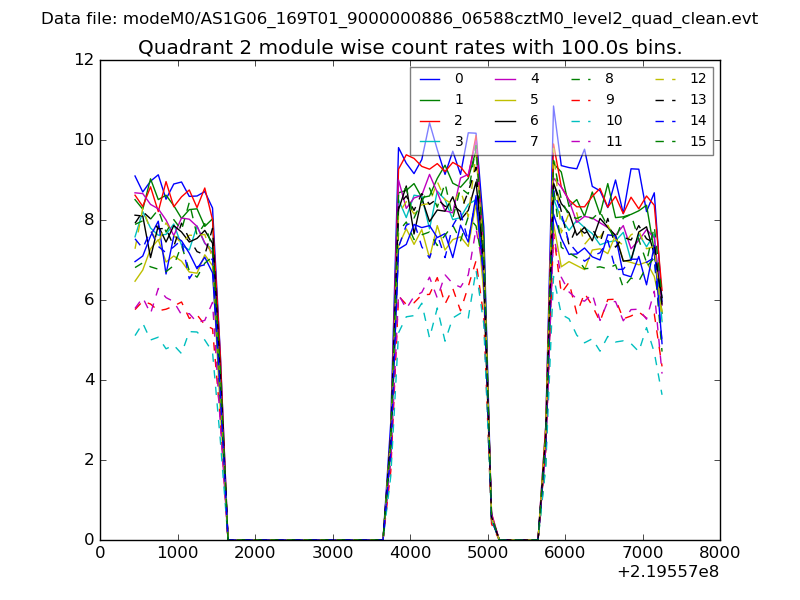
| Module-wise count rates for Quadrant B Data is divided into 100 sec bins |
 |
 |
| Module-wise count rates for Quadrant C Data is divided into 100 sec bins |
 |
 |
| Module-wise count rates for Quadrant D Data is divided into 100 sec bins |
 |
 |
| Parameter | Plot |
|---|---|
| CZT HV Monitor | 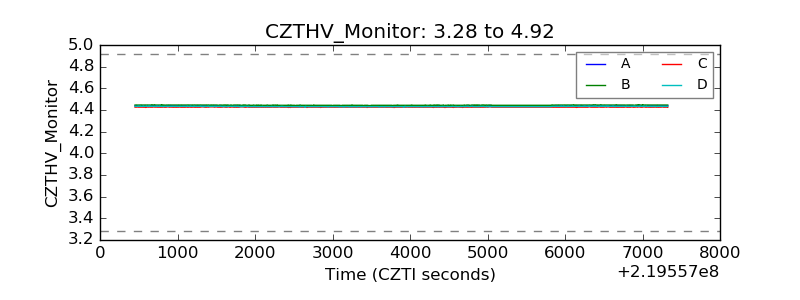 |
| D_VDD | 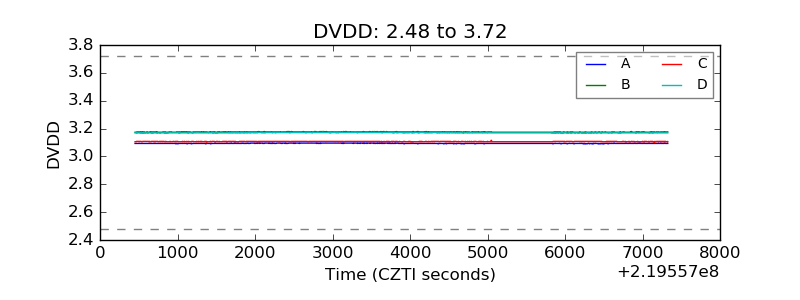 |
| Temperature 1 | 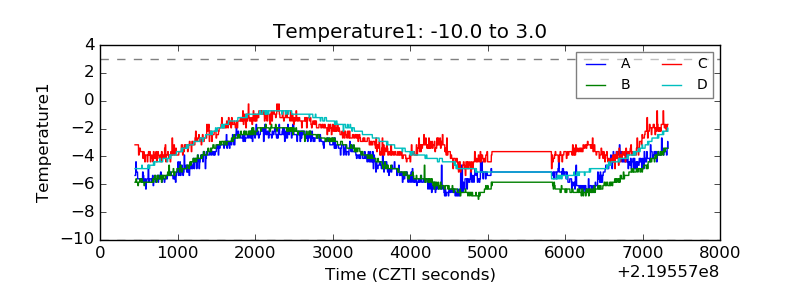 |
| Veto HV Monitor | 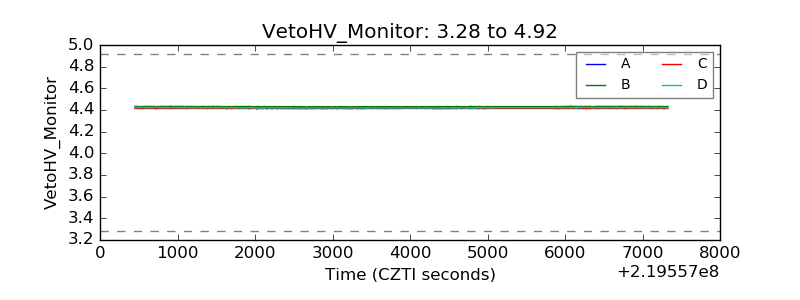 |
| Veto LLD | 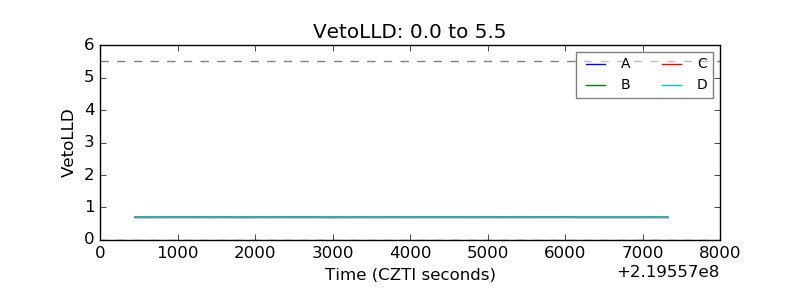 |
| Alpha Counter | 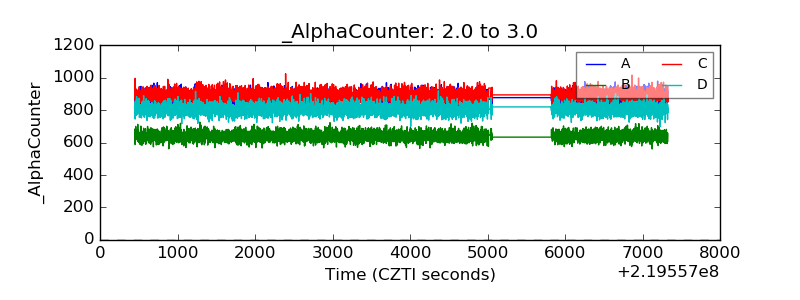 |
| _CPM_Rate | 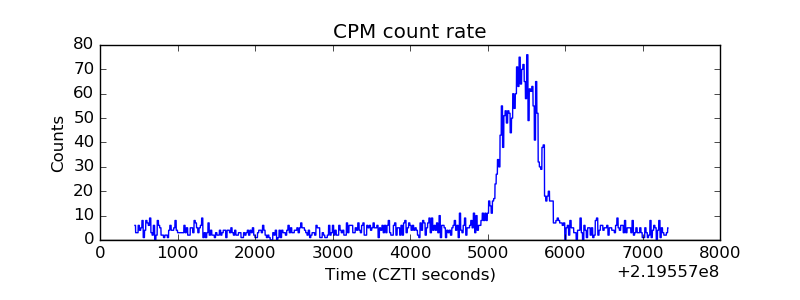 |
| CZT Counter | 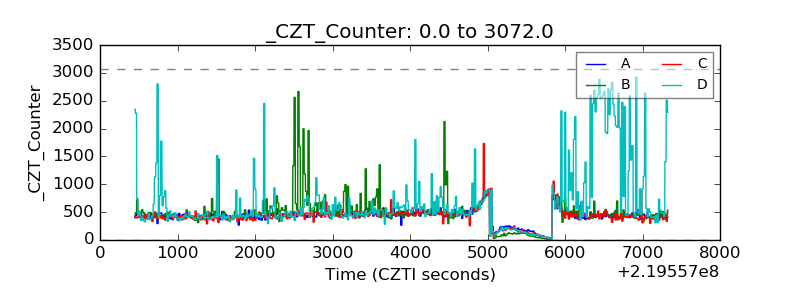 |
| +2.5 Volts monitor | 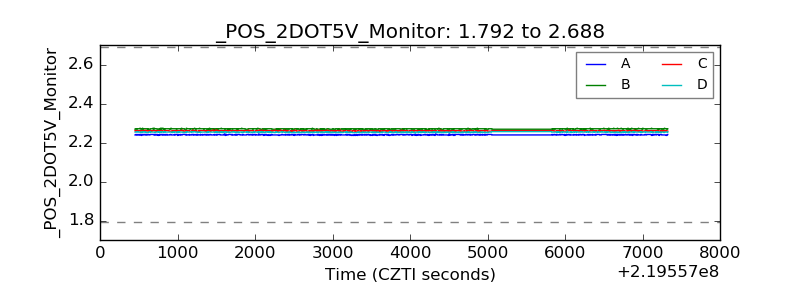 |
| +5 Volts monitor | 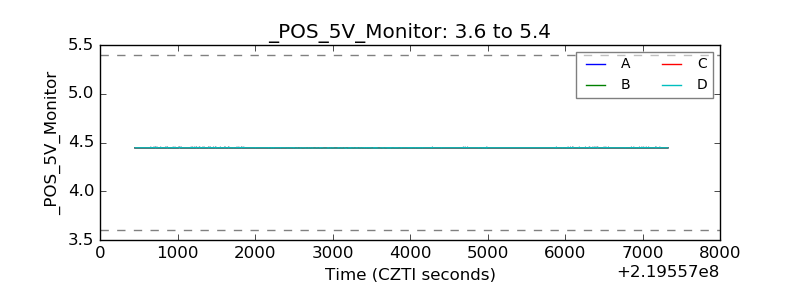 |
| _ROLL_ROT | 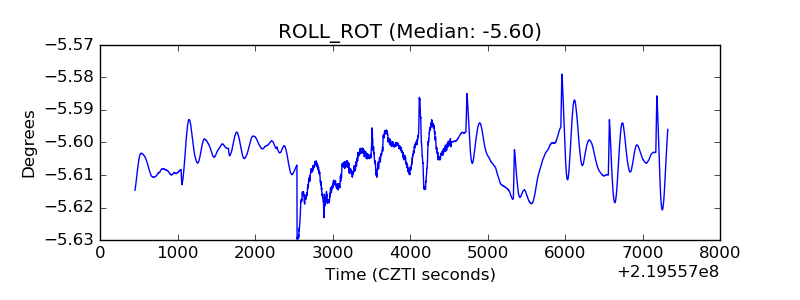 |
| _Roll_DEC | 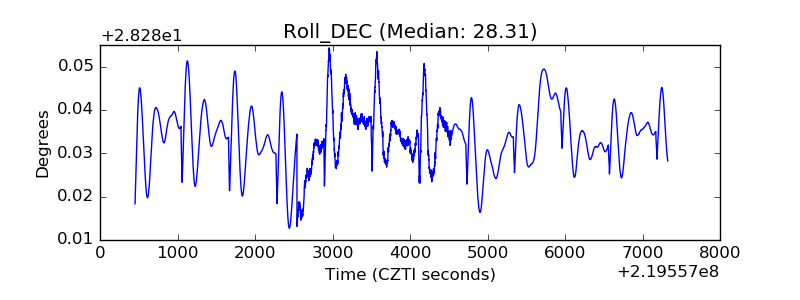 |
| _Roll_RA | 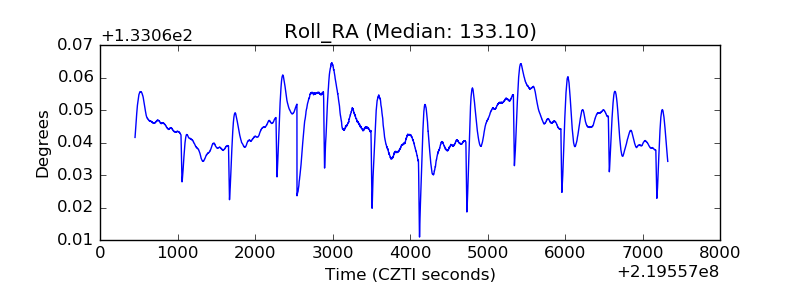 |
| Veto Counter | 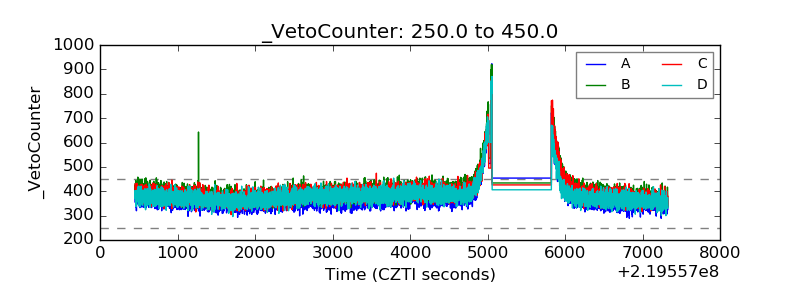 |