| Param | Original file | Final file |
|---|---|---|
| Filename | modeM0/AS1G06_169T01_9000000886_06589cztM0_level2.evt | modeM0/AS1G06_169T01_9000000886_06589cztM0_level2_quad_clean.evt |
| Size (bytes) | 559,877,760 | 94,429,440 |
| Size | 533.9 MB | 90.1 MB |
| Events in quadrant A | 3,475,446 | 599,575 |
| Events in quadrant B | 3,862,475 | 604,816 |
| Events in quadrant C | 3,371,555 | 595,422 |
| Events in quadrant D | 5,742,207 | 542,419 |
| Mode M9 | |||
|---|---|---|---|
| Quadrant | BADHDUFLAG | Total packets | Discarded packets |
| A | 0 | 6 | 0 |
| B | 0 | 6 | 0 |
| C | 0 | 6 | 0 |
| D | 0 | 7 | 0 |
| Mode M0 | |||
|---|---|---|---|
| Quadrant | BADHDUFLAG | Total packets | Discarded packets |
| A | 0 | 15418 | 3 |
| B | 0 | 16352 | 2 |
| C | 0 | 15352 | 2 |
| D | 0 | 22063 | 2 |
| Mode SS | |||
|---|---|---|---|
| Quadrant | BADHDUFLAG | Total packets | Discarded packets |
| A | 0 | 150 | 0 |
| B | 0 | 150 | 0 |
| C | 0 | 150 | 0 |
| D | 0 | 150 | 0 |
| Quadrant | Total seconds | Saturated seconds | Saturation percentage |
|---|---|---|---|
| A | 7427 | 243 | 3.271846% |
| B | 7427 | 270 | 3.635384% |
| C | 7427 | 191 | 2.571698% |
| D | 7427 | 851 | 11.458193% |
Noise dominated data is calculated using 1-second bins in cleaned event files. If a bin has >2000 counts, and if more than 50% of those come from <1% of pixels, then it is considered to be noise-dominated and hence unusable.
| Quadrant | # 1 sec bins | Bins with >0 counts | Bins with >2000 counts | High rate bins dominated by noise | Noise dominated (total time) | Noise dominated (detector-on time) | Marked lightcurve |
|---|---|---|---|---|---|---|---|
| A | 7722 | 7428 | 2 | 2 | 0.03% | 0.03% |  |
| B | 7722 | 7428 | 37 | 37 | 0.48% | 0.50% | 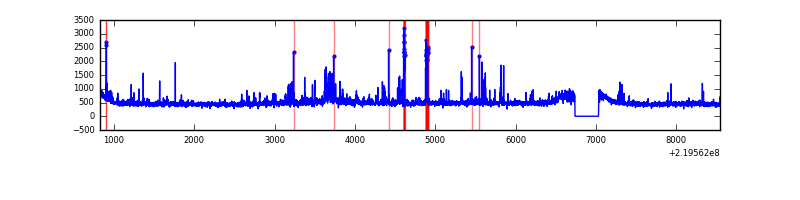 |
| C | 7722 | 7428 | 2 | 2 | 0.03% | 0.03% | 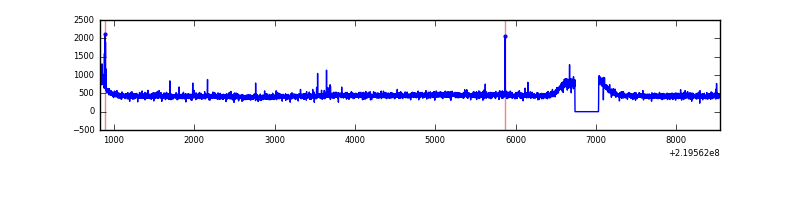 |
| D | 7722 | 7428 | 592 | 592 | 7.67% | 7.97% | 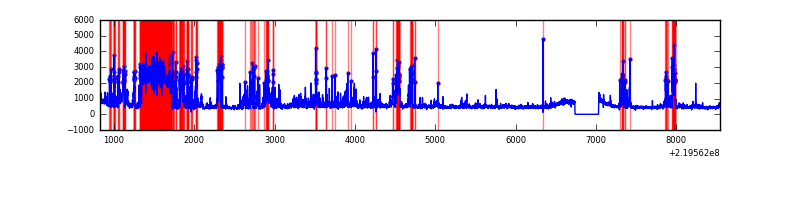 |
Top three noisy pixels from each quadrant. If the there are fewer than three noisy pixels in the level2.evt file, extra rows are filled as -1
| Pixel properties | Quadrant properties | ||||||
|---|---|---|---|---|---|---|---|
| Quadrant | DetID | PixID | Counts | Sigma | Mean | Median | Sigma |
| A | 8 | 15 | 23336 | 124.42 | 881 | 861 | 180.6 |
| A | 14 | 111 | 21809 | 115.97 | 881 | 861 | 180.6 |
| A | 3 | 1 | 18495 | 97.62 | 881 | 861 | 180.6 |
| B | 4 | 81 | 105971 | 619.95 | 880 | 858 | 169.6 |
| B | 0 | 219 | 83271 | 486.06 | 880 | 858 | 169.6 |
| B | 4 | 80 | 78216 | 456.25 | 880 | 858 | 169.6 |
| C | 9 | 16 | 31198 | 153.8 | 851 | 852 | 197.3 |
| C | 13 | 61 | 6671 | 29.49 | 851 | 852 | 197.3 |
| C | 1 | 16 | 6343 | 27.83 | 851 | 852 | 197.3 |
| D | 2 | 33 | 1872510 | 9203.67 | 829 | 802 | 203.4 |
| D | 2 | 63 | 207327 | 1015.54 | 829 | 802 | 203.4 |
| D | 2 | 136 | 200782 | 983.35 | 829 | 802 | 203.4 |
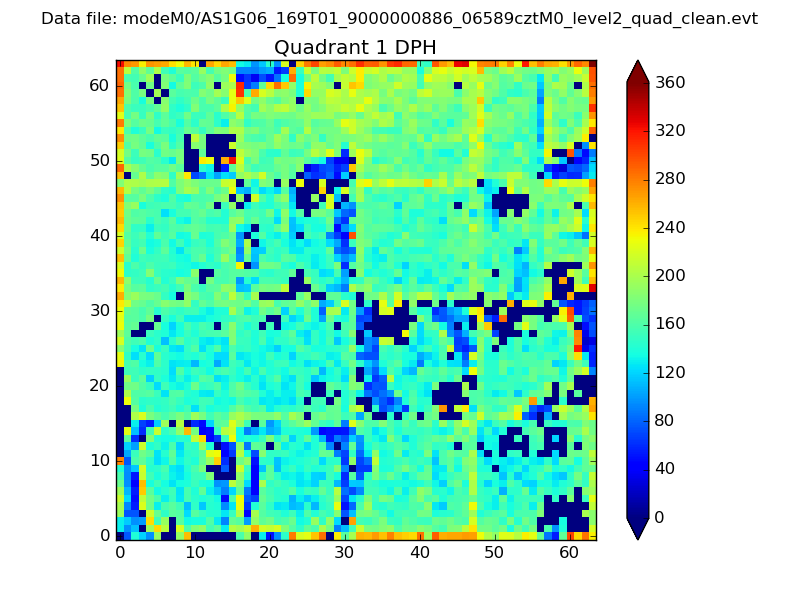
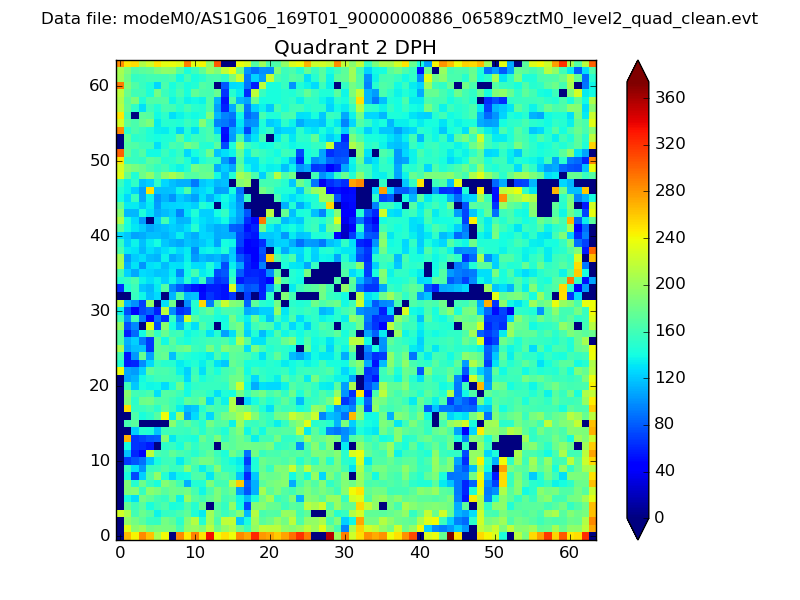
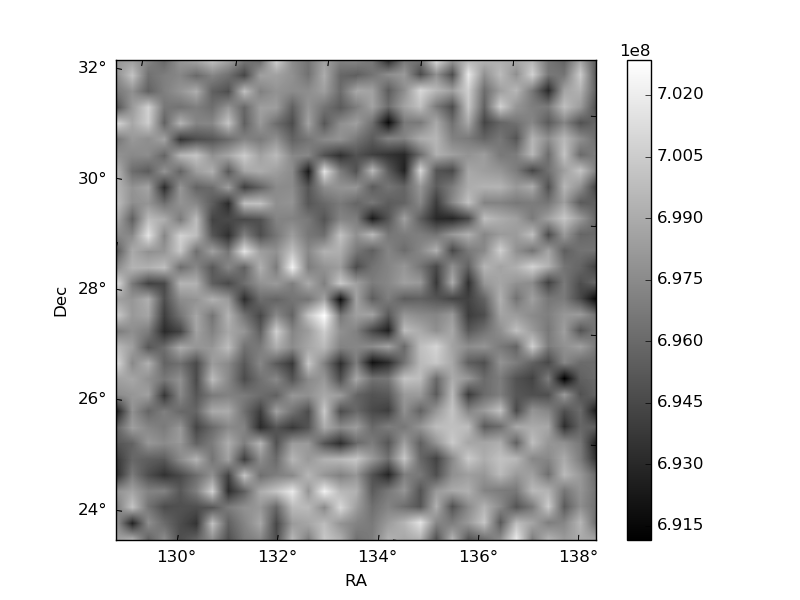
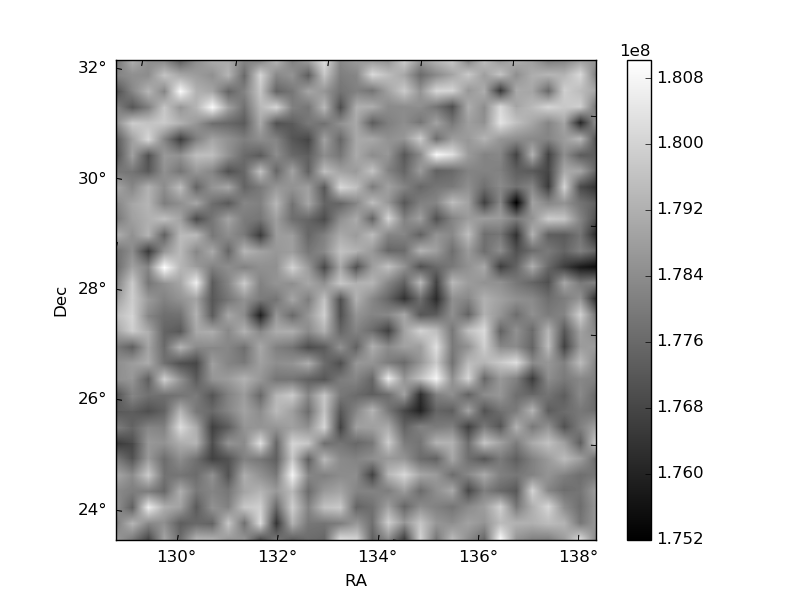
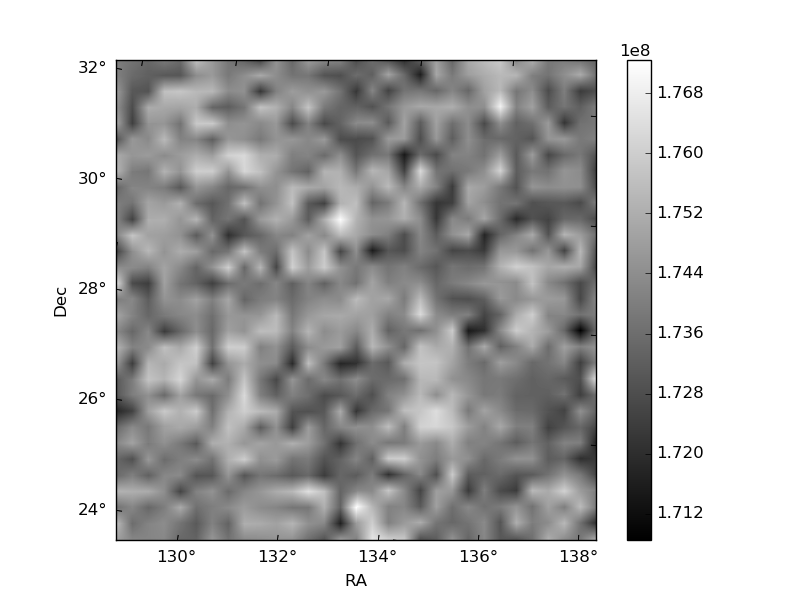
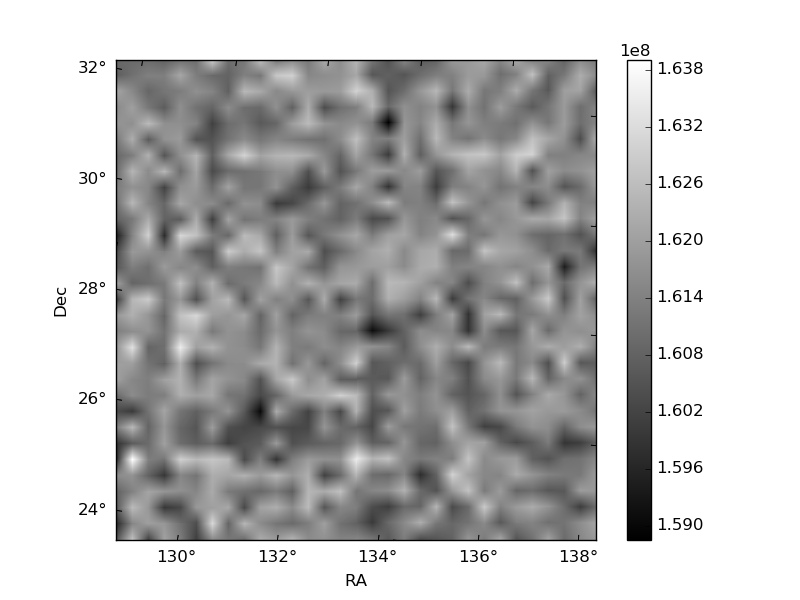
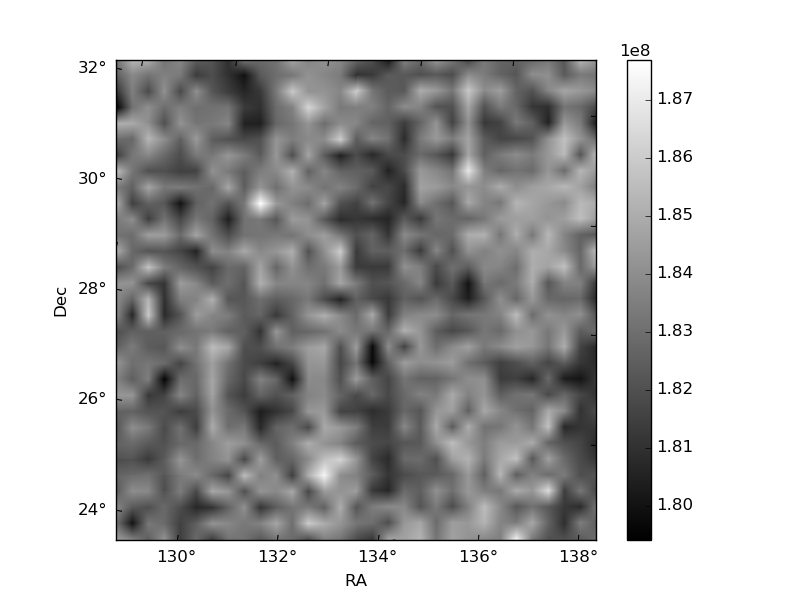
Histogram calculated using DETX and DETY for each event in the final _common_clean file
| Quadrant A | 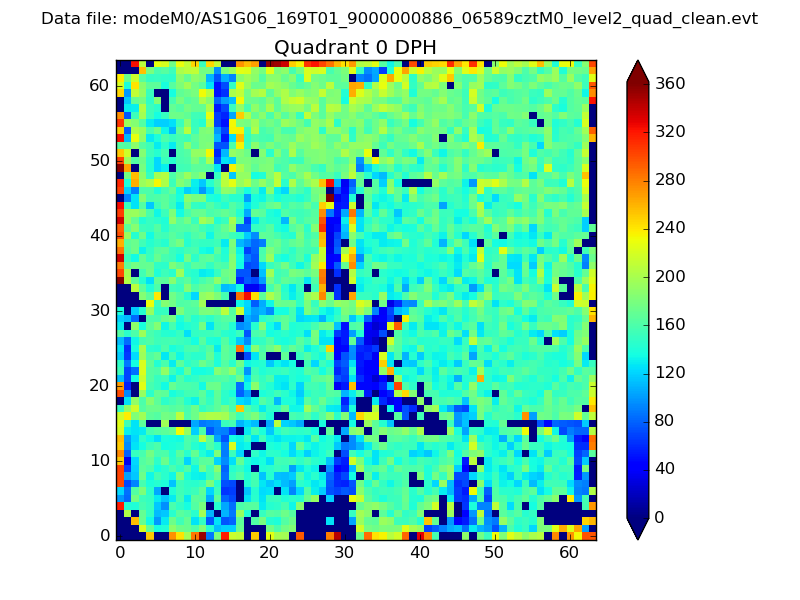 |
 |
Quadrant B |
|---|---|---|---|
| Quadrant D | 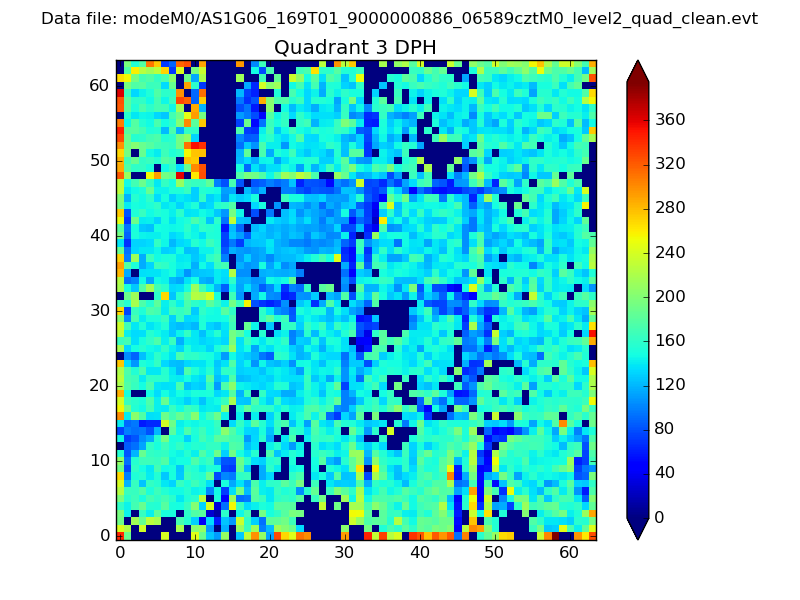 |
 |
Quadrant C |
| Plot type | Count rate plots | Images |
|---|---|---|
| Comparison with Poisson distribution Blue bars denote a histogram of data divided into 1 sec bins. Red curve is a Poisson curve with rate = median count rate of data. |
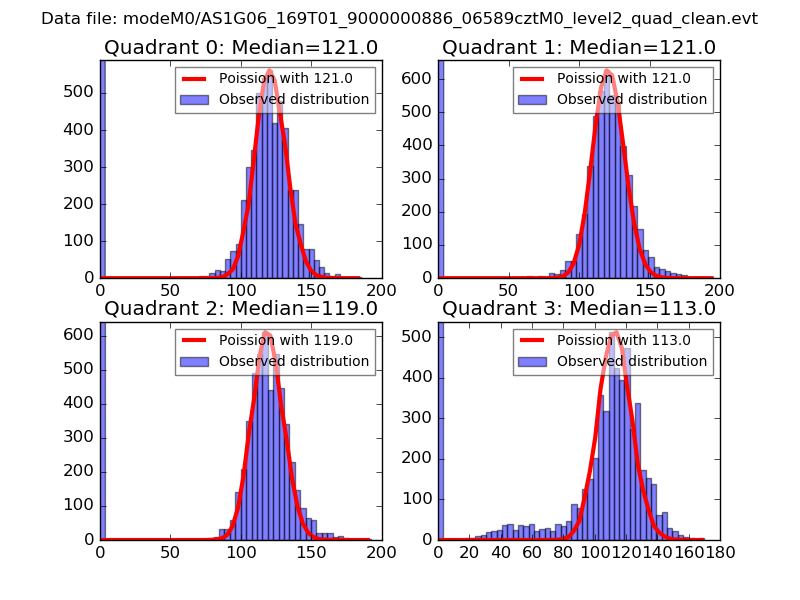 |
 |
| Quadrant-wise count rates Data is divided into 100 sec bins |
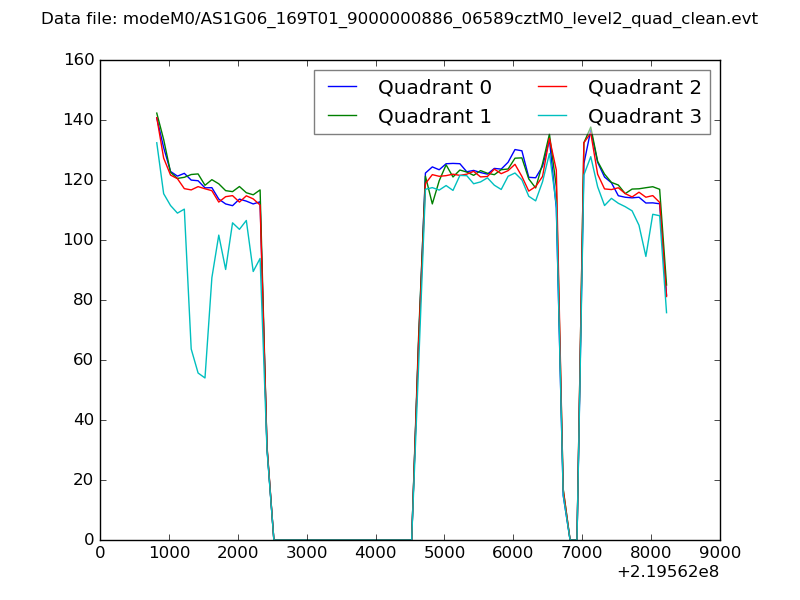 |
|
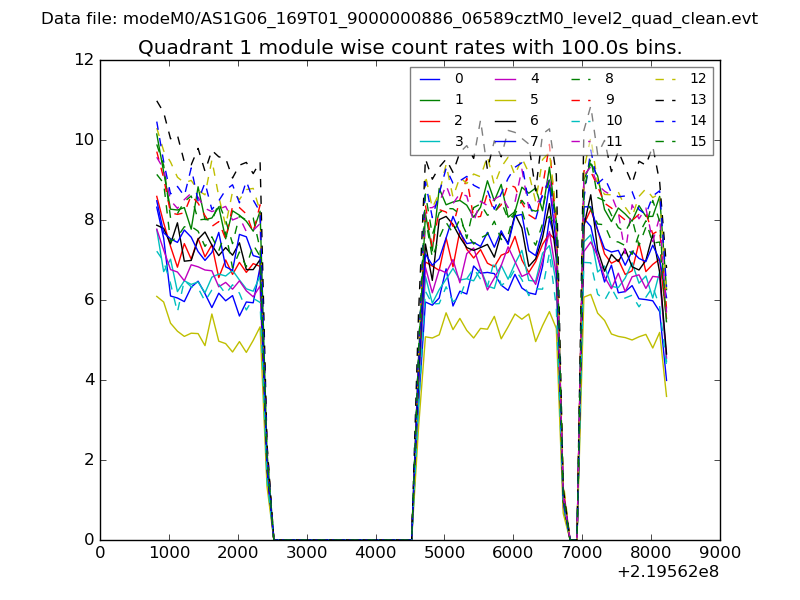
| Module-wise count rates for Quadrant A Data is divided into 100 sec bins |
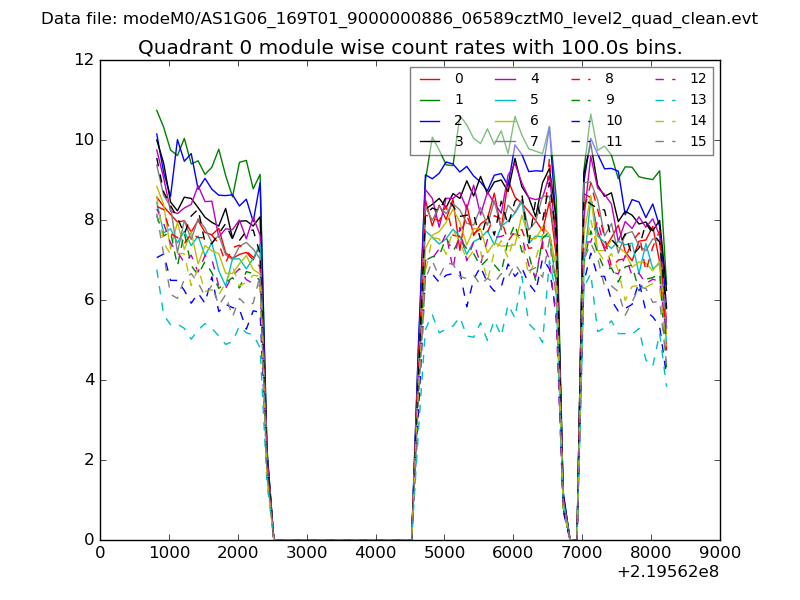 |
 |
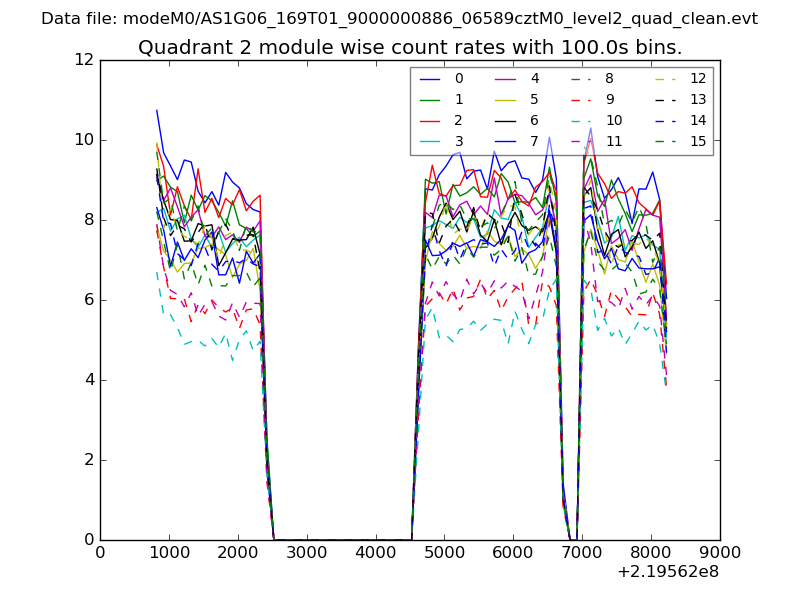
| Module-wise count rates for Quadrant B Data is divided into 100 sec bins |
 |
 |
| Module-wise count rates for Quadrant C Data is divided into 100 sec bins |
 |
 |
| Module-wise count rates for Quadrant D Data is divided into 100 sec bins |
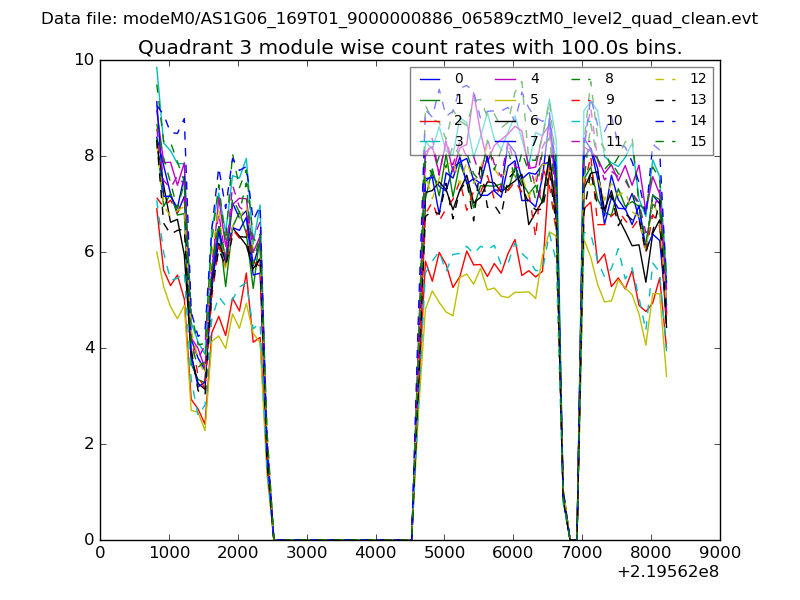 |
 |
| Parameter | Plot |
|---|---|
| CZT HV Monitor | 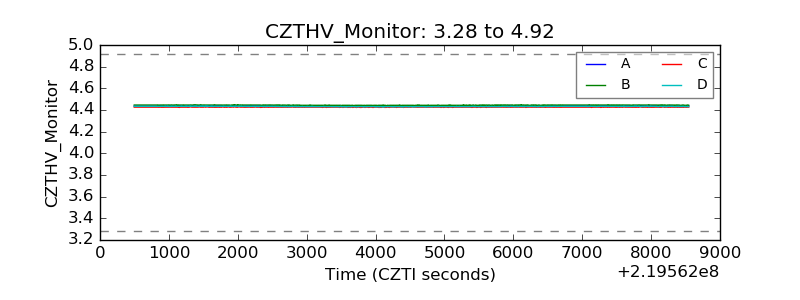 |
| D_VDD | 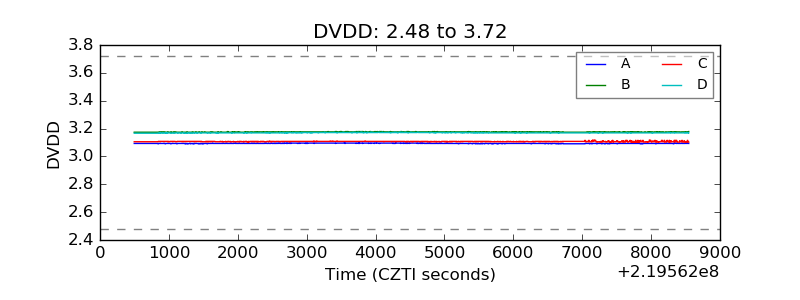 |
| Temperature 1 | 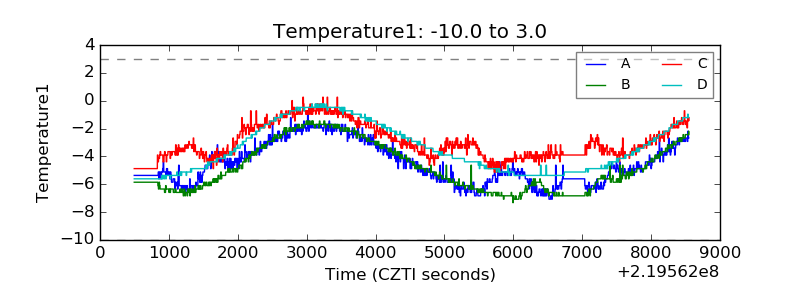 |
| Veto HV Monitor | 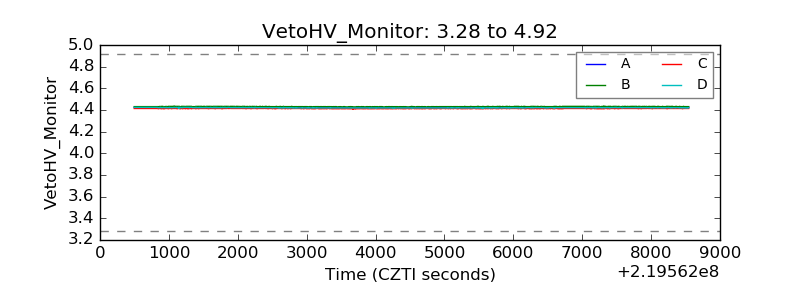 |
| Veto LLD | 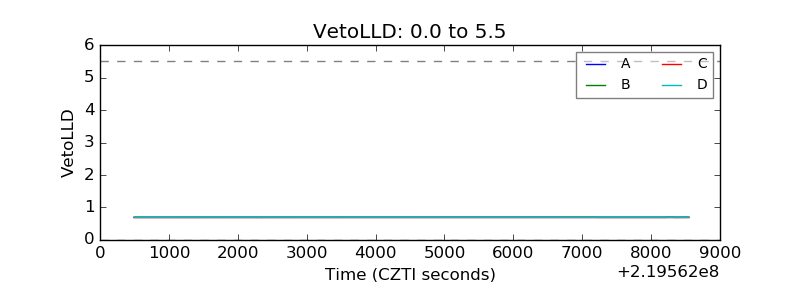 |
| Alpha Counter | 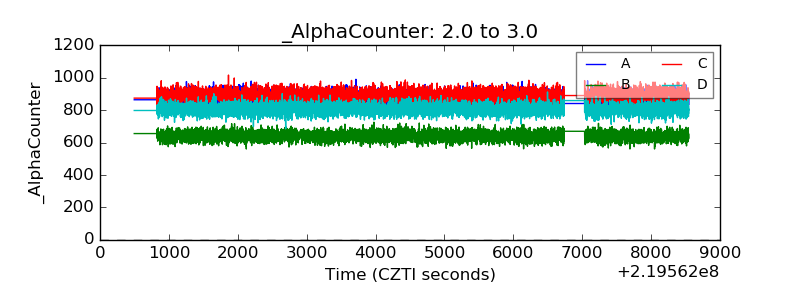 |
| _CPM_Rate | 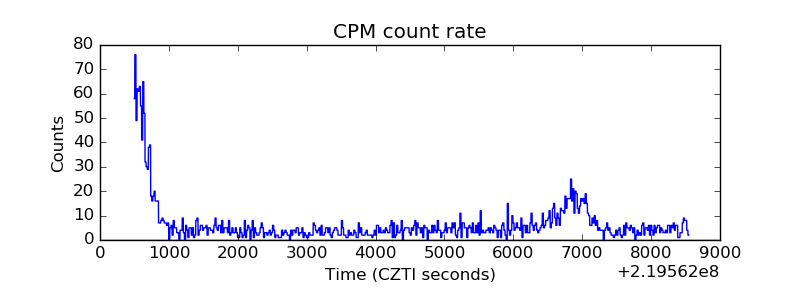 |
| CZT Counter | 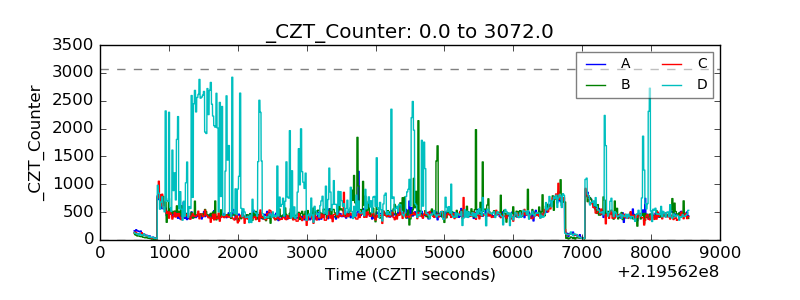 |
| +2.5 Volts monitor |  |
| +5 Volts monitor |  |
| _ROLL_ROT | 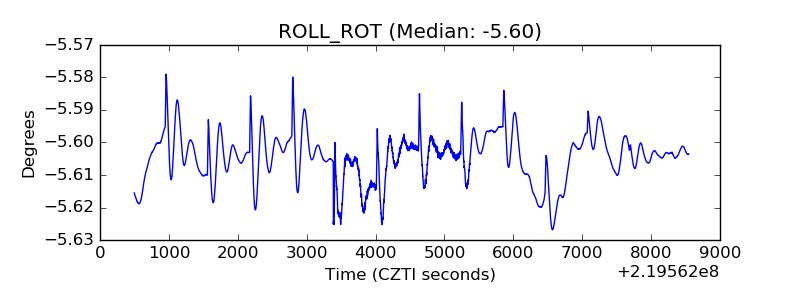 |
| _Roll_DEC | 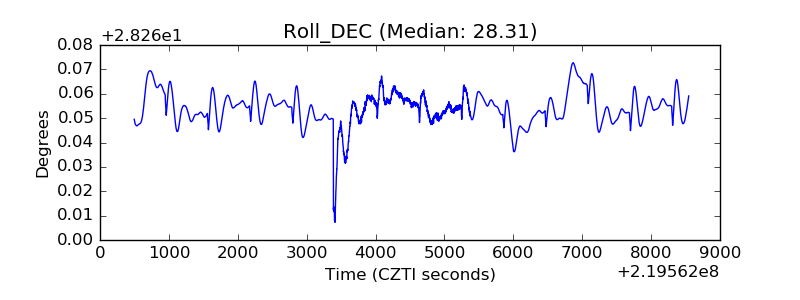 |
| _Roll_RA | 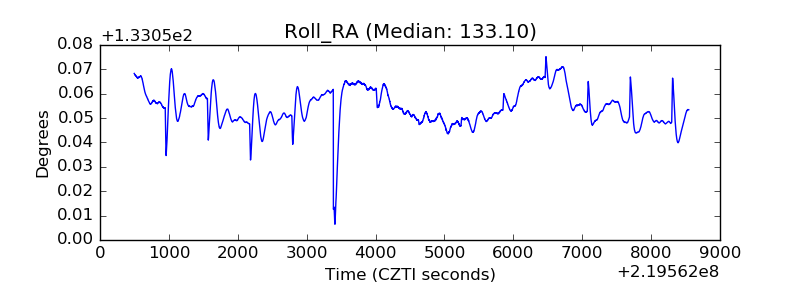 |
| Veto Counter | 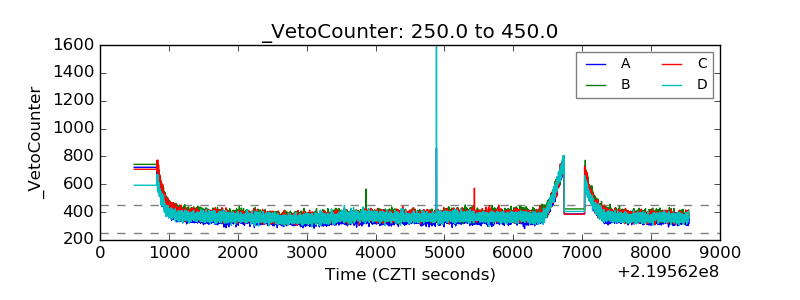 |