| Param | Original file | Final file |
|---|---|---|
| Filename | modeM0/AS1G06_169T01_9000000886_06590cztM0_level2.evt | modeM0/AS1G06_169T01_9000000886_06590cztM0_level2_quad_clean.evt |
| Size (bytes) | 282,784,320 | 39,208,320 |
| Size | 269.7 MB | 37.4 MB |
| Events in quadrant A | 1,902,814 | 226,555 |
| Events in quadrant B | 2,114,852 | 228,386 |
| Events in quadrant C | 1,821,077 | 225,393 |
| Events in quadrant D | 2,442,971 | 215,094 |
| Mode M0 | |||
|---|---|---|---|
| Quadrant | BADHDUFLAG | Total packets | Discarded packets |
| A | 0 | 8462 | 1 |
| B | 0 | 9078 | 1 |
| C | 0 | 8393 | 1 |
| D | 0 | 10016 | 1 |
| Mode SS | |||
|---|---|---|---|
| Quadrant | BADHDUFLAG | Total packets | Discarded packets |
| A | 0 | 84 | 0 |
| B | 0 | 84 | 0 |
| C | 0 | 84 | 0 |
| D | 0 | 84 | 0 |
| Quadrant | Total seconds | Saturated seconds | Saturation percentage |
|---|---|---|---|
| A | 4129 | 22 | 0.532817% |
| B | 4129 | 38 | 0.920320% |
| C | 4129 | 5 | 0.121095% |
| D | 4129 | 114 | 2.760959% |
Noise dominated data is calculated using 1-second bins in cleaned event files. If a bin has >2000 counts, and if more than 50% of those come from <1% of pixels, then it is considered to be noise-dominated and hence unusable.
| Quadrant | # 1 sec bins | Bins with >0 counts | Bins with >2000 counts | High rate bins dominated by noise | Noise dominated (total time) | Noise dominated (detector-on time) | Marked lightcurve |
|---|---|---|---|---|---|---|---|
| A | 4129 | 4129 | 5 | 5 | 0.12% | 0.12% | 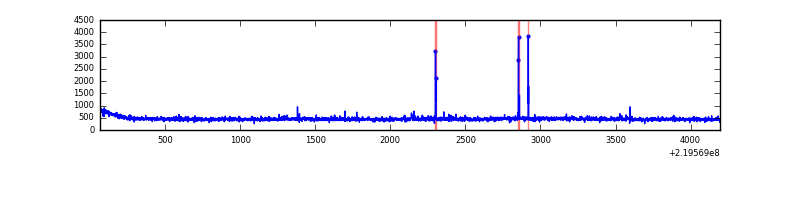 |
| B | 4129 | 4129 | 11 | 11 | 0.27% | 0.27% |  |
| C | 4129 | 4129 | 1 | 1 | 0.02% | 0.02% | 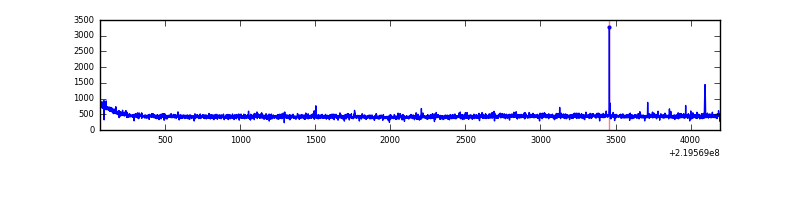 |
| D | 4129 | 4129 | 83 | 83 | 2.01% | 2.01% | 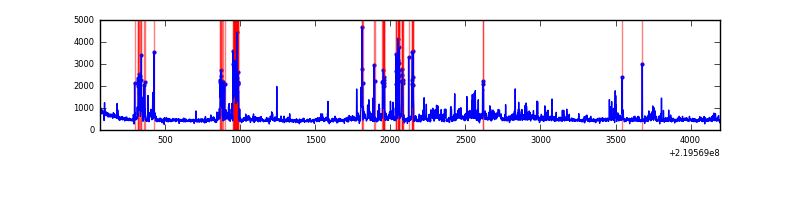 |
Top three noisy pixels from each quadrant. If the there are fewer than three noisy pixels in the level2.evt file, extra rows are filled as -1
| Pixel properties | Quadrant properties | ||||||
|---|---|---|---|---|---|---|---|
| Quadrant | DetID | PixID | Counts | Sigma | Mean | Median | Sigma |
| A | 8 | 15 | 29127 | 291.96 | 474 | 464 | 98.2 |
| A | 3 | 1 | 18250 | 181.17 | 474 | 464 | 98.2 |
| A | 15 | 239 | 16813 | 166.53 | 474 | 464 | 98.2 |
| B | 4 | 80 | 109796 | 1194.66 | 473 | 463 | 91.5 |
| B | 0 | 219 | 88320 | 960.0 | 473 | 463 | 91.5 |
| B | 0 | 214 | 34720 | 374.32 | 473 | 463 | 91.5 |
| C | 9 | 54 | 11695 | 104.6 | 457 | 460 | 107.4 |
| C | 8 | 128 | 10558 | 94.02 | 457 | 460 | 107.4 |
| C | 8 | 112 | 4966 | 41.95 | 457 | 460 | 107.4 |
| D | 2 | 33 | 258471 | 2285.85 | 457 | 442 | 112.9 |
| D | 2 | 152 | 121234 | 1070.08 | 457 | 442 | 112.9 |
| D | 13 | 172 | 120253 | 1061.39 | 457 | 442 | 112.9 |
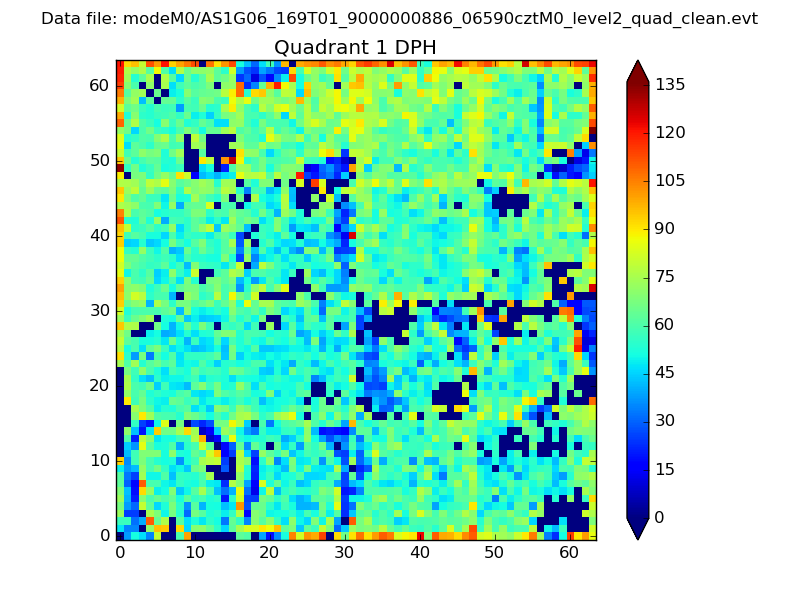
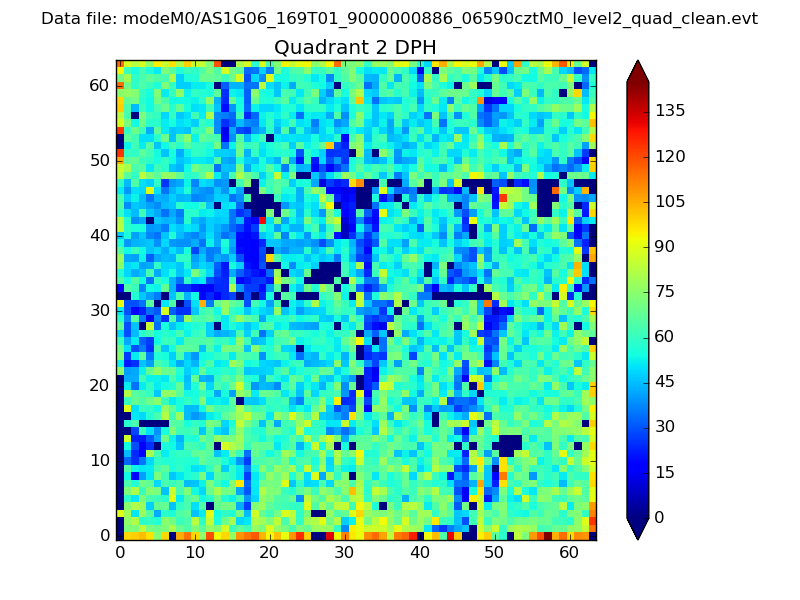
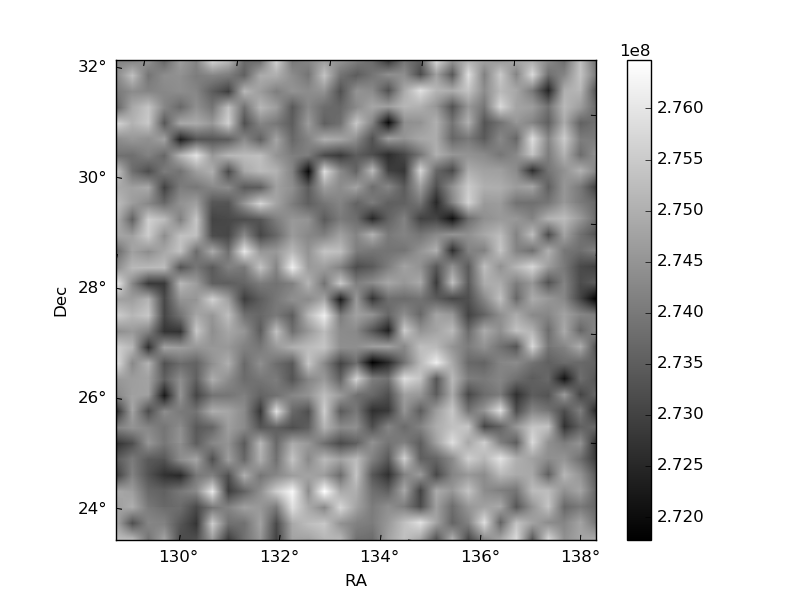
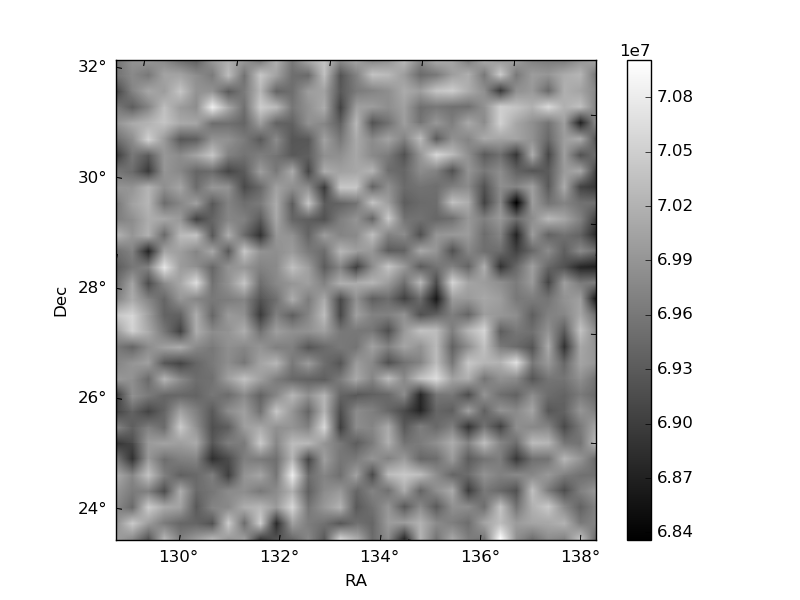
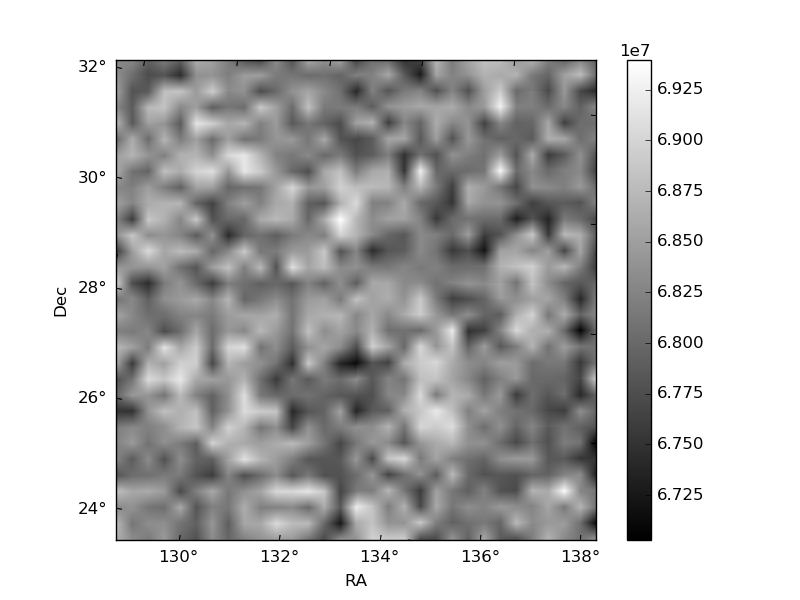
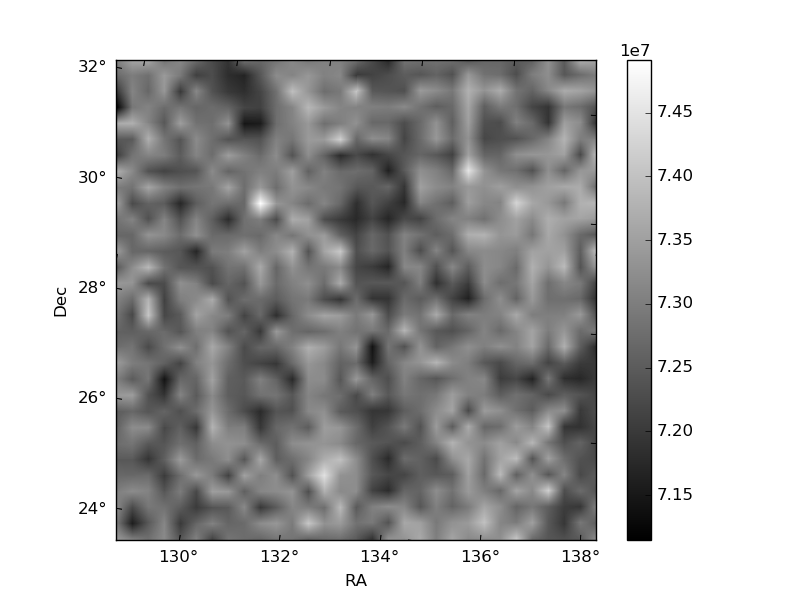
Histogram calculated using DETX and DETY for each event in the final _common_clean file
| Quadrant A | 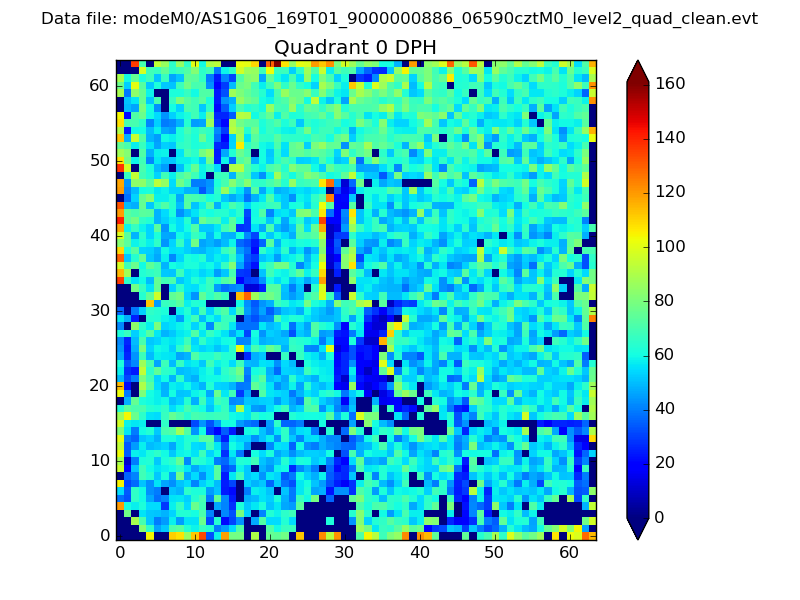 |
 |
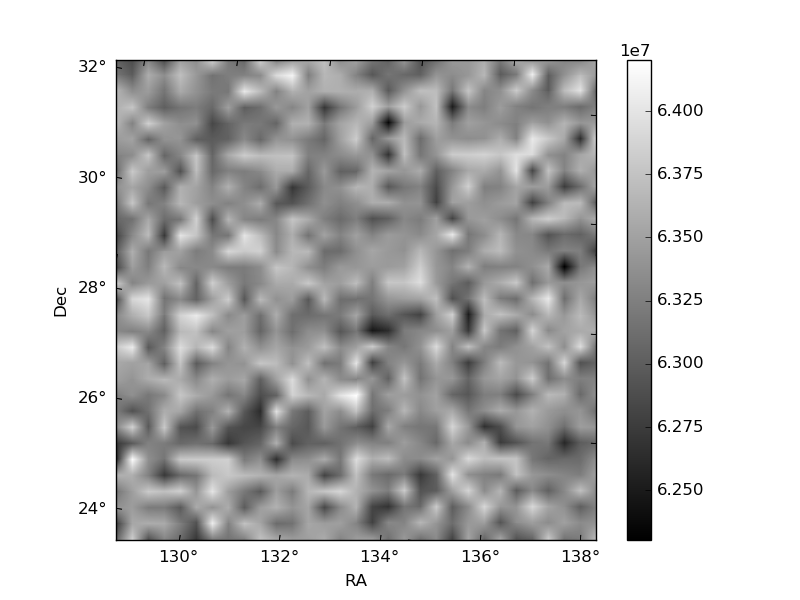
Quadrant B |
|---|---|---|---|
| Quadrant D | 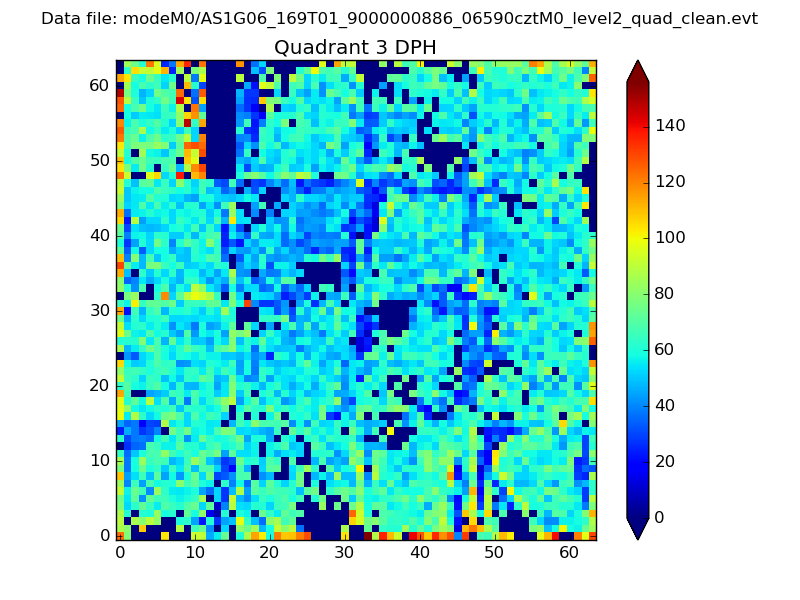 |
 |
Quadrant C |
| Plot type | Count rate plots | Images |
|---|---|---|
| Comparison with Poisson distribution Blue bars denote a histogram of data divided into 1 sec bins. Red curve is a Poisson curve with rate = median count rate of data. |
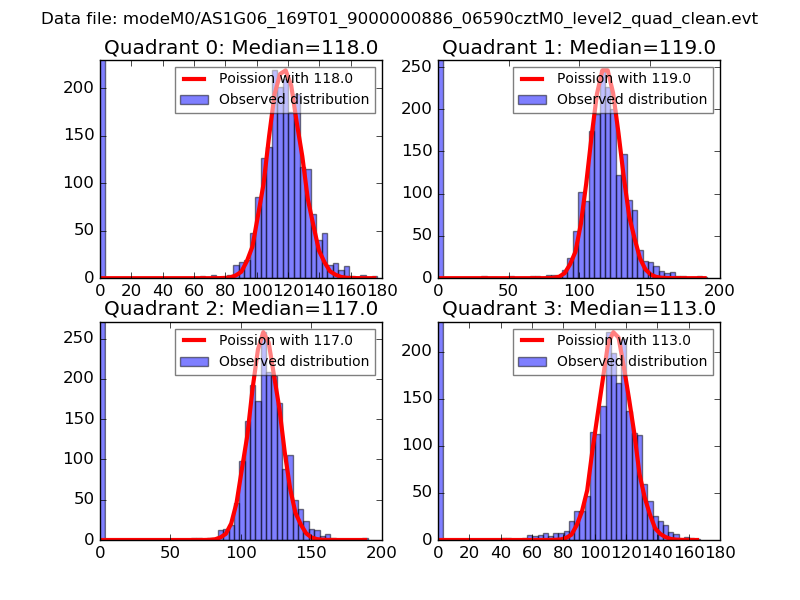 |
 |
| Quadrant-wise count rates Data is divided into 100 sec bins |
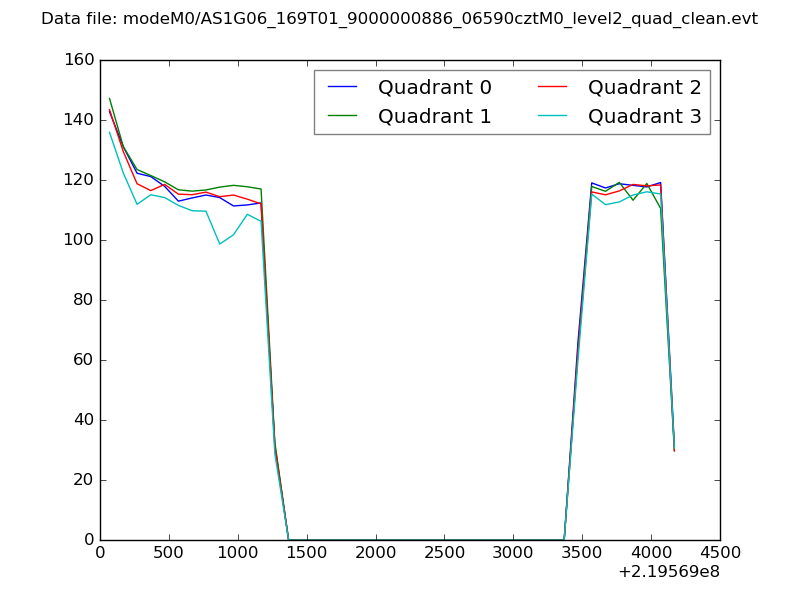 |
|
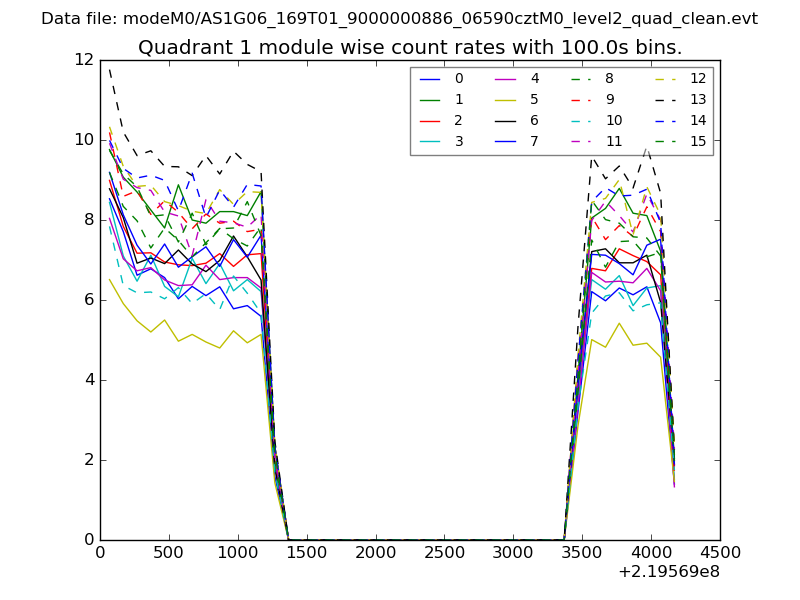
| Module-wise count rates for Quadrant A Data is divided into 100 sec bins |
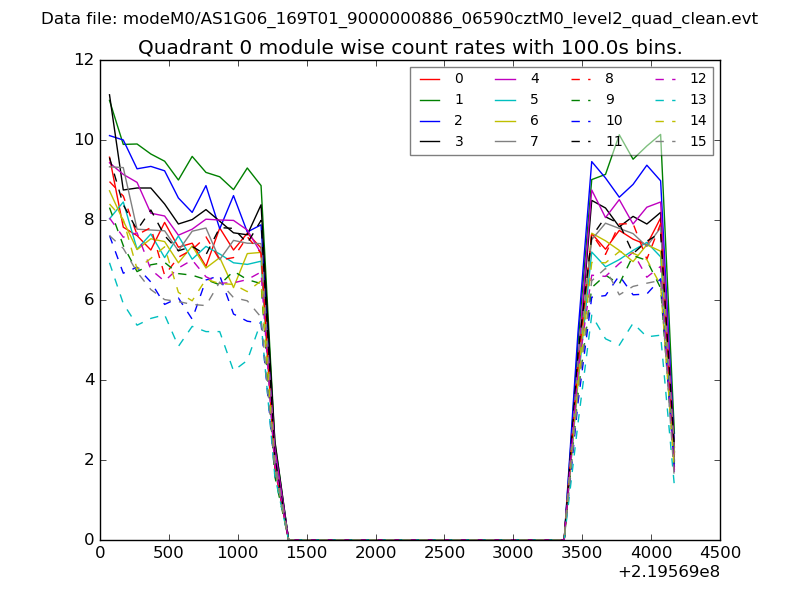 |
 |
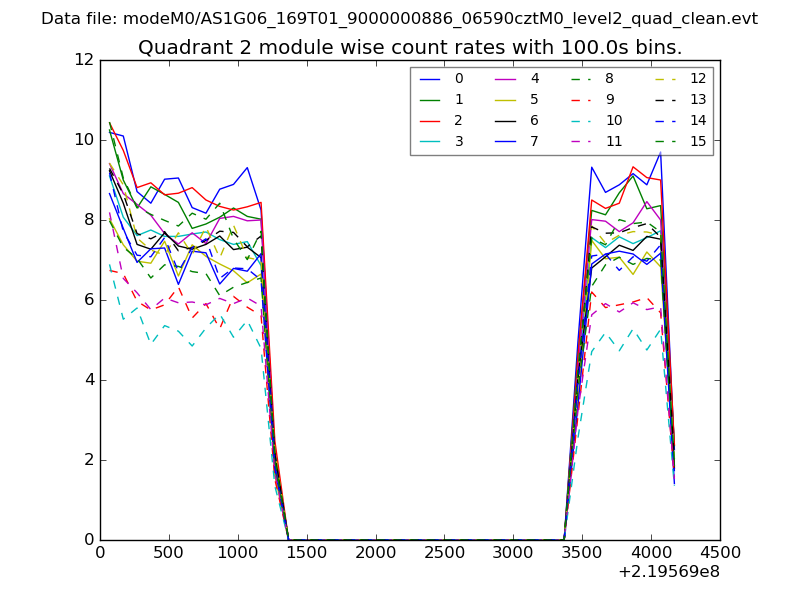
| Module-wise count rates for Quadrant B Data is divided into 100 sec bins |
 |
 |
| Module-wise count rates for Quadrant C Data is divided into 100 sec bins |
 |
 |
| Module-wise count rates for Quadrant D Data is divided into 100 sec bins |
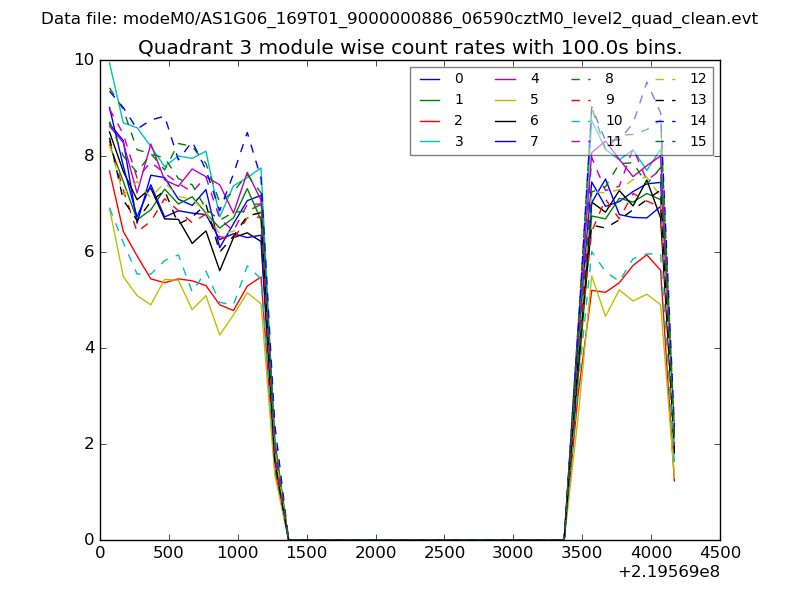 |
 |
| Parameter | Plot |
|---|---|
| CZT HV Monitor | 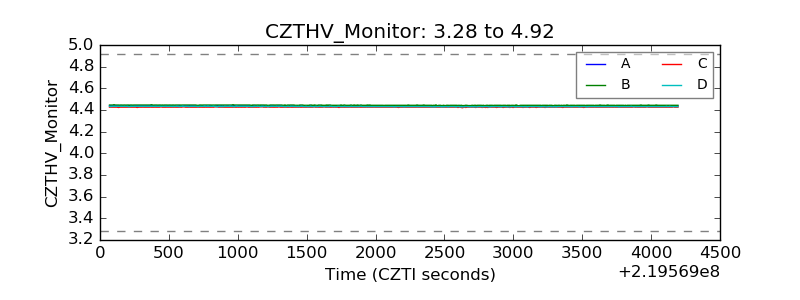 |
| D_VDD | 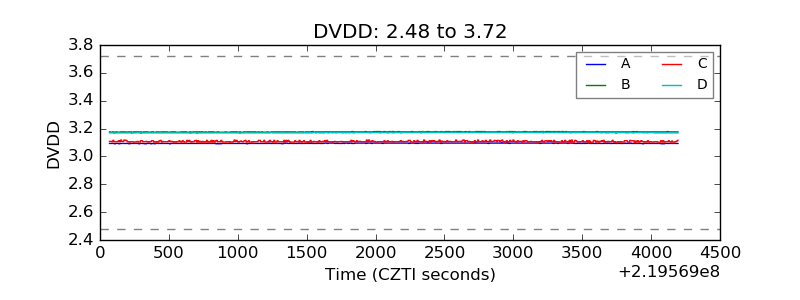 |
| Temperature 1 | 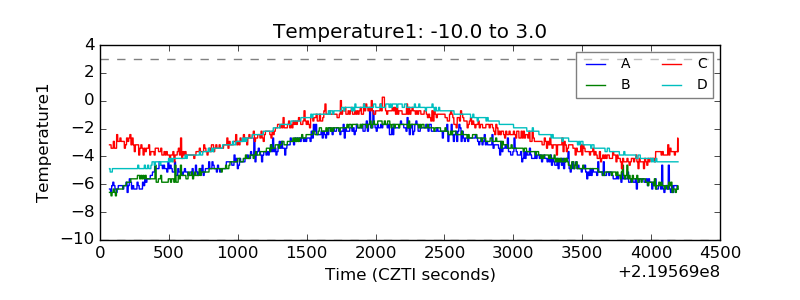 |
| Veto HV Monitor | 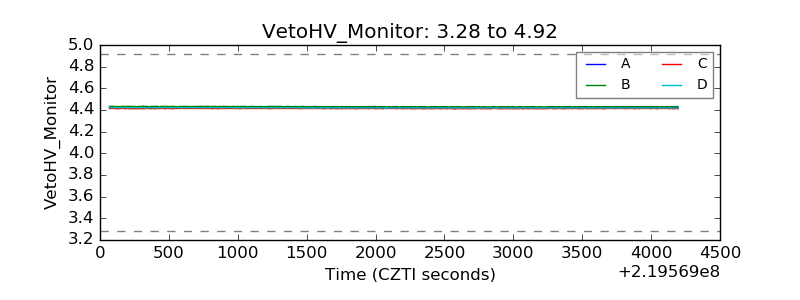 |
| Veto LLD | 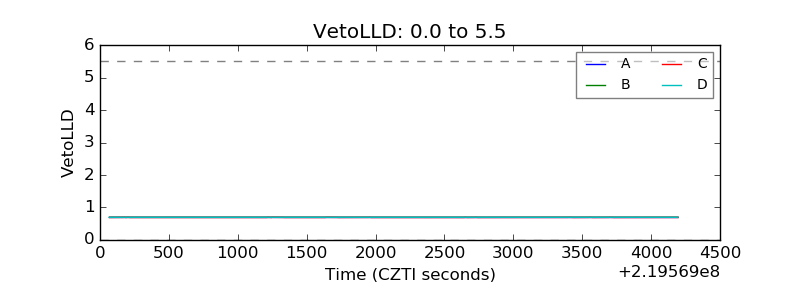 |
| Alpha Counter | 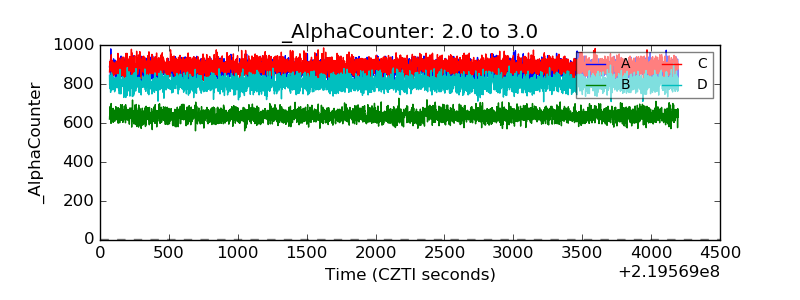 |
| _CPM_Rate | 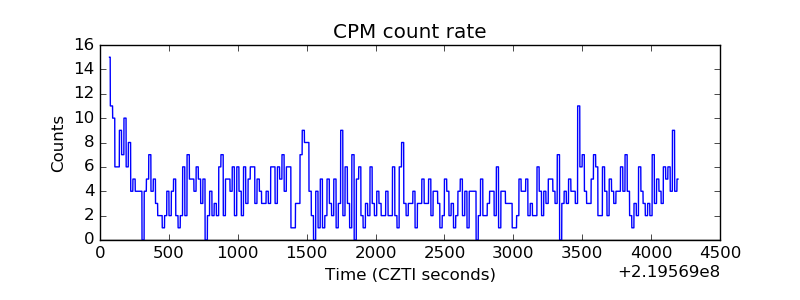 |
| CZT Counter | 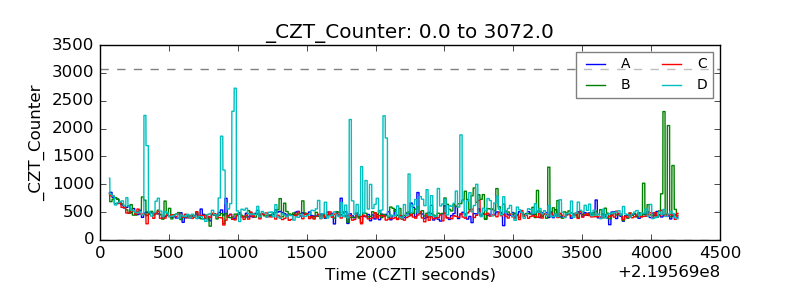 |
| +2.5 Volts monitor |  |
| +5 Volts monitor |  |
| _ROLL_ROT | 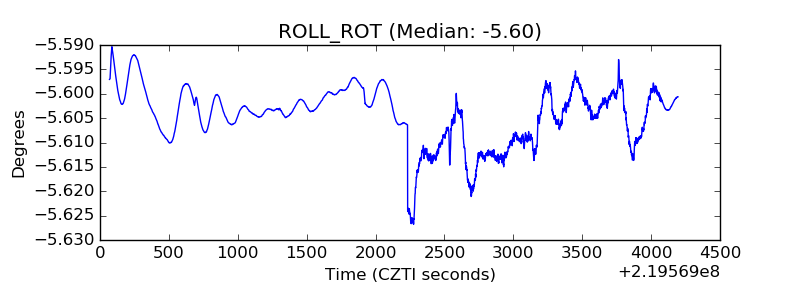 |
| _Roll_DEC | 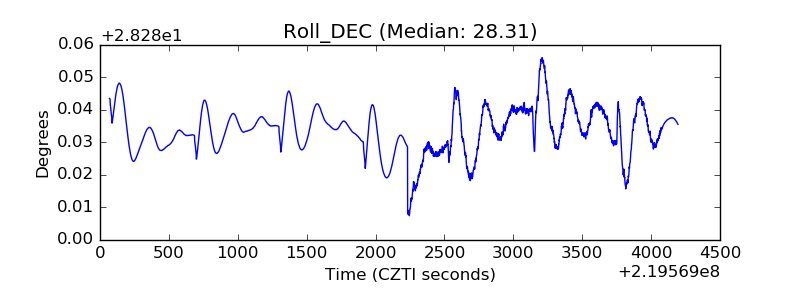 |
| _Roll_RA | 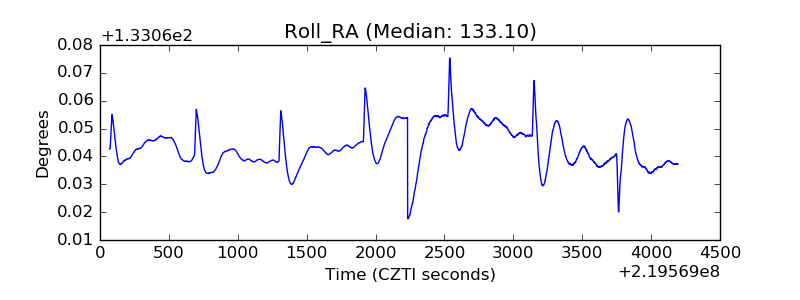 |
| Veto Counter | 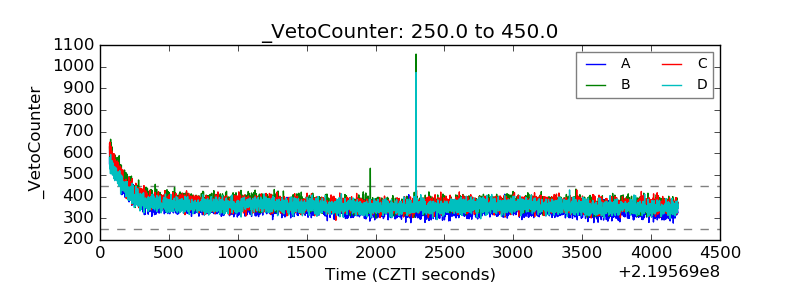 |