| Param | Original file | Final file |
|---|---|---|
| Filename | modeM0/AS1C02_002T01_9000000888cztM0_level2.fits | modeM0/AS1C02_002T01_9000000888cztM0_level2_quad_clean.evt |
| Size (bytes) | 139,020,480 | 137,448,000 |
| Size | 132.6 MB | 131.1 MB |
| Events in quadrant A | 824,642 | 815,422 |
| Events in quadrant B | 800,714 | 807,944 |
| Events in quadrant C | 818,682 | 776,749 |
| Events in quadrant D | 695,370 | 691,786 |
| Mode SS | |||
|---|---|---|---|
| Quadrant | BADHDUFLAG | Total packets | Discarded packets |
| A | 0 | 314 | 0 |
| B | 0 | 314 | 0 |
| C | 0 | 314 | 0 |
| D | 0 | 314 | 0 |
| Mode M0 | |||
|---|---|---|---|
| Quadrant | BADHDUFLAG | Total packets | Discarded packets |
| A | 0 | 32229 | 0 |
| B | 0 | 33181 | 0 |
| C | 0 | 32124 | 0 |
| D | 0 | 40583 | 0 |
| Mode M9 | |||
|---|---|---|---|
| Quadrant | BADHDUFLAG | Total packets | Discarded packets |
| A | 0 | 7 | 0 |
| B | 0 | 7 | 0 |
| C | 0 | 7 | 0 |
| D | 0 | 7 | 0 |
| Quadrant | Total seconds | Saturated seconds | Saturation percentage |
|---|---|---|---|
| A | 15510 | 539 | 3.475177% |
| B | 15510 | 592 | 3.816892% |
| C | 15510 | 335 | 2.159897% |
| D | 15510 | 1038 | 6.692456% |
Noise dominated data is calculated using 1-second bins in cleaned event files. If a bin has >2000 counts, and if more than 50% of those come from <1% of pixels, then it is considered to be noise-dominated and hence unusable.
| Quadrant | # 1 sec bins | Bins with >0 counts | Bins with >2000 counts | High rate bins dominated by noise | Noise dominated (total time) | Noise dominated (detector-on time) | Marked lightcurve |
|---|---|---|---|---|---|---|---|
| A | 16220 | 15510 | 0 | 0 | 0.00% | 0.00% |  |
| B | 16220 | 15511 | 0 | 0 | 0.00% | 0.00% |  |
| C | 16220 | 15511 | 0 | 0 | 0.00% | 0.00% |  |
| D | 16220 | 15500 | 0 | 0 | 0.00% | 0.00% |  |
Top three noisy pixels from each quadrant. If the there are fewer than three noisy pixels in the level2.evt file, extra rows are filled as -1
| Pixel properties | Quadrant properties | ||||||
|---|---|---|---|---|---|---|---|
| Quadrant | DetID | PixID | Counts | Sigma | Mean | Median | Sigma |
| A | 14 | 188 | 815 | 10.79 | 213 | 198 | 57.2 |
| A | 0 | 29 | 753 | 9.7 | 213 | 198 | 57.2 |
| A | 7 | 110 | 725 | 9.21 | 213 | 198 | 57.2 |
| B | 2 | 9 | 748 | 11.62 | 211 | 198 | 47.3 |
| B | 3 | 17 | 568 | 7.82 | 211 | 198 | 47.3 |
| B | 12 | 226 | 563 | 7.71 | 211 | 198 | 47.3 |
| C | 12 | 241 | 603 | 6.76 | 216 | 198 | 59.9 |
| C | 9 | 188 | 586 | 6.48 | 216 | 198 | 59.9 |
| C | 3 | 126 | 550 | 5.88 | 216 | 198 | 59.9 |
| D | 4 | 246 | 585 | 7.36 | 198 | 178 | 55.3 |
| D | 3 | 14 | 582 | 7.31 | 198 | 178 | 55.3 |
| D | 1 | 19 | 512 | 6.04 | 198 | 178 | 55.3 |
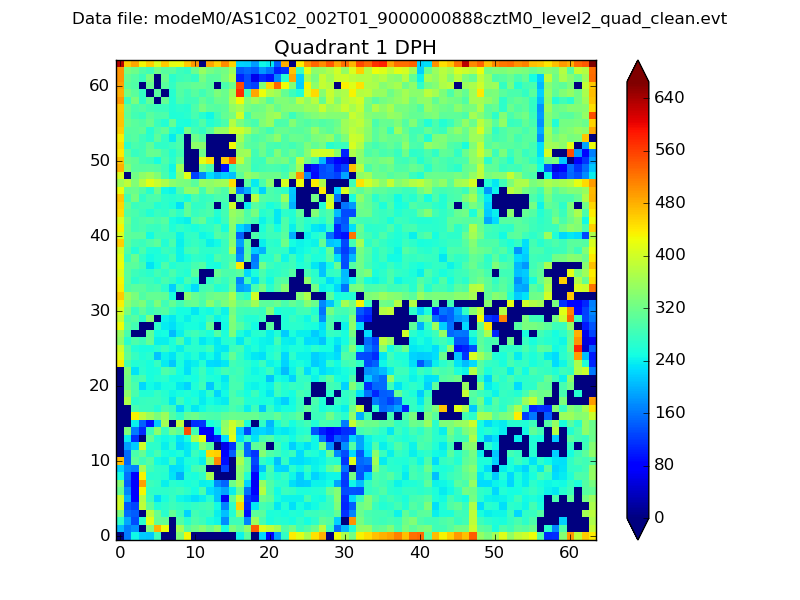
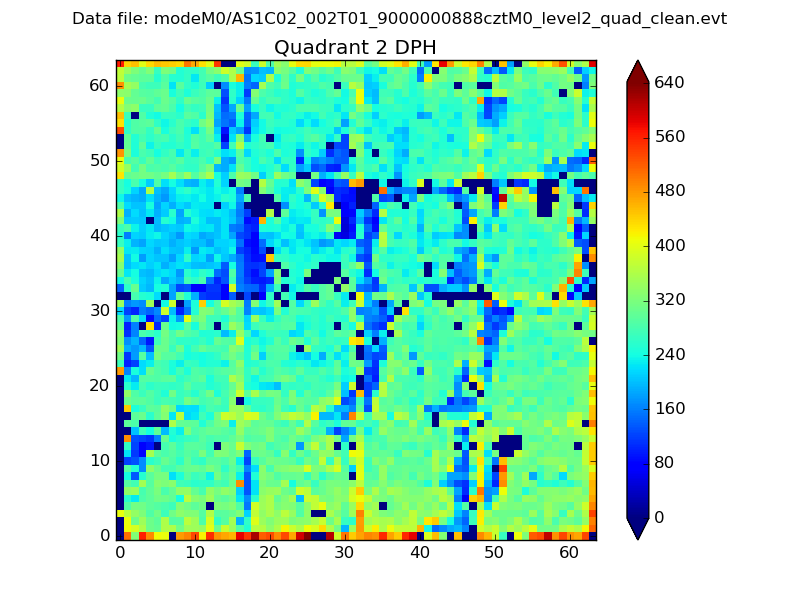
Histogram calculated using DETX and DETY for each event in the final _common_clean file
| Quadrant A |  |
 |
Quadrant B |
|---|---|---|---|
| Quadrant D |  |
 |
Quadrant C |
| Plot type | Count rate plots | Images |
|---|---|---|
| Comparison with Poisson distribution Blue bars denote a histogram of data divided into 1 sec bins. Red curve is a Poisson curve with rate = median count rate of data. |
 |
 |
| Quadrant-wise count rates Data is divided into 100 sec bins |
 |
|
| Module-wise count rates for Quadrant A Data is divided into 100 sec bins |
 |
 |
| Module-wise count rates for Quadrant B Data is divided into 100 sec bins |
 |
 |
| Module-wise count rates for Quadrant C Data is divided into 100 sec bins |
 |
 |
| Module-wise count rates for Quadrant D Data is divided into 100 sec bins |
 |
 |
| Parameter | Plot |
|---|---|
| CZT HV Monitor |  |
| D_VDD |  |
| Temperature 1 |  |
| Veto HV Monitor |  |
| Veto LLD |  |
| Alpha Counter |  |
| _CPM_Rate |  |
| CZT Counter |  |
| +2.5 Volts monitor |  |
| +5 Volts monitor |  |
| _ROLL_ROT |  |
| _Roll_DEC |  |
| _Roll_RA |  |
| Veto Counter |  |