| Param | Original file | Final file |
|---|---|---|
| Filename | modeM0/AS1C02_002T01_9000000888_06590cztM0_level2.evt | modeM0/AS1C02_002T01_9000000888_06590cztM0_level2_quad_clean.evt |
| Size (bytes) | 176,630,400 | 7,165,440 |
| Size | 168.4 MB | 6.8 MB |
| Events in quadrant A | 1,181,706 | 15,816 |
| Events in quadrant B | 1,169,168 | 16,049 |
| Events in quadrant C | 1,153,151 | 15,328 |
| Events in quadrant D | 1,698,253 | 14,926 |
| Mode SS | |||
|---|---|---|---|
| Quadrant | BADHDUFLAG | Total packets | Discarded packets |
| A | 0 | 44 | 0 |
| B | 0 | 44 | 0 |
| C | 0 | 44 | 0 |
| D | 0 | 44 | 0 |
| Mode M0 | |||
|---|---|---|---|
| Quadrant | BADHDUFLAG | Total packets | Discarded packets |
| A | 0 | 4901 | 3 |
| B | 0 | 4805 | 2 |
| C | 0 | 4809 | 2 |
| D | 0 | 6481 | 2 |
| Quadrant | Total seconds | Saturated seconds | Saturation percentage |
|---|---|---|---|
| A | 2119 | 305 | 14.393582% |
| B | 2119 | 274 | 12.930628% |
| C | 2119 | 176 | 8.305805% |
| D | 2119 | 316 | 14.912695% |
Noise dominated data is calculated using 1-second bins in cleaned event files. If a bin has >2000 counts, and if more than 50% of those come from <1% of pixels, then it is considered to be noise-dominated and hence unusable.
| Quadrant | # 1 sec bins | Bins with >0 counts | Bins with >2000 counts | High rate bins dominated by noise | Noise dominated (total time) | Noise dominated (detector-on time) | Marked lightcurve |
|---|---|---|---|---|---|---|---|
| A | 2174 | 2121 | 0 | 0 | 0.00% | 0.00% | 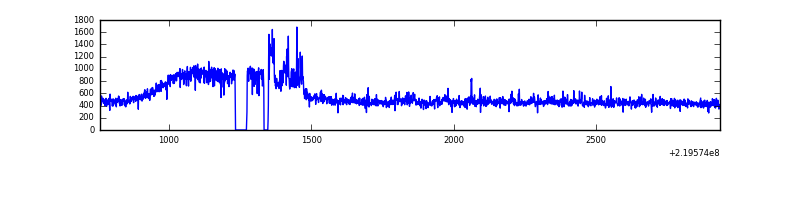 |
| B | 2174 | 2121 | 0 | 0 | 0.00% | 0.00% | 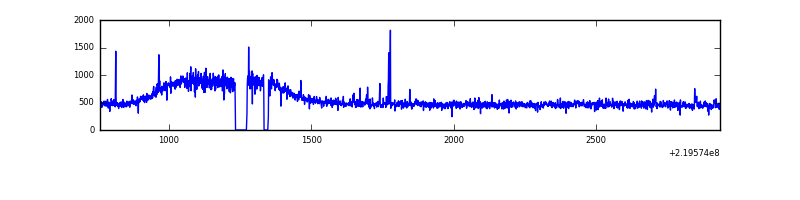 |
| C | 2174 | 2121 | 0 | 0 | 0.00% | 0.00% | 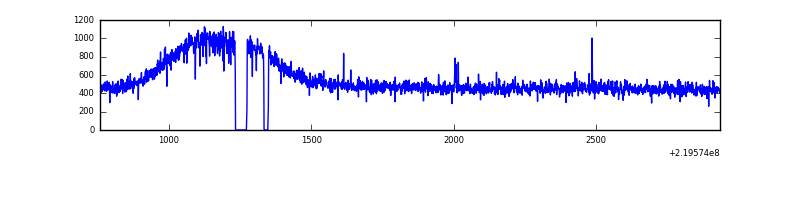 |
| D | 2174 | 2121 | 99 | 99 | 4.55% | 4.67% | 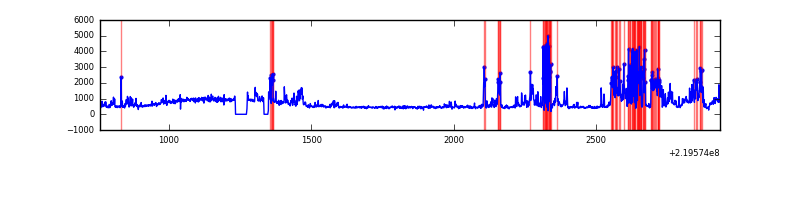 |
Top three noisy pixels from each quadrant. If the there are fewer than three noisy pixels in the level2.evt file, extra rows are filled as -1
| Pixel properties | Quadrant properties | ||||||
|---|---|---|---|---|---|---|---|
| Quadrant | DetID | PixID | Counts | Sigma | Mean | Median | Sigma |
| A | 14 | 111 | 60578 | 957.53 | 288 | 278 | 63.0 |
| A | 8 | 15 | 12594 | 195.57 | 288 | 278 | 63.0 |
| A | 0 | 226 | 2726 | 38.87 | 288 | 278 | 63.0 |
| B | 0 | 219 | 21616 | 347.36 | 293 | 283 | 61.4 |
| B | 12 | 111 | 6616 | 103.12 | 293 | 283 | 61.4 |
| B | 11 | 111 | 5144 | 79.15 | 293 | 283 | 61.4 |
| C | 8 | 128 | 5536 | 73.4 | 292 | 292 | 71.4 |
| C | 8 | 112 | 2508 | 31.02 | 292 | 292 | 71.4 |
| C | 13 | 61 | 2369 | 29.07 | 292 | 292 | 71.4 |
| D | 2 | 33 | 477241 | 6639.98 | 280 | 270 | 71.8 |
| D | 2 | 14 | 74176 | 1028.86 | 280 | 270 | 71.8 |
| D | 2 | 136 | 53350 | 738.93 | 280 | 270 | 71.8 |
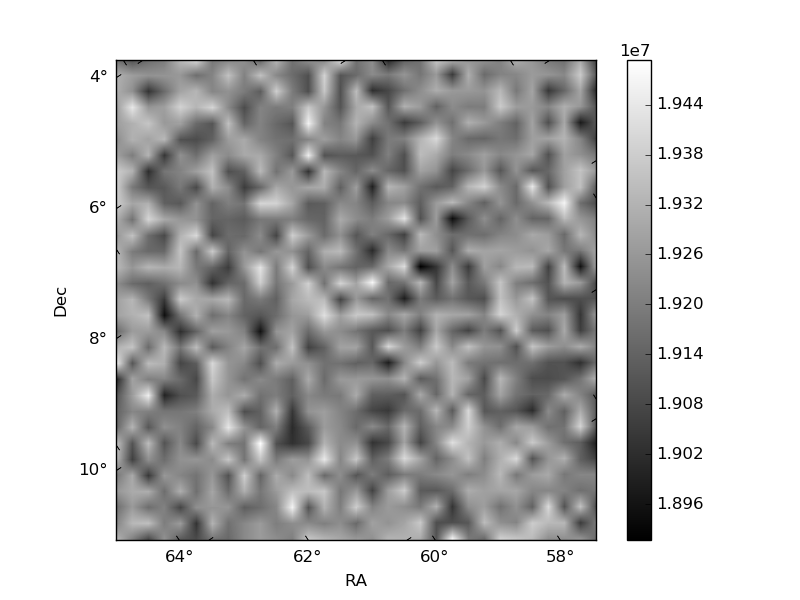
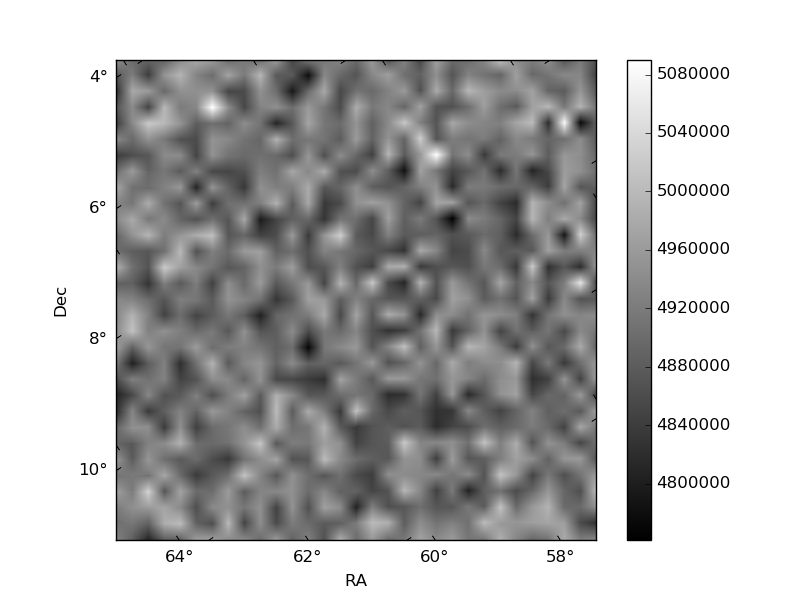
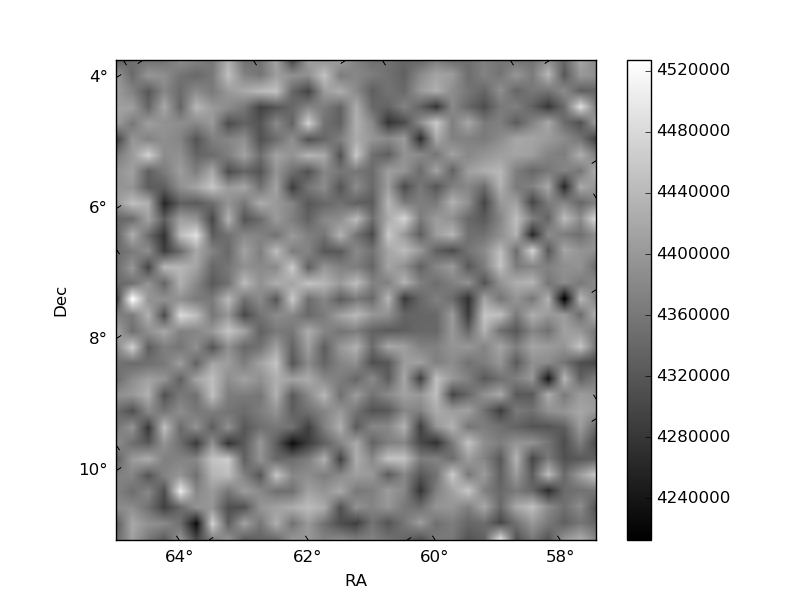
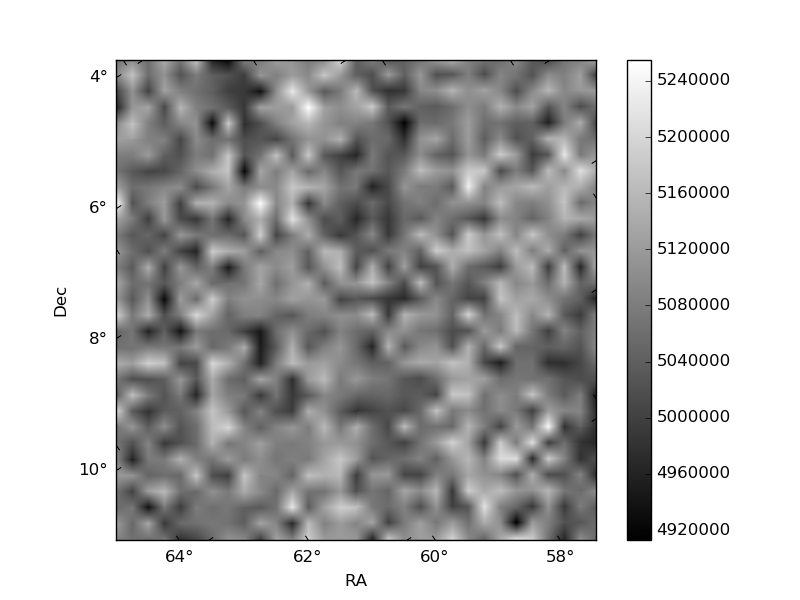
Histogram calculated using DETX and DETY for each event in the final _common_clean file
| Quadrant A | 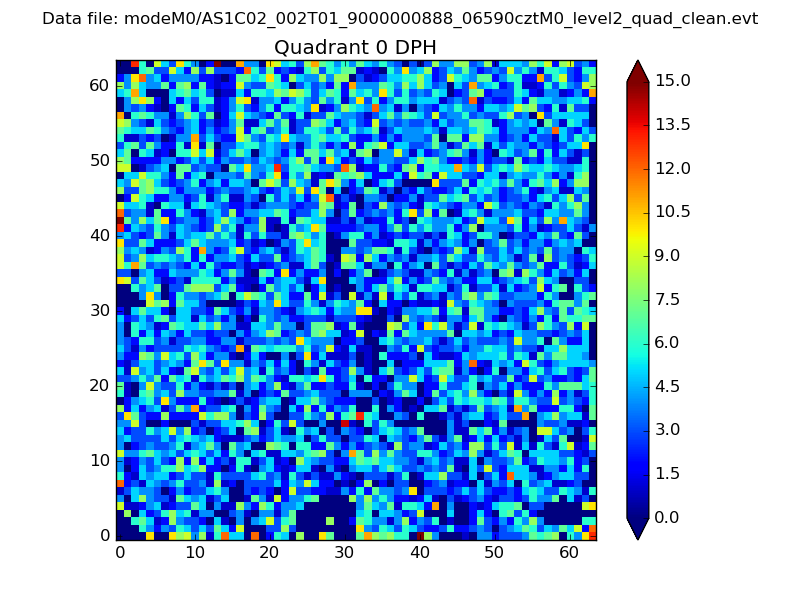 |
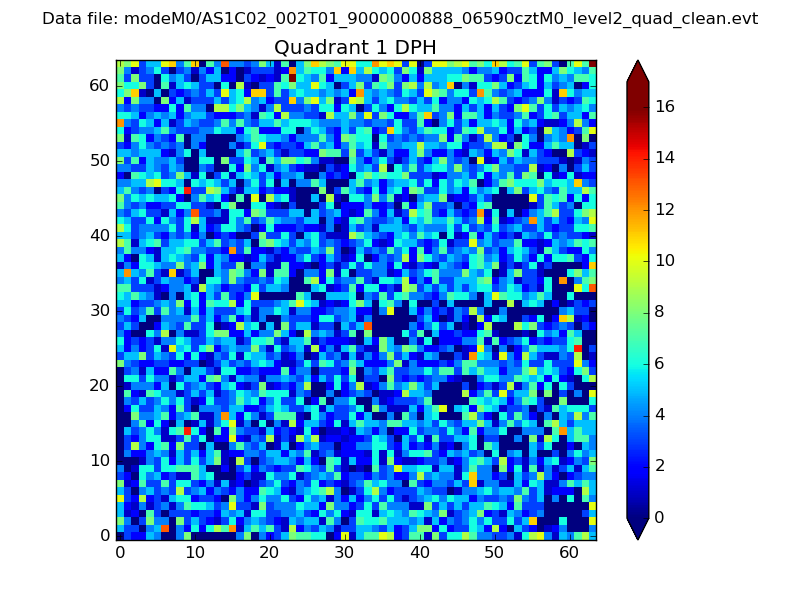 |
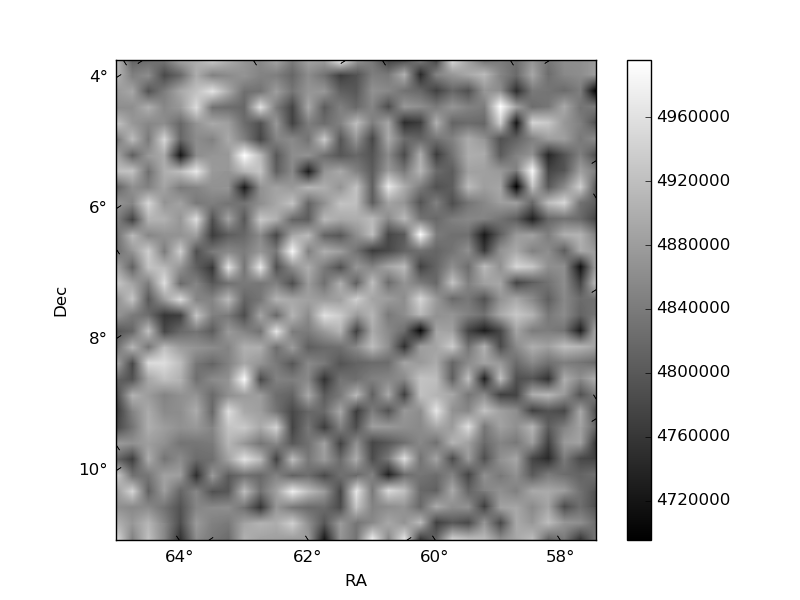
Quadrant B |
|---|---|---|---|
| Quadrant D | 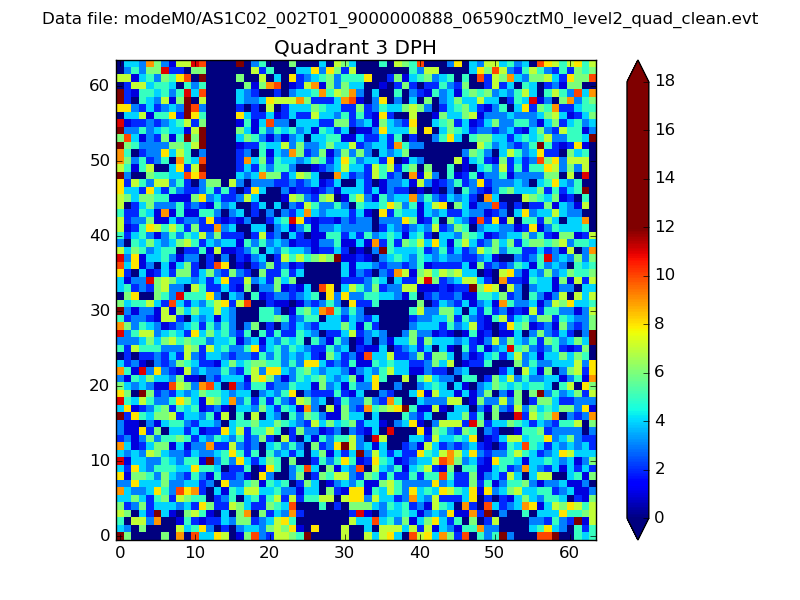 |
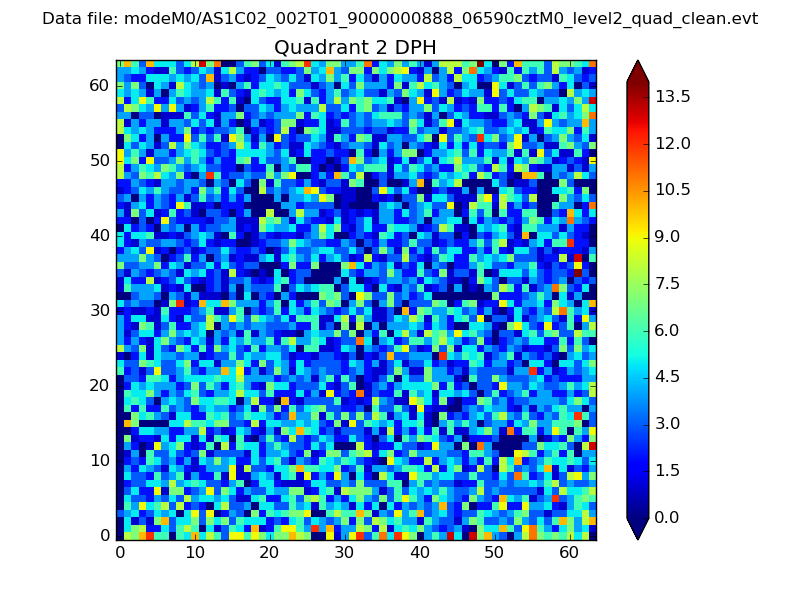 |
Quadrant C |
| Plot type | Count rate plots | Images |
|---|---|---|
| Comparison with Poisson distribution Blue bars denote a histogram of data divided into 1 sec bins. Red curve is a Poisson curve with rate = median count rate of data. |
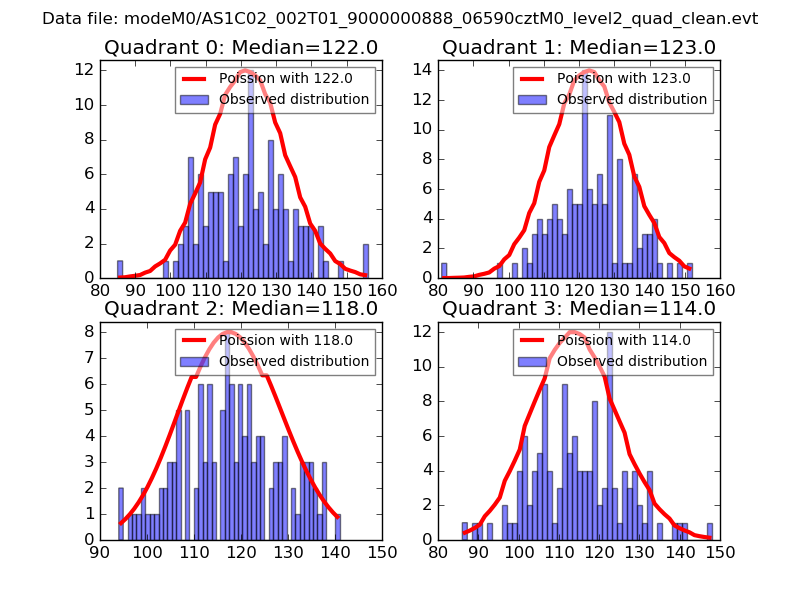 |
 |
| Quadrant-wise count rates Data is divided into 100 sec bins |
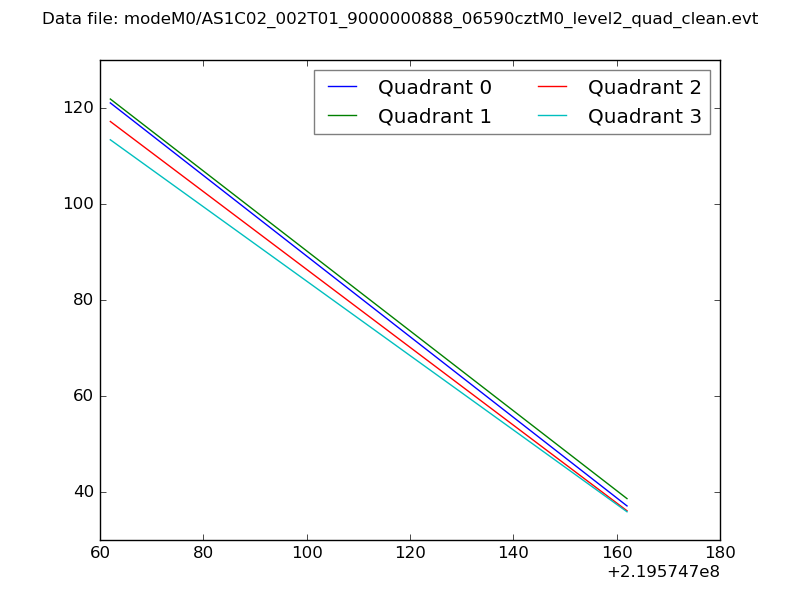 |
|
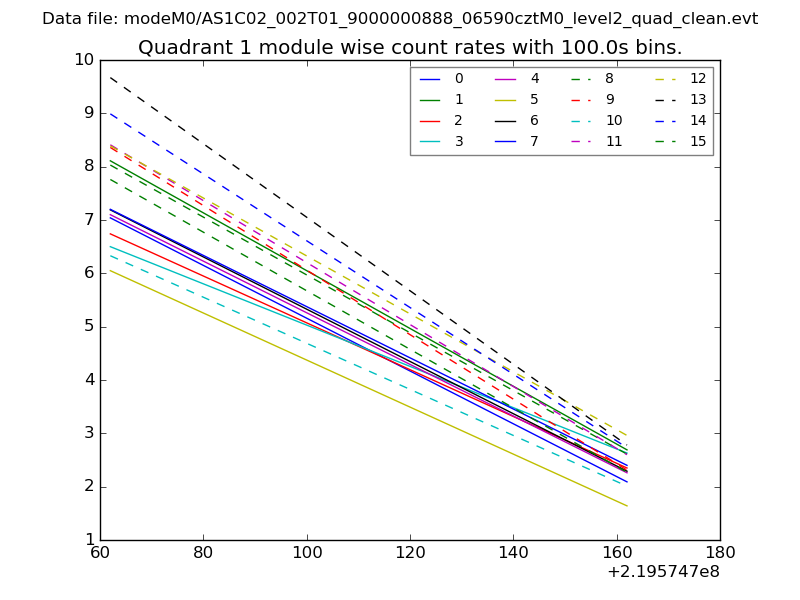
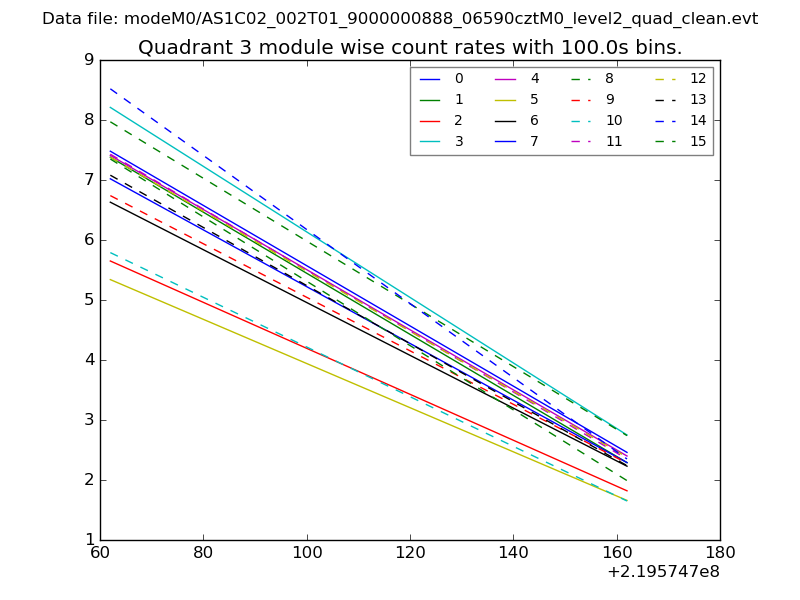
| Module-wise count rates for Quadrant A Data is divided into 100 sec bins |
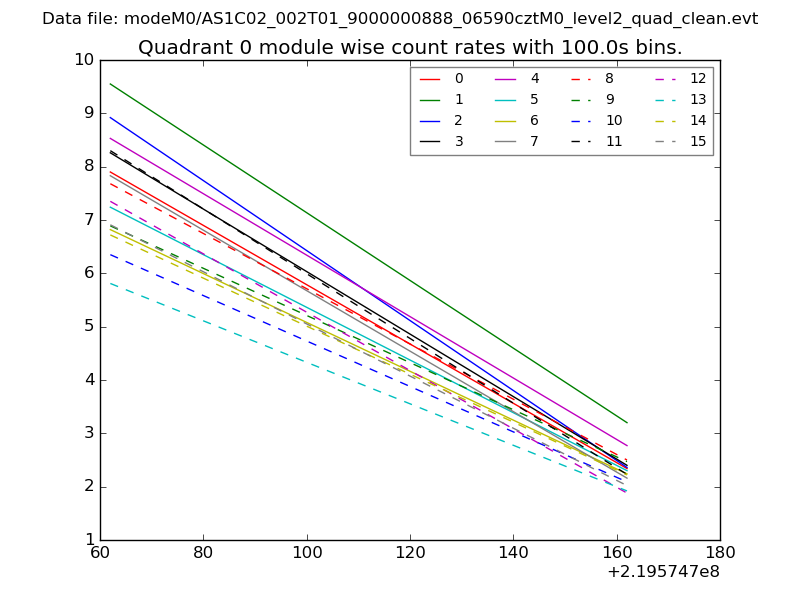 |
 |
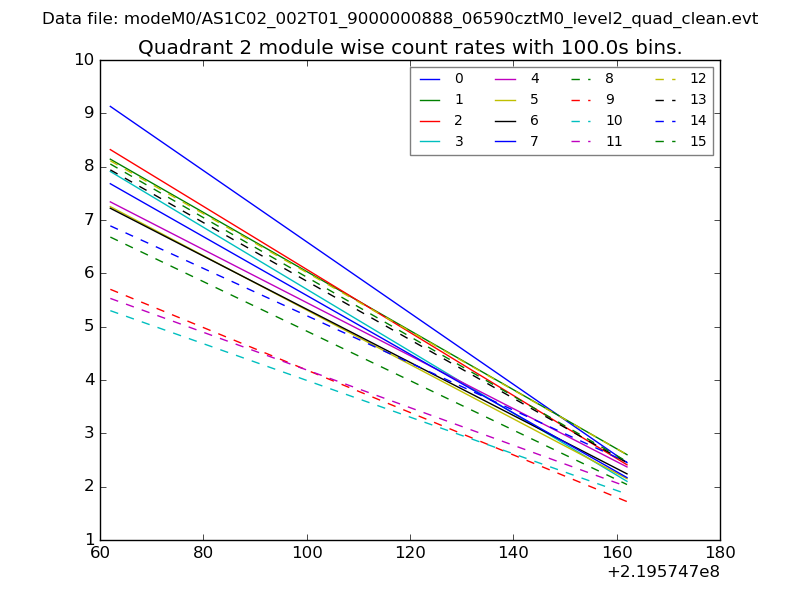
| Module-wise count rates for Quadrant B Data is divided into 100 sec bins |
 |
 |
| Module-wise count rates for Quadrant C Data is divided into 100 sec bins |
 |
 |
| Module-wise count rates for Quadrant D Data is divided into 100 sec bins |
 |
 |
| Parameter | Plot |
|---|---|
| CZT HV Monitor | 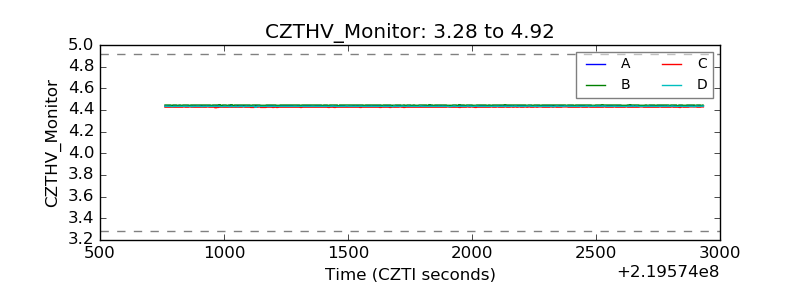 |
| D_VDD | 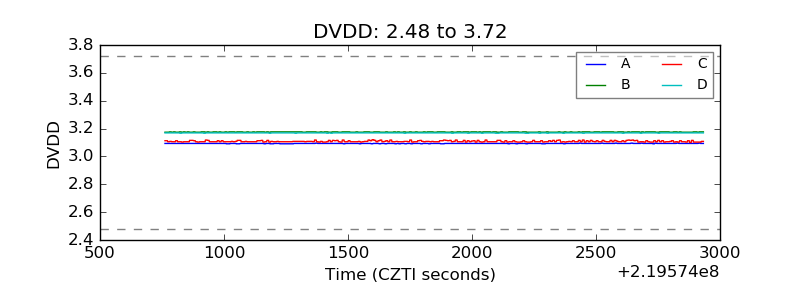 |
| Temperature 1 | 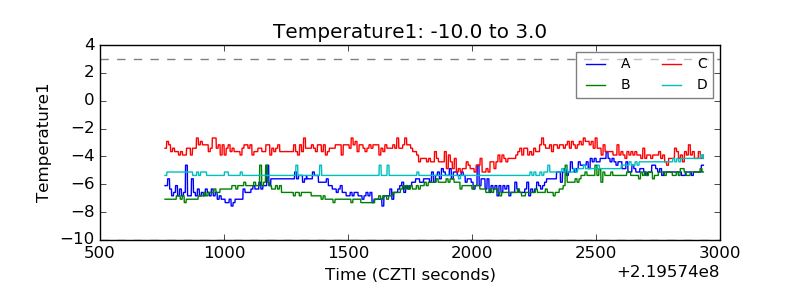 |
| Veto HV Monitor | 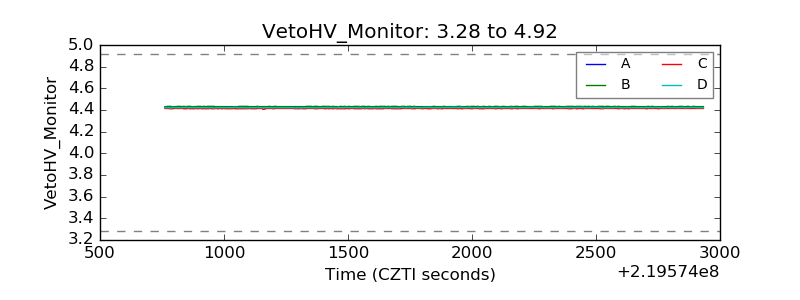 |
| Veto LLD | 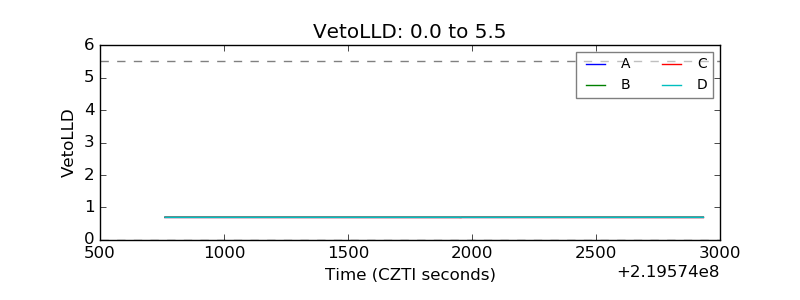 |
| Alpha Counter | 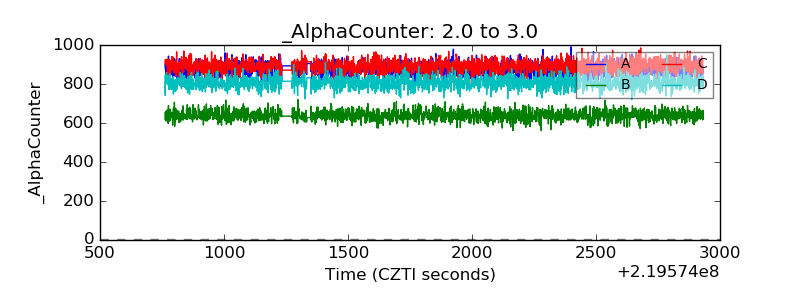 |
| _CPM_Rate | 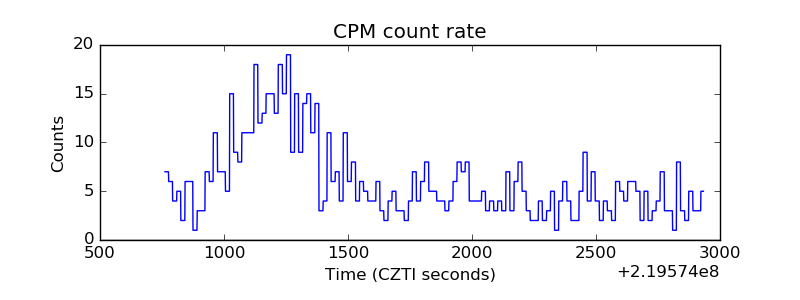 |
| CZT Counter | 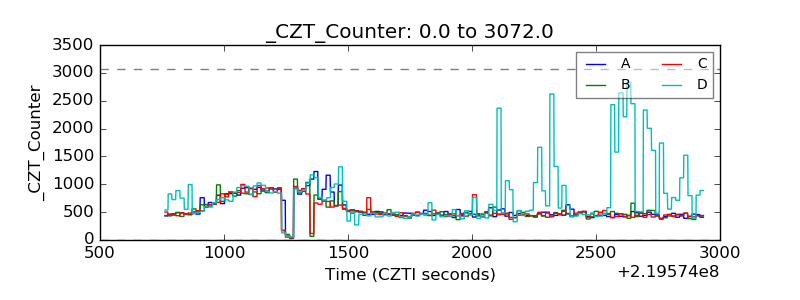 |
| +2.5 Volts monitor | 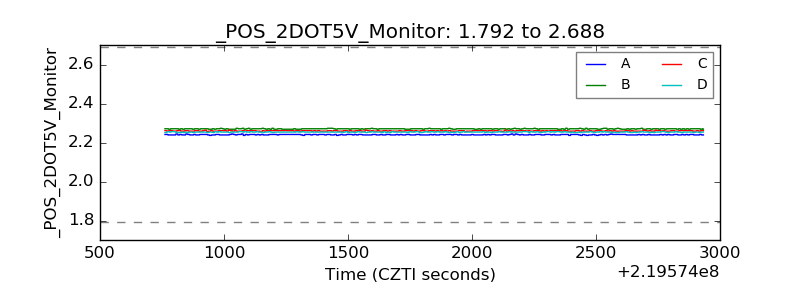 |
| +5 Volts monitor | 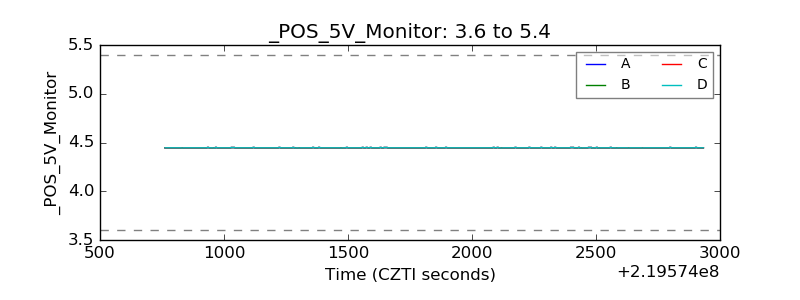 |
| _ROLL_ROT | 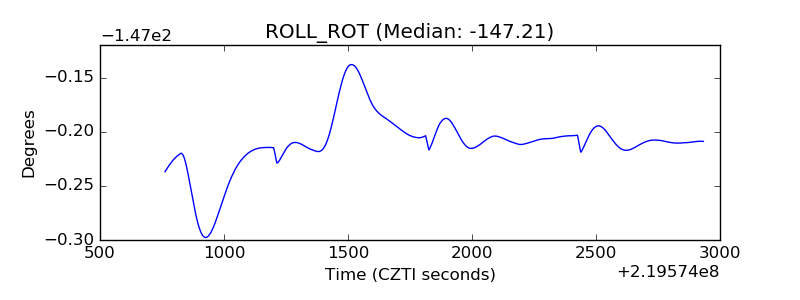 |
| _Roll_DEC | 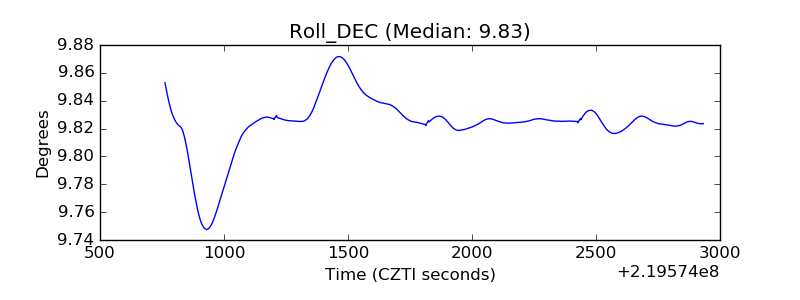 |
| _Roll_RA | 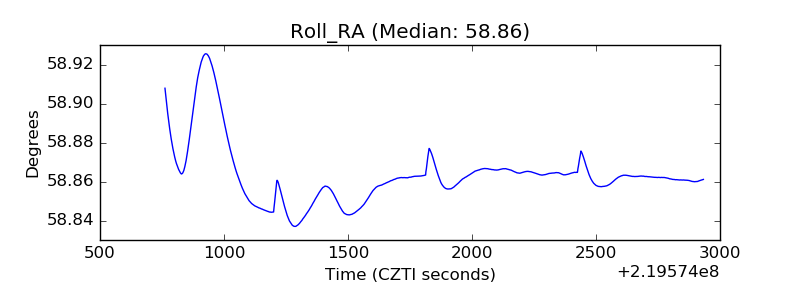 |
| Veto Counter | 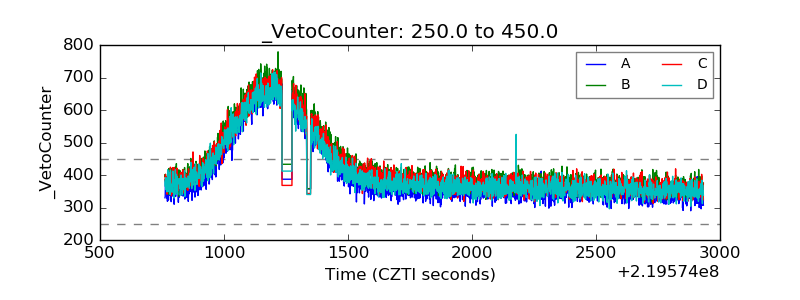 |