| Param | Original file | Final file |
|---|---|---|
| Filename | modeM0/AS1C02_002T01_9000000888_06595cztM0_level2.evt | modeM0/AS1C02_002T01_9000000888_06595cztM0_level2_quad_clean.evt |
| Size (bytes) | 1,055,030,400 | 173,194,560 |
| Size | 1006.2 MB | 165.2 MB |
| Events in quadrant A | 7,006,905 | 1,064,828 |
| Events in quadrant B | 7,353,635 | 1,070,264 |
| Events in quadrant C | 6,774,043 | 1,060,074 |
| Events in quadrant D | 9,795,473 | 1,008,694 |
| Mode SS | |||
|---|---|---|---|
| Quadrant | BADHDUFLAG | Total packets | Discarded packets |
| A | 0 | 306 | 0 |
| B | 0 | 306 | 0 |
| C | 0 | 306 | 0 |
| D | 0 | 306 | 0 |
| Mode M0 | |||
|---|---|---|---|
| Quadrant | BADHDUFLAG | Total packets | Discarded packets |
| A | 0 | 31091 | 4 |
| B | 0 | 32058 | 4 |
| C | 0 | 30971 | 4 |
| D | 0 | 39361 | 4 |
| Mode M9 | |||
|---|---|---|---|
| Quadrant | BADHDUFLAG | Total packets | Discarded packets |
| A | 0 | 7 | 0 |
| B | 0 | 7 | 0 |
| C | 0 | 7 | 0 |
| D | 0 | 7 | 0 |
| Quadrant | Total seconds | Saturated seconds | Saturation percentage |
|---|---|---|---|
| A | 15089 | 392 | 2.597919% |
| B | 15089 | 436 | 2.889522% |
| C | 15089 | 235 | 1.557426% |
| D | 15089 | 941 | 6.236331% |
Noise dominated data is calculated using 1-second bins in cleaned event files. If a bin has >2000 counts, and if more than 50% of those come from <1% of pixels, then it is considered to be noise-dominated and hence unusable.
| Quadrant | # 1 sec bins | Bins with >0 counts | Bins with >2000 counts | High rate bins dominated by noise | Noise dominated (total time) | Noise dominated (detector-on time) | Marked lightcurve |
|---|---|---|---|---|---|---|---|
| A | 15799 | 15093 | 0 | 0 | 0.00% | 0.00% | 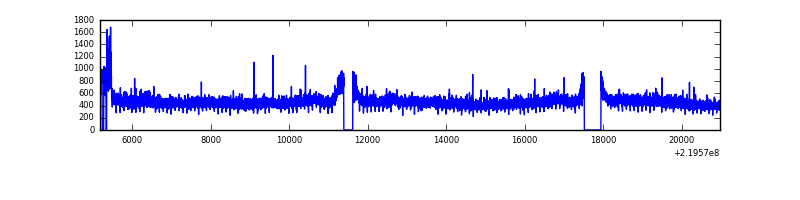 |
| B | 15799 | 15093 | 36 | 36 | 0.23% | 0.24% | 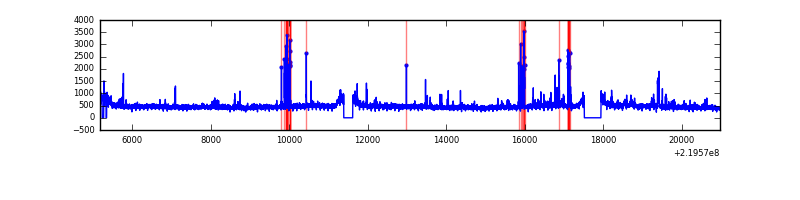 |
| C | 15799 | 15093 | 0 | 0 | 0.00% | 0.00% | 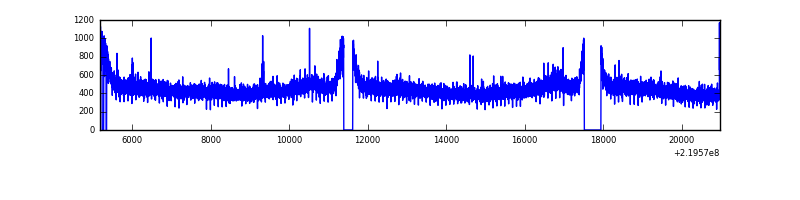 |
| D | 15799 | 15093 | 549 | 549 | 3.47% | 3.64% | 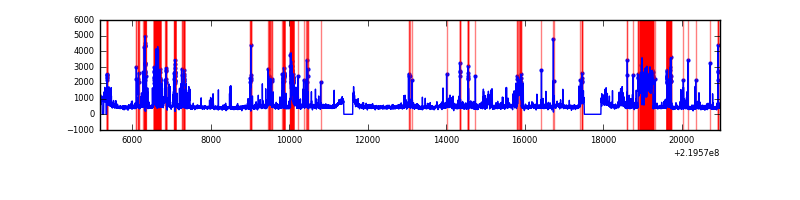 |
Top three noisy pixels from each quadrant. If the there are fewer than three noisy pixels in the level2.evt file, extra rows are filled as -1
| Pixel properties | Quadrant properties | ||||||
|---|---|---|---|---|---|---|---|
| Quadrant | DetID | PixID | Counts | Sigma | Mean | Median | Sigma |
| A | 8 | 15 | 100618 | 273.01 | 1764 | 1718 | 362.3 |
| A | 14 | 111 | 74767 | 201.65 | 1764 | 1718 | 362.3 |
| A | 3 | 1 | 22167 | 56.45 | 1764 | 1718 | 362.3 |
| B | 0 | 219 | 192717 | 555.34 | 1775 | 1726 | 343.9 |
| B | 4 | 81 | 105751 | 302.47 | 1775 | 1726 | 343.9 |
| B | 3 | 220 | 102740 | 293.71 | 1775 | 1726 | 343.9 |
| C | 8 | 128 | 17822 | 40.04 | 1724 | 1728 | 401.9 |
| C | 1 | 16 | 16171 | 35.93 | 1724 | 1728 | 401.9 |
| C | 13 | 61 | 13378 | 28.98 | 1724 | 1728 | 401.9 |
| D | 2 | 63 | 1252645 | 2991.57 | 1699 | 1645 | 418.2 |
| D | 2 | 33 | 1069581 | 2553.8 | 1699 | 1645 | 418.2 |
| D | 2 | 152 | 330150 | 785.57 | 1699 | 1645 | 418.2 |
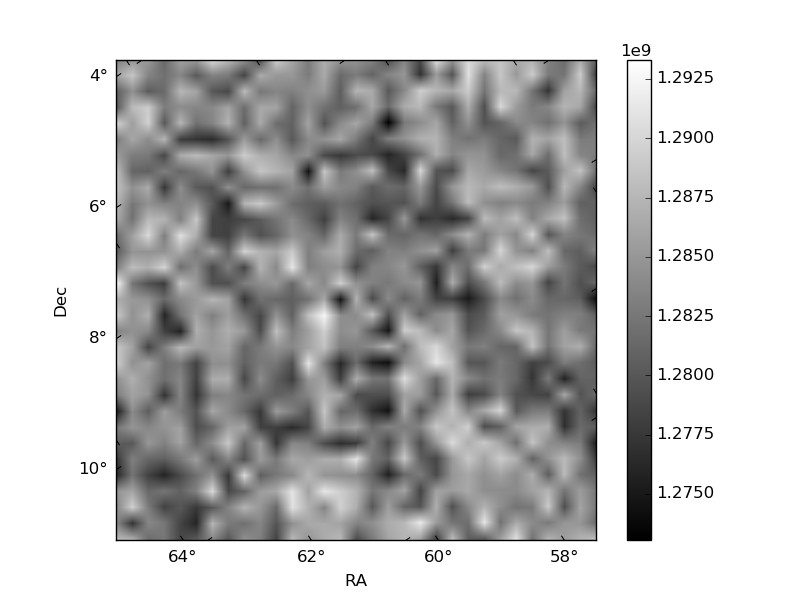
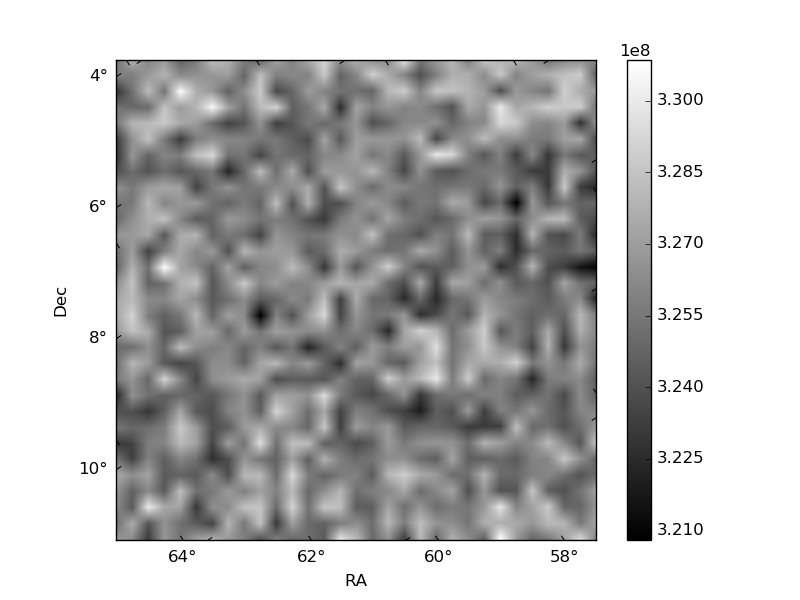
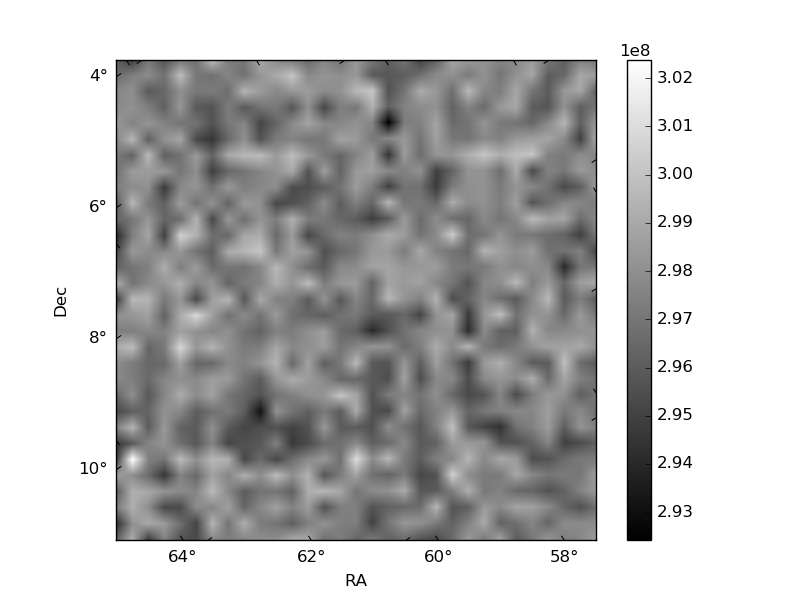
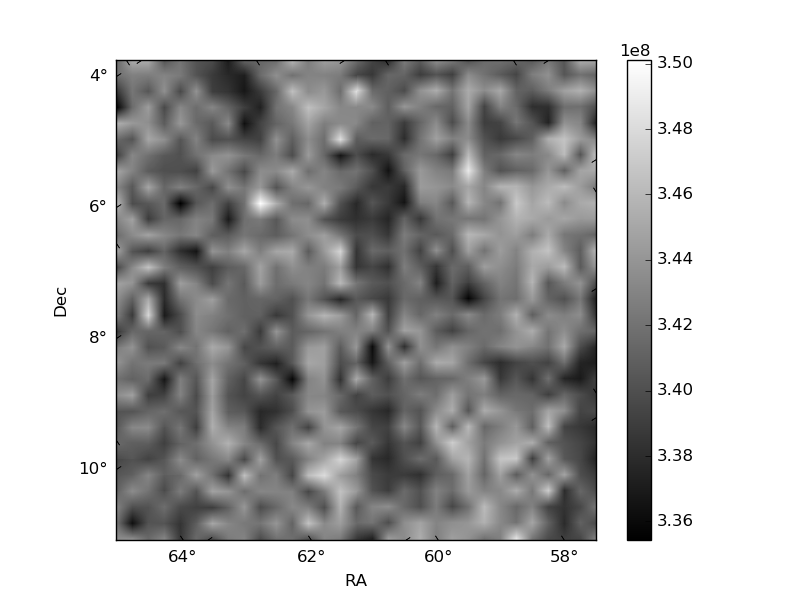
Histogram calculated using DETX and DETY for each event in the final _common_clean file
| Quadrant A | 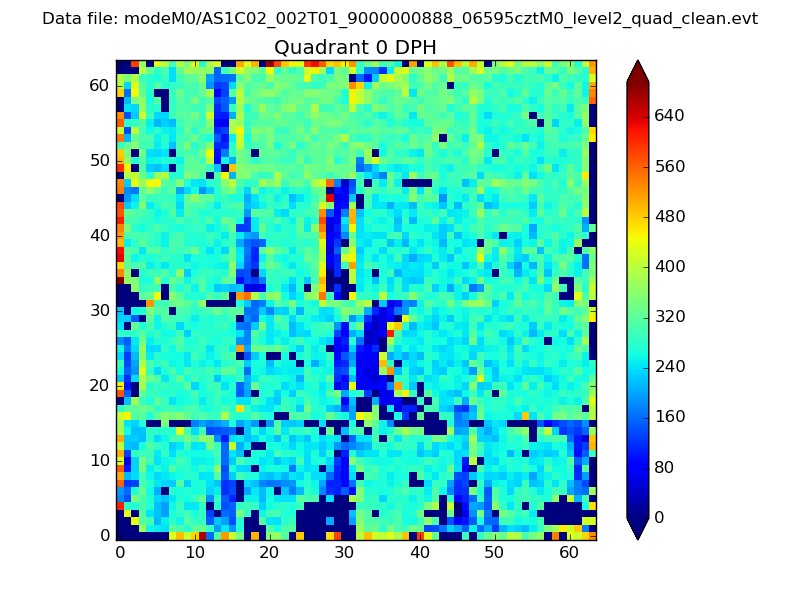 |
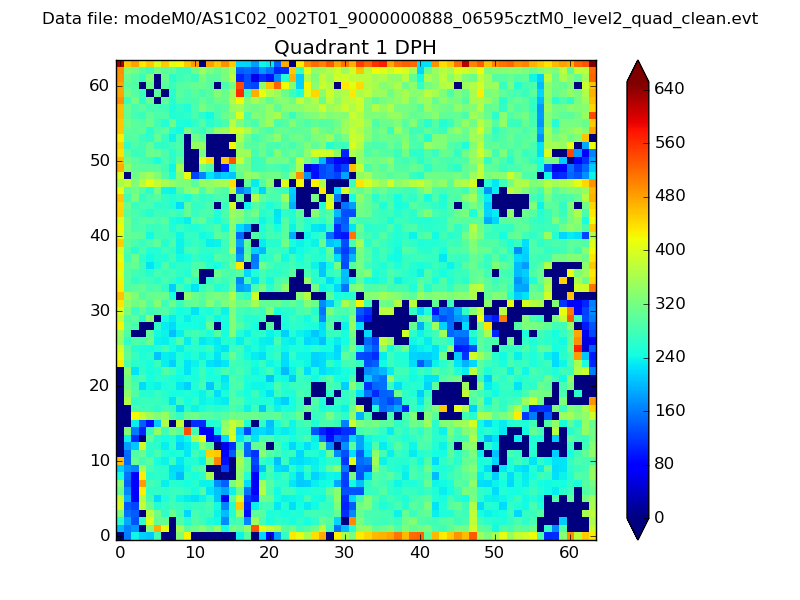 |
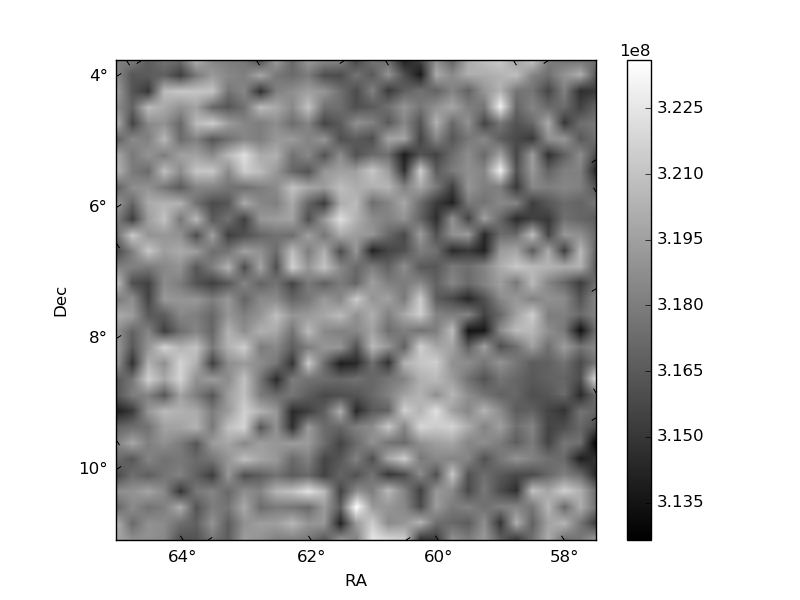
Quadrant B |
|---|---|---|---|
| Quadrant D | 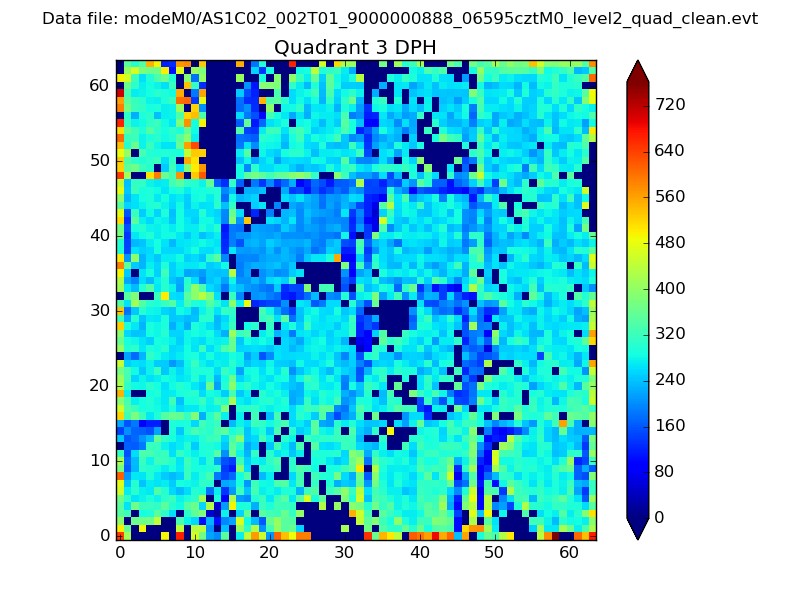 |
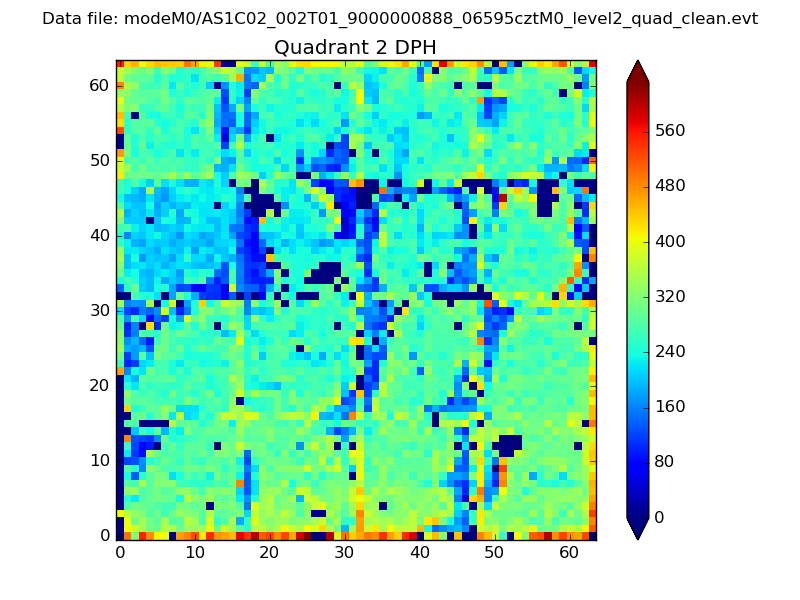 |
Quadrant C |
| Plot type | Count rate plots | Images |
|---|---|---|
| Comparison with Poisson distribution Blue bars denote a histogram of data divided into 1 sec bins. Red curve is a Poisson curve with rate = median count rate of data. |
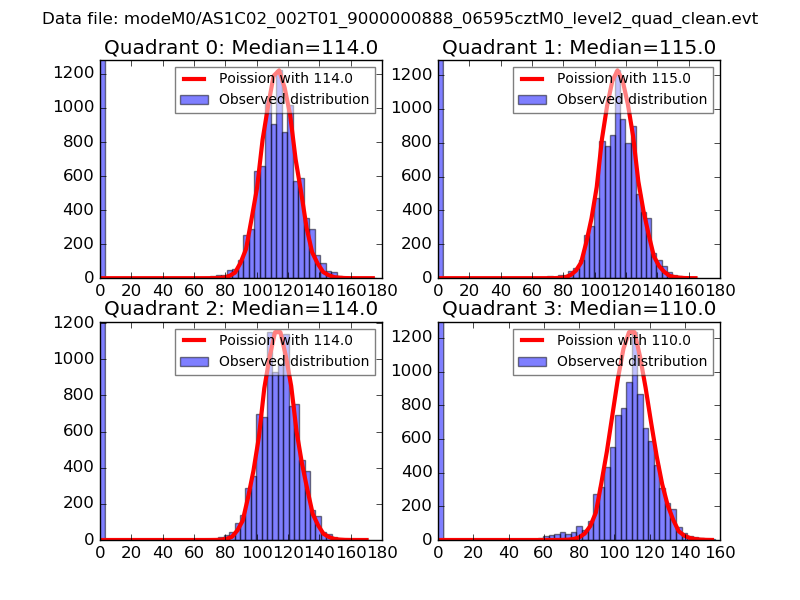 |
 |
| Quadrant-wise count rates Data is divided into 100 sec bins |
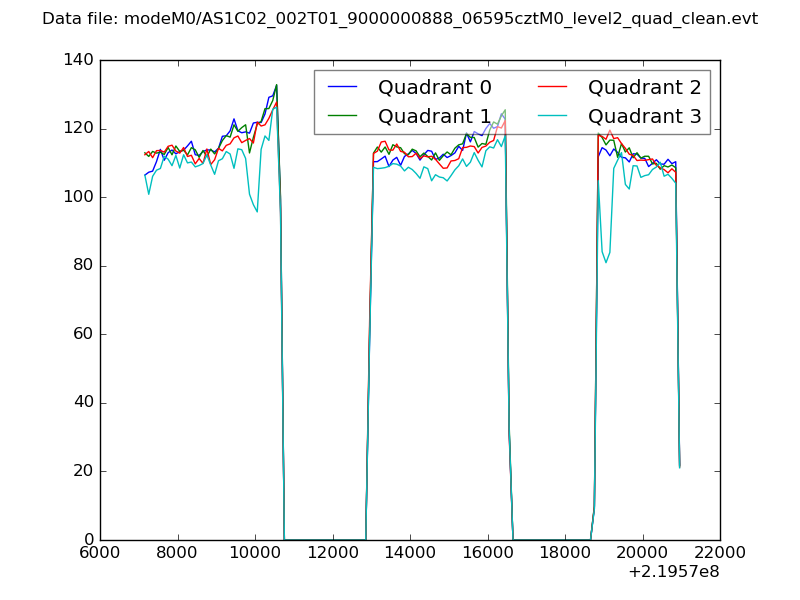 |
|
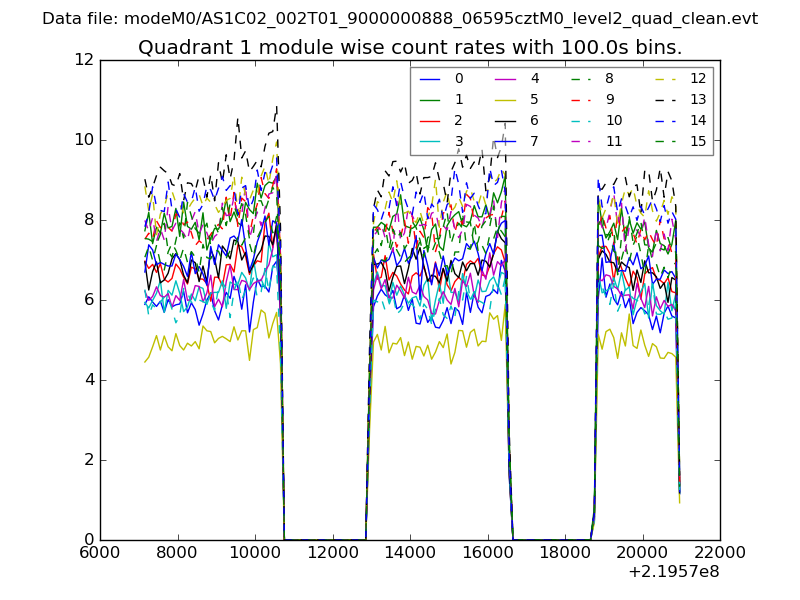
| Module-wise count rates for Quadrant A Data is divided into 100 sec bins |
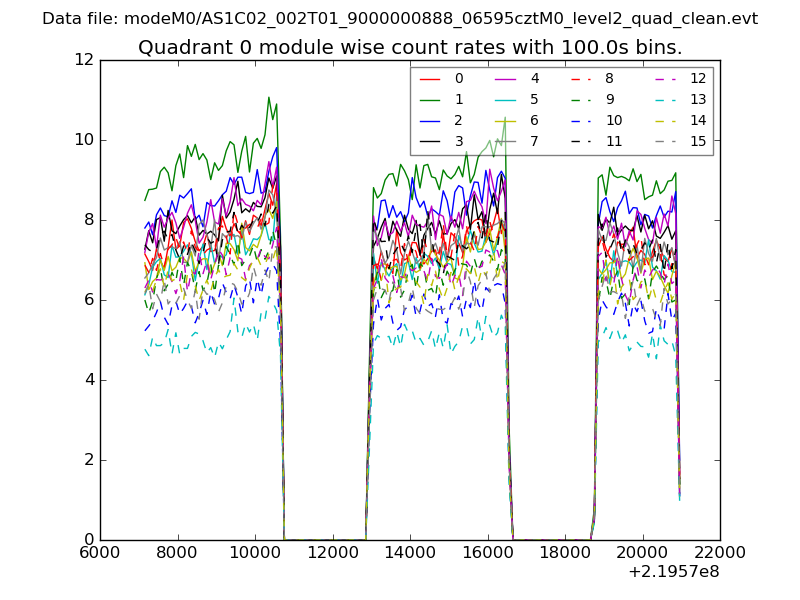 |
 |
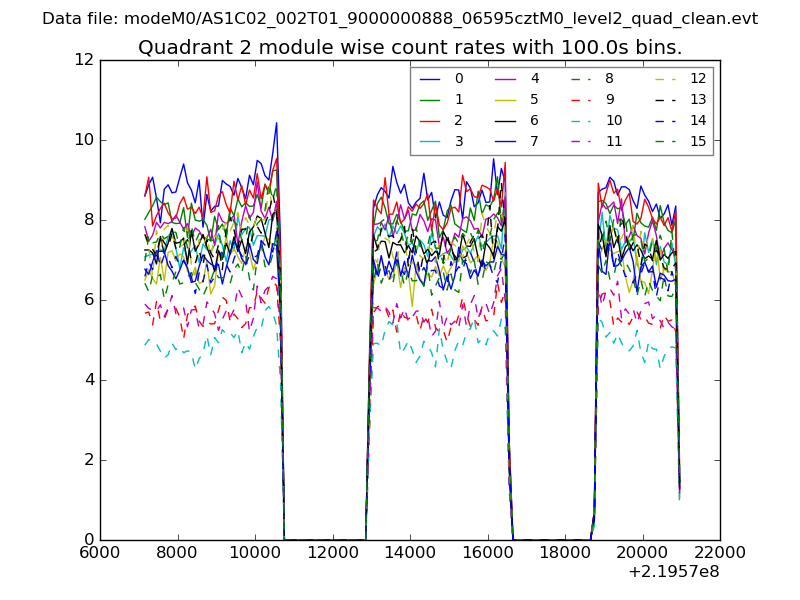
| Module-wise count rates for Quadrant B Data is divided into 100 sec bins |
 |
 |
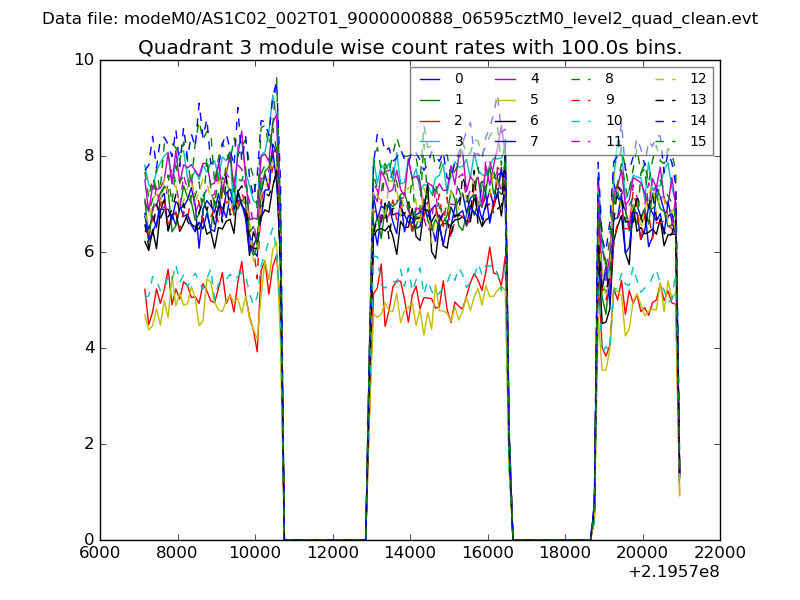
| Module-wise count rates for Quadrant C Data is divided into 100 sec bins |
 |
 |
| Module-wise count rates for Quadrant D Data is divided into 100 sec bins |
 |
 |
| Parameter | Plot |
|---|---|
| CZT HV Monitor | 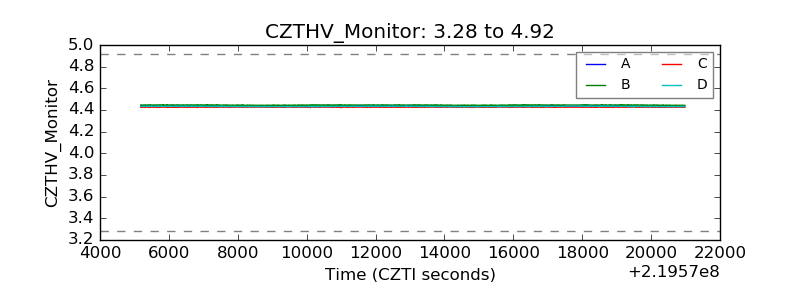 |
| D_VDD | 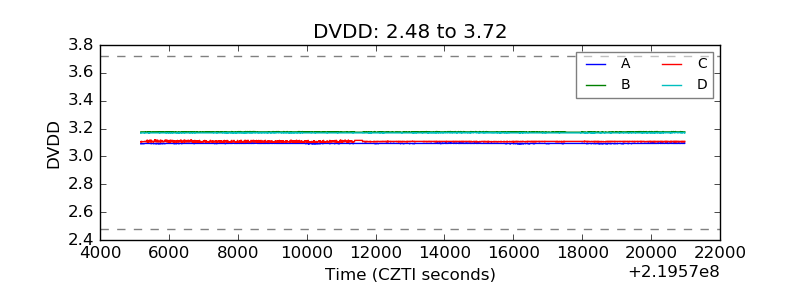 |
| Temperature 1 | 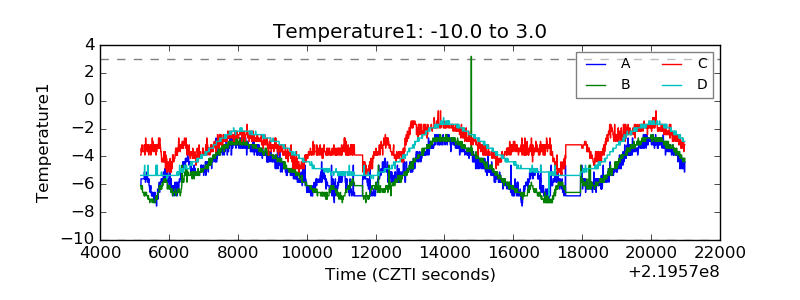 |
| Veto HV Monitor | 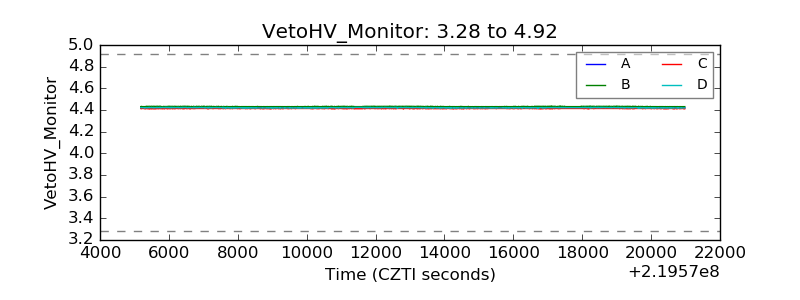 |
| Veto LLD | 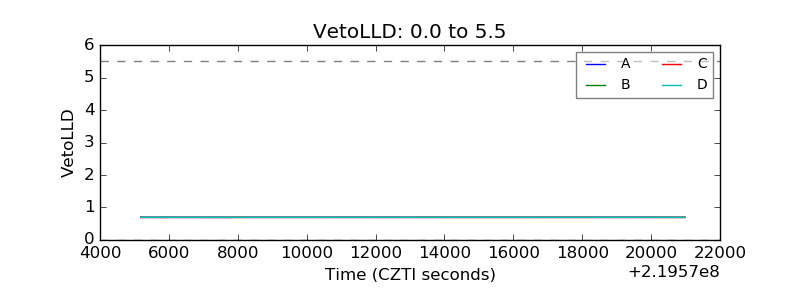 |
| Alpha Counter | 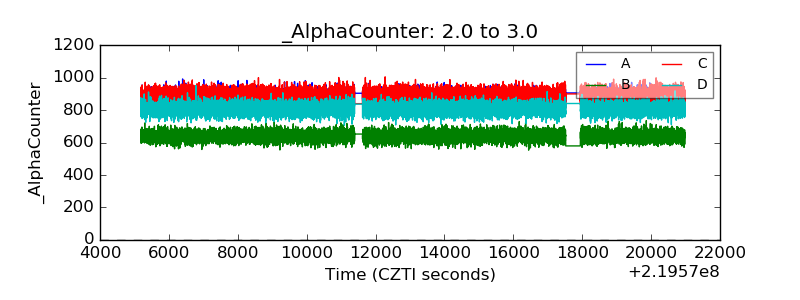 |
| _CPM_Rate | 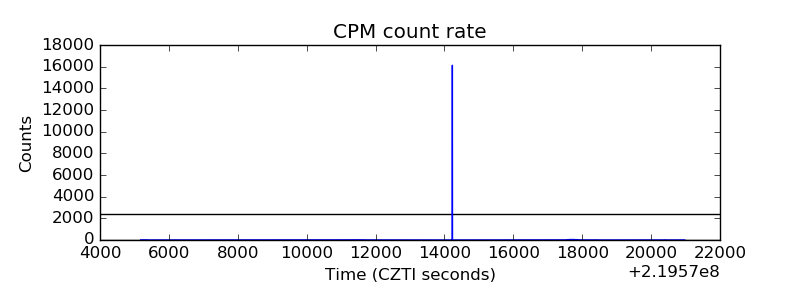 |
| CZT Counter | 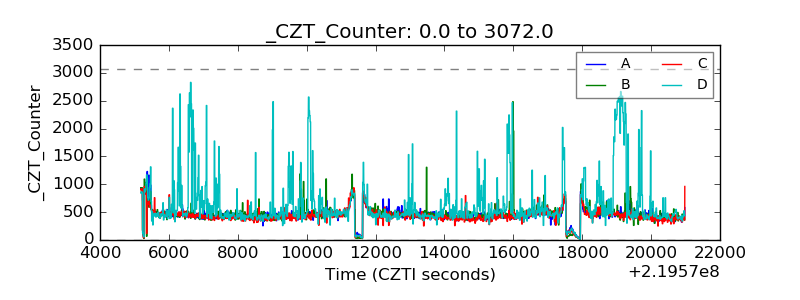 |
| +2.5 Volts monitor | 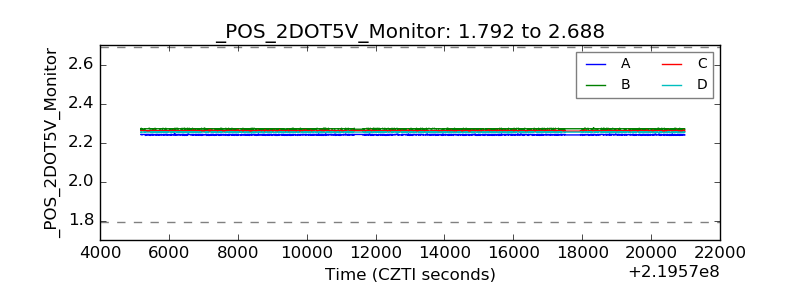 |
| +5 Volts monitor |  |
| _ROLL_ROT | 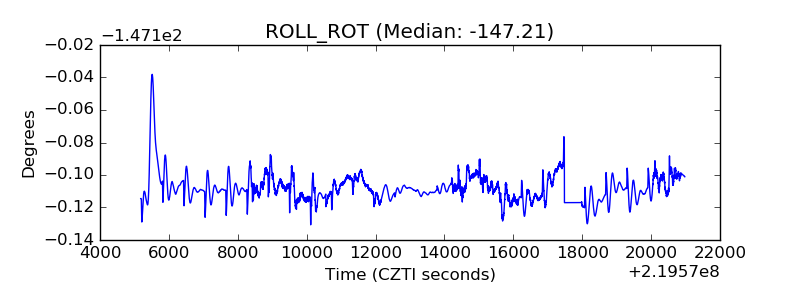 |
| _Roll_DEC | 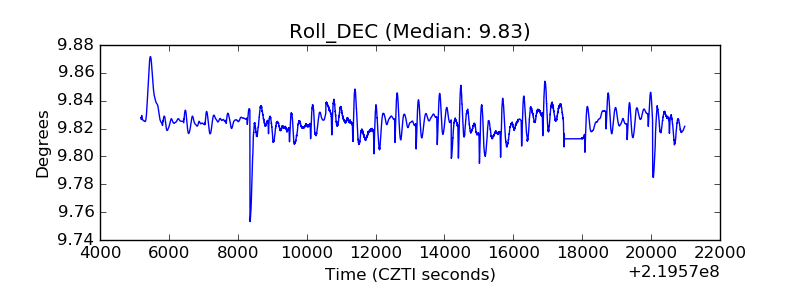 |
| _Roll_RA | 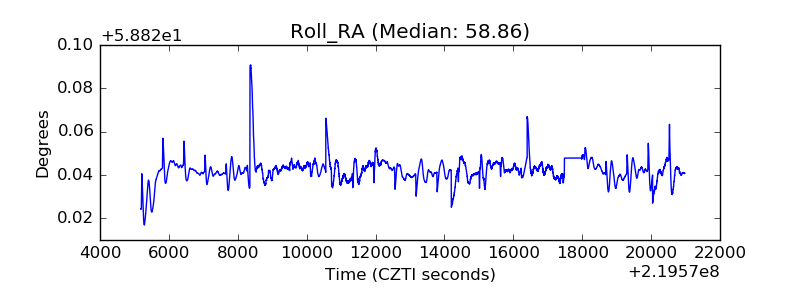 |
| Veto Counter | 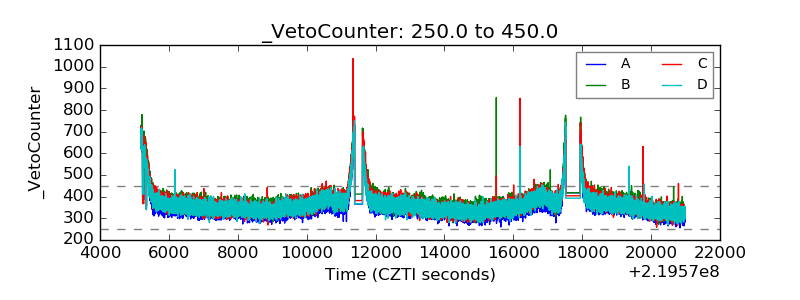 |