| Param | Original file | Final file |
|---|---|---|
| Filename | modeM0/AS1G06_028T01_9000000890cztM0_level2.fits | modeM0/AS1G06_028T01_9000000890cztM0_level2_quad_clean.evt |
| Size (bytes) | 323,853,120 | 297,282,240 |
| Size | 308.9 MB | 283.5 MB |
| Events in quadrant A | 1,967,754 | 1,754,929 |
| Events in quadrant B | 1,913,272 | 1,750,666 |
| Events in quadrant C | 1,941,350 | 1,674,296 |
| Events in quadrant D | 1,648,430 | 1,485,734 |
| Mode M0 | |||
|---|---|---|---|
| Quadrant | BADHDUFLAG | Total packets | Discarded packets |
| A | 0 | 69952 | 0 |
| B | 0 | 74291 | 0 |
| C | 0 | 73980 | 0 |
| D | 0 | 92241 | 0 |
| Mode M9 | |||
|---|---|---|---|
| Quadrant | BADHDUFLAG | Total packets | Discarded packets |
| A | 0 | 76 | 0 |
| B | 0 | 76 | 0 |
| C | 0 | 76 | 0 |
| D | 0 | 76 | 0 |
| Mode SS | |||
|---|---|---|---|
| Quadrant | BADHDUFLAG | Total packets | Discarded packets |
| A | 0 | 692 | 0 |
| B | 0 | 692 | 0 |
| C | 0 | 692 | 0 |
| D | 0 | 692 | 0 |
| Quadrant | Total seconds | Saturated seconds | Saturation percentage |
|---|---|---|---|
| A | 34026 | 165 | 0.484923% |
| B | 34026 | 508 | 1.492976% |
| C | 34026 | 428 | 1.257862% |
| D | 34026 | 1071 | 3.147593% |
Noise dominated data is calculated using 1-second bins in cleaned event files. If a bin has >2000 counts, and if more than 50% of those come from <1% of pixels, then it is considered to be noise-dominated and hence unusable.
| Quadrant | # 1 sec bins | Bins with >0 counts | Bins with >2000 counts | High rate bins dominated by noise | Noise dominated (total time) | Noise dominated (detector-on time) | Marked lightcurve |
|---|---|---|---|---|---|---|---|
| A | 41541 | 34027 | 0 | 0 | 0.00% | 0.00% |  |
| B | 41541 | 34026 | 0 | 0 | 0.00% | 0.00% |  |
| C | 41541 | 34026 | 0 | 0 | 0.00% | 0.00% |  |
| D | 41541 | 34023 | 0 | 0 | 0.00% | 0.00% |  |
Top three noisy pixels from each quadrant. If the there are fewer than three noisy pixels in the level2.evt file, extra rows are filled as -1
| Pixel properties | Quadrant properties | ||||||
|---|---|---|---|---|---|---|---|
| Quadrant | DetID | PixID | Counts | Sigma | Mean | Median | Sigma |
| A | 14 | 188 | 1996 | 11.54 | 510 | 477 | 131.6 |
| A | 0 | 29 | 1952 | 11.21 | 510 | 477 | 131.6 |
| A | 14 | 204 | 1755 | 9.71 | 510 | 477 | 131.6 |
| B | 2 | 9 | 1606 | 10.95 | 502 | 478 | 103.0 |
| B | 12 | 226 | 1337 | 8.34 | 502 | 478 | 103.0 |
| B | 5 | 128 | 1291 | 7.89 | 502 | 478 | 103.0 |
| C | 1 | 81 | 1562 | 7.93 | 512 | 477 | 136.8 |
| C | 1 | 80 | 1524 | 7.65 | 512 | 477 | 136.8 |
| C | 12 | 241 | 1394 | 6.7 | 512 | 477 | 136.8 |
| D | 4 | 246 | 1364 | 7.37 | 469 | 426 | 127.2 |
| D | 3 | 14 | 1260 | 6.56 | 469 | 426 | 127.2 |
| D | 11 | 82 | 1209 | 6.16 | 469 | 426 | 127.2 |
Histogram calculated using DETX and DETY for each event in the final _common_clean file
| Quadrant A |  |
 |
Quadrant B |
|---|---|---|---|
| Quadrant D | 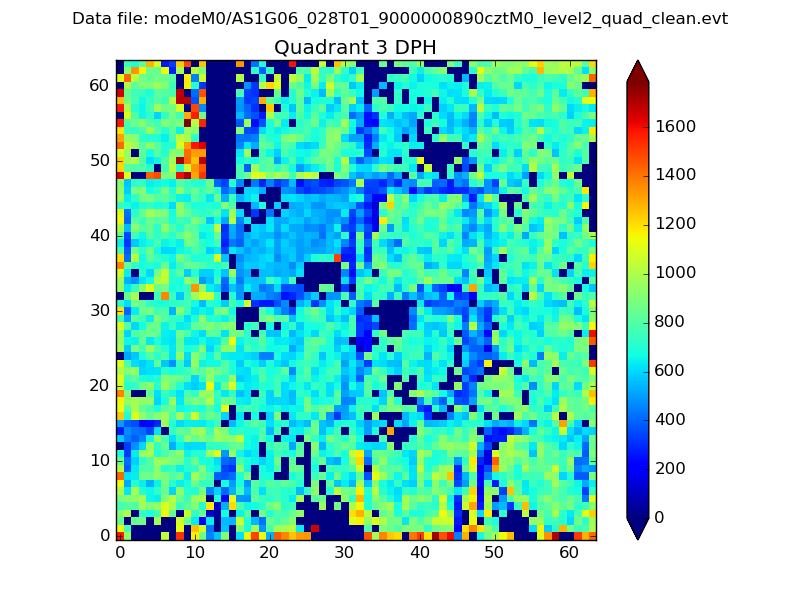 |
 |
Quadrant C |
| Plot type | Count rate plots | Images |
|---|---|---|
| Comparison with Poisson distribution Blue bars denote a histogram of data divided into 1 sec bins. Red curve is a Poisson curve with rate = median count rate of data. |
 |
 |
| Quadrant-wise count rates Data is divided into 100 sec bins |
 |
|
| Module-wise count rates for Quadrant A Data is divided into 100 sec bins |
 |
 |
| Module-wise count rates for Quadrant B Data is divided into 100 sec bins |
 |
 |
| Module-wise count rates for Quadrant C Data is divided into 100 sec bins |
 |
 |
| Module-wise count rates for Quadrant D Data is divided into 100 sec bins |
 |
 |
| Parameter | Plot |
|---|---|
| CZT HV Monitor | 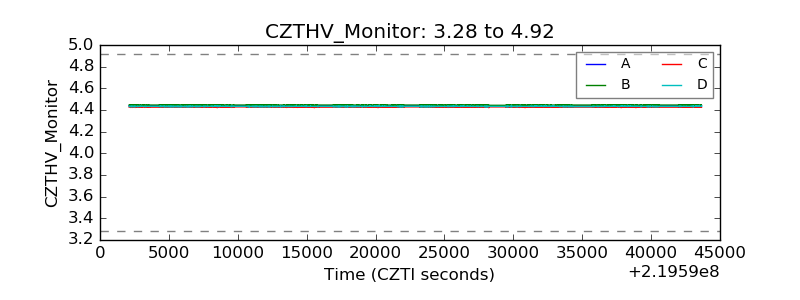 |
| D_VDD |  |
| Temperature 1 |  |
| Veto HV Monitor | 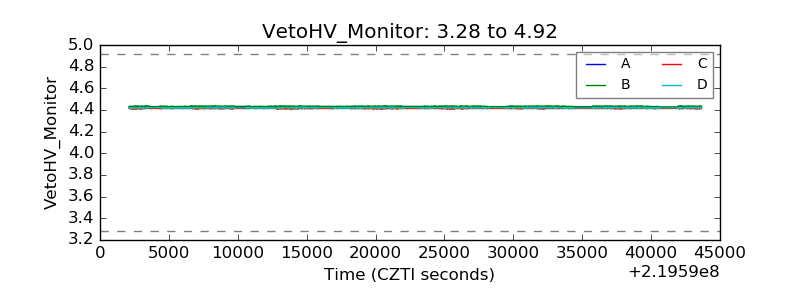 |
| Veto LLD |  |
| Alpha Counter |  |
| _CPM_Rate |  |
| CZT Counter | 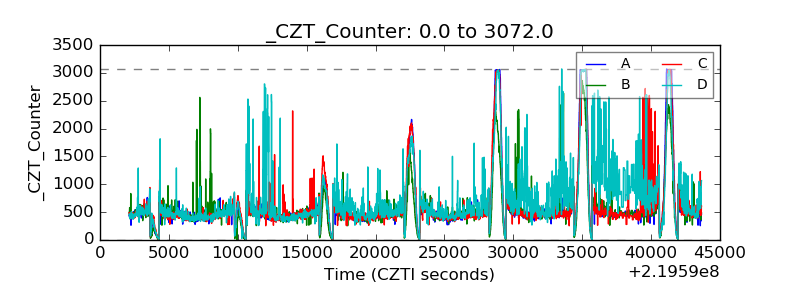 |
| +2.5 Volts monitor |  |
| +5 Volts monitor |  |
| _ROLL_ROT |  |
| _Roll_DEC |  |
| _Roll_RA |  |
| Veto Counter |  |