| Param | Original file | Final file |
|---|---|---|
| Filename | modeM0/AS1G06_028T01_9000000890_06595cztM0_level2.evt | modeM0/AS1G06_028T01_9000000890_06595cztM0_level2_quad_clean.evt |
| Size (bytes) | 949,060,800 | 195,007,680 |
| Size | 905.1 MB | 186.0 MB |
| Events in quadrant A | 6,440,210 | 1,261,623 |
| Events in quadrant B | 6,952,512 | 1,275,513 |
| Events in quadrant C | 6,692,858 | 1,249,984 |
| Events in quadrant D | 7,728,074 | 1,171,703 |
| Mode M0 | |||
|---|---|---|---|
| Quadrant | BADHDUFLAG | Total packets | Discarded packets |
| A | 0 | 28017 | 3 |
| B | 0 | 29357 | 2 |
| C | 0 | 29043 | 2 |
| D | 0 | 32303 | 2 |
| Mode M9 | |||
|---|---|---|---|
| Quadrant | BADHDUFLAG | Total packets | Discarded packets |
| A | 0 | 24 | 0 |
| B | 0 | 24 | 0 |
| C | 0 | 24 | 0 |
| D | 0 | 24 | 0 |
| Mode SS | |||
|---|---|---|---|
| Quadrant | BADHDUFLAG | Total packets | Discarded packets |
| A | 0 | 282 | 0 |
| B | 0 | 282 | 0 |
| C | 0 | 282 | 0 |
| D | 0 | 282 | 0 |
| Quadrant | Total seconds | Saturated seconds | Saturation percentage |
|---|---|---|---|
| A | 13715 | 44 | 0.320817% |
| B | 13715 | 133 | 0.969741% |
| C | 13715 | 67 | 0.488516% |
| D | 13715 | 414 | 3.018593% |
Noise dominated data is calculated using 1-second bins in cleaned event files. If a bin has >2000 counts, and if more than 50% of those come from <1% of pixels, then it is considered to be noise-dominated and hence unusable.
| Quadrant | # 1 sec bins | Bins with >0 counts | Bins with >2000 counts | High rate bins dominated by noise | Noise dominated (total time) | Noise dominated (detector-on time) | Marked lightcurve |
|---|---|---|---|---|---|---|---|
| A | 16190 | 13718 | 0 | 0 | 0.00% | 0.00% | 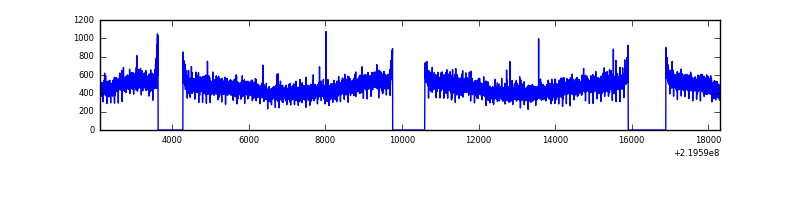 |
| B | 16190 | 13718 | 70 | 70 | 0.43% | 0.51% | 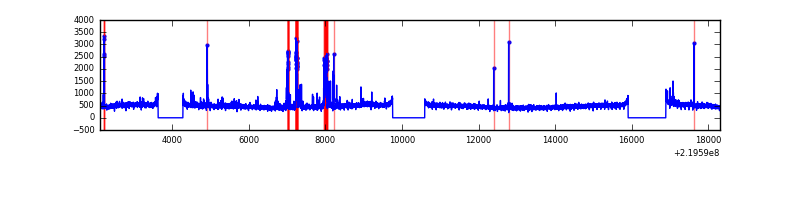 |
| C | 16190 | 13718 | 28 | 28 | 0.17% | 0.20% | 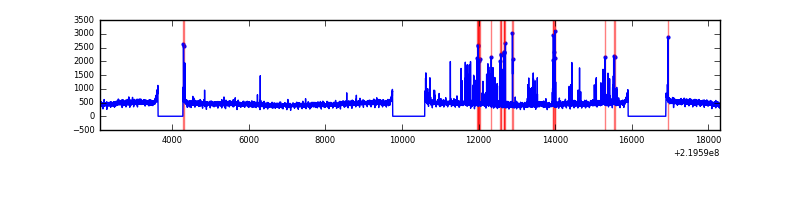 |
| D | 16190 | 13718 | 327 | 327 | 2.02% | 2.38% | 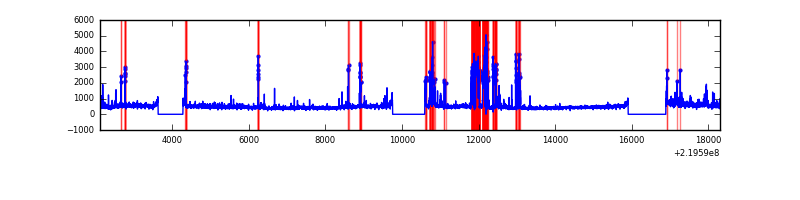 |
Top three noisy pixels from each quadrant. If the there are fewer than three noisy pixels in the level2.evt file, extra rows are filled as -1
| Pixel properties | Quadrant properties | ||||||
|---|---|---|---|---|---|---|---|
| Quadrant | DetID | PixID | Counts | Sigma | Mean | Median | Sigma |
| A | 8 | 15 | 45363 | 129.95 | 1651 | 1620 | 336.6 |
| A | 13 | 14 | 22965 | 63.41 | 1651 | 1620 | 336.6 |
| A | 3 | 1 | 19992 | 54.58 | 1651 | 1620 | 336.6 |
| B | 3 | 220 | 381534 | 1205.97 | 1655 | 1620 | 315.0 |
| B | 4 | 81 | 85248 | 265.46 | 1655 | 1620 | 315.0 |
| B | 4 | 48 | 34282 | 103.68 | 1655 | 1620 | 315.0 |
| C | 9 | 16 | 400029 | 1070.84 | 1604 | 1618 | 372.1 |
| C | 9 | 54 | 34146 | 87.43 | 1604 | 1618 | 372.1 |
| C | 13 | 61 | 12422 | 29.04 | 1604 | 1618 | 372.1 |
| D | 2 | 33 | 1021393 | 2636.79 | 1591 | 1551 | 386.8 |
| D | 8 | 195 | 299982 | 771.59 | 1591 | 1551 | 386.8 |
| D | 2 | 63 | 121711 | 310.67 | 1591 | 1551 | 386.8 |
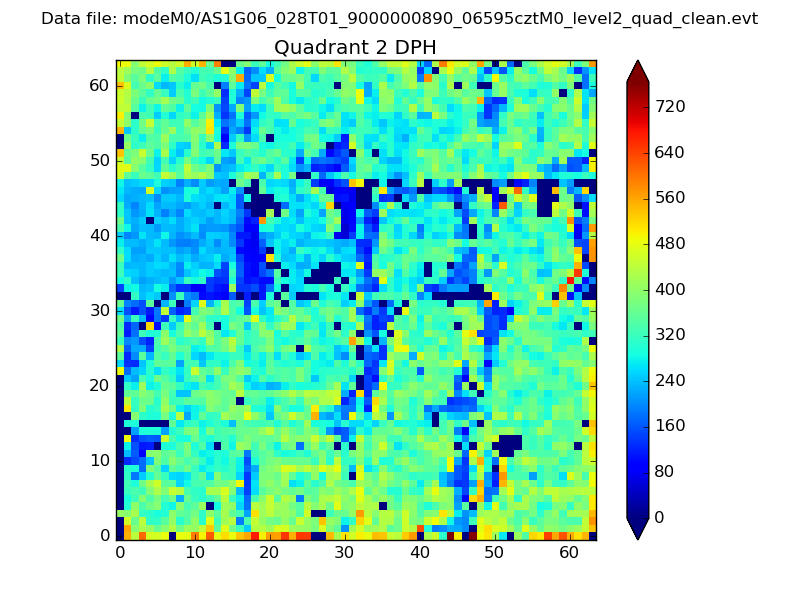
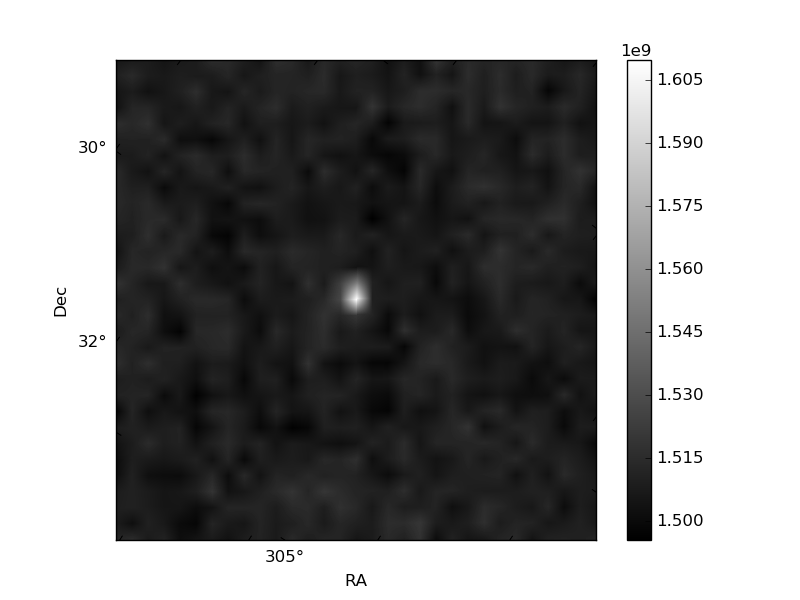
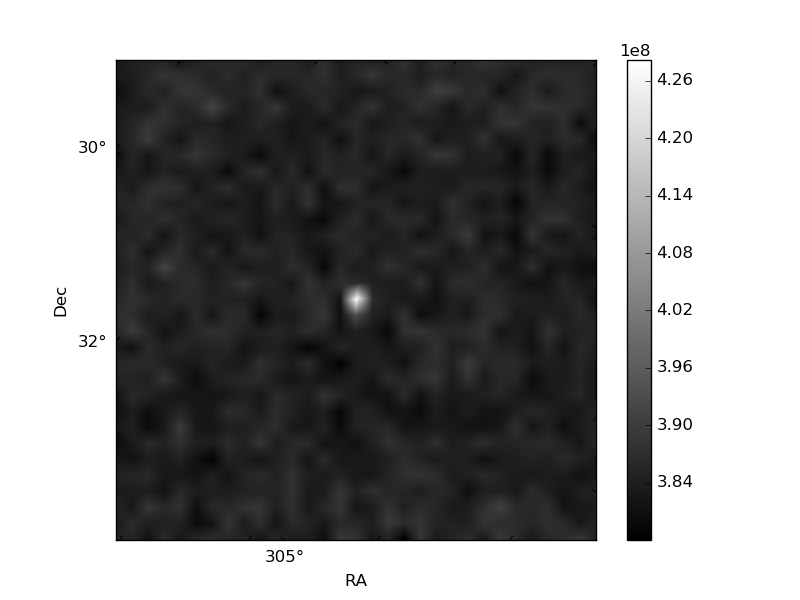
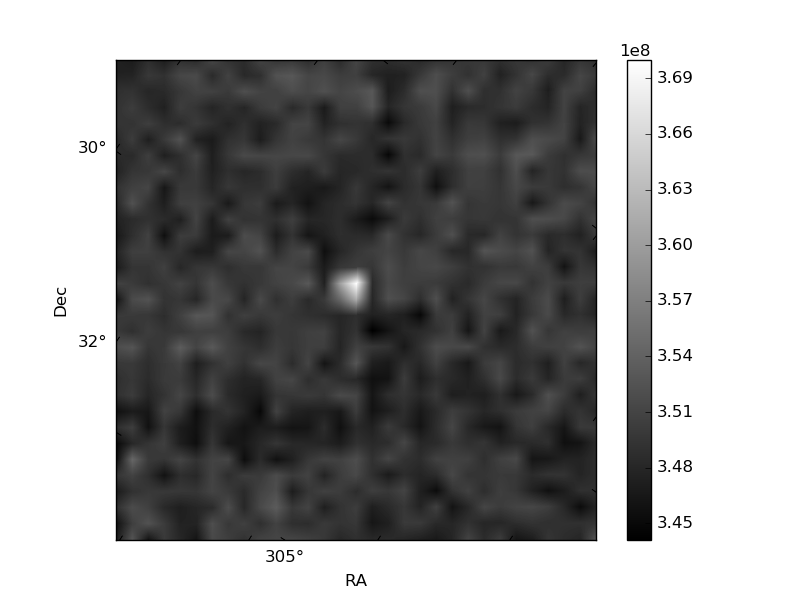
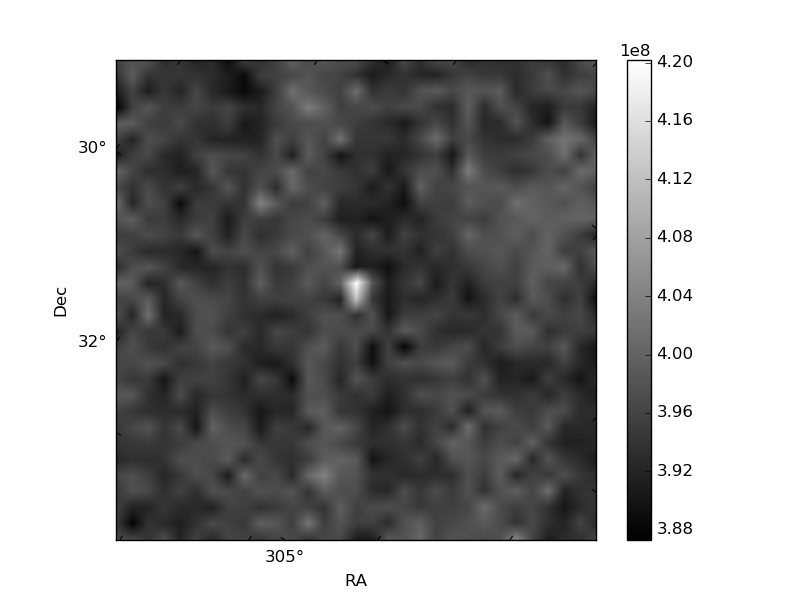
Histogram calculated using DETX and DETY for each event in the final _common_clean file
| Quadrant A | 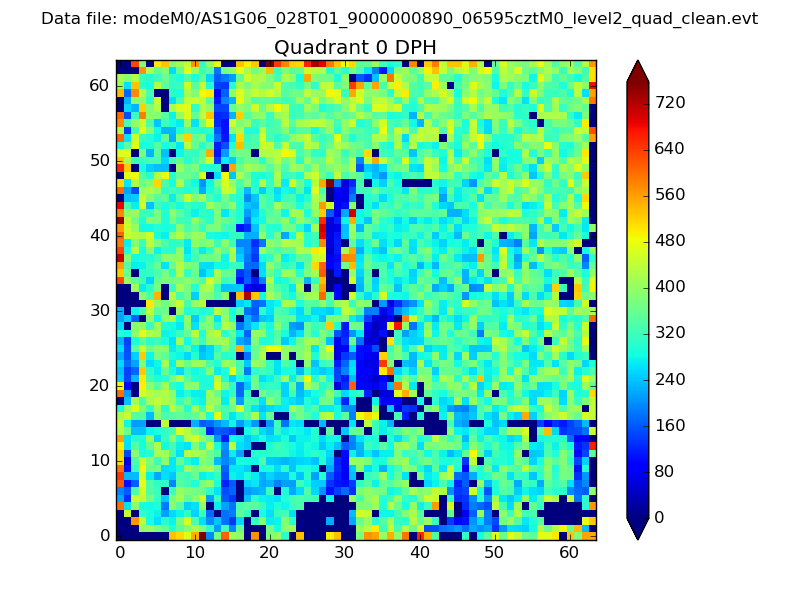 |
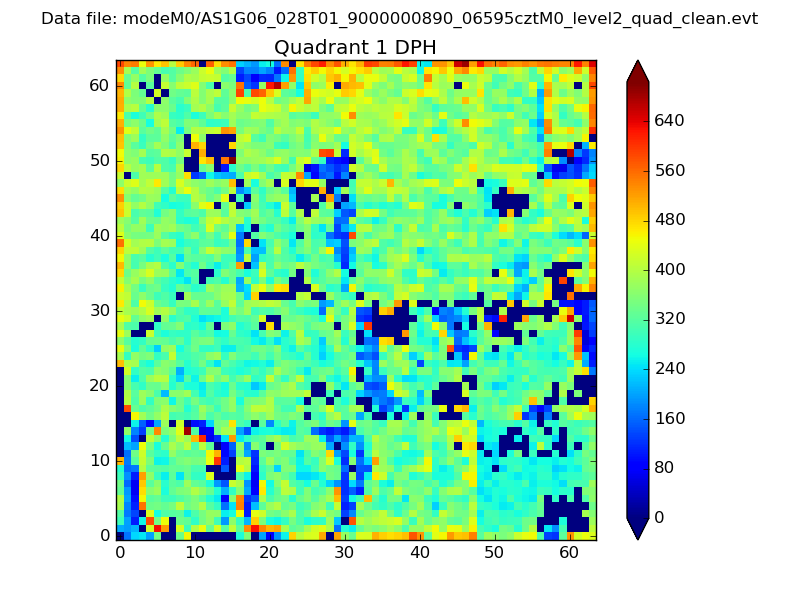 |
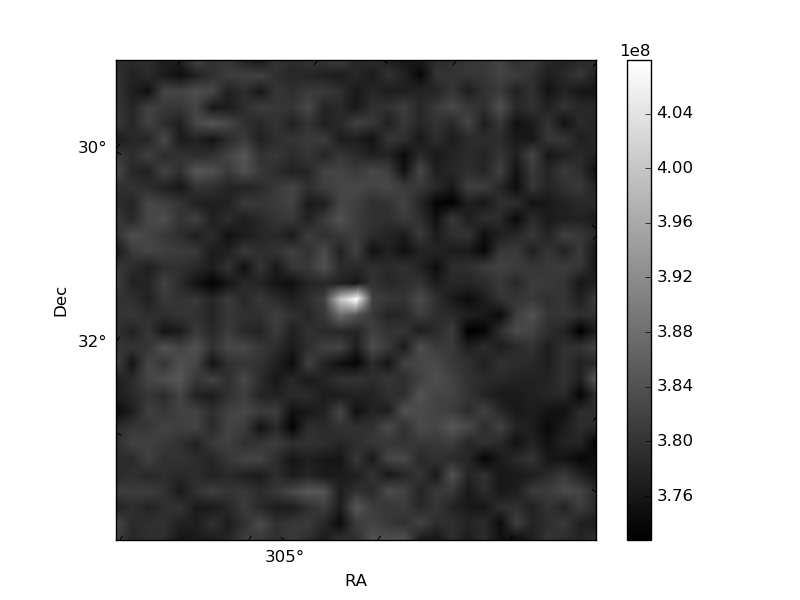
Quadrant B |
|---|---|---|---|
| Quadrant D | 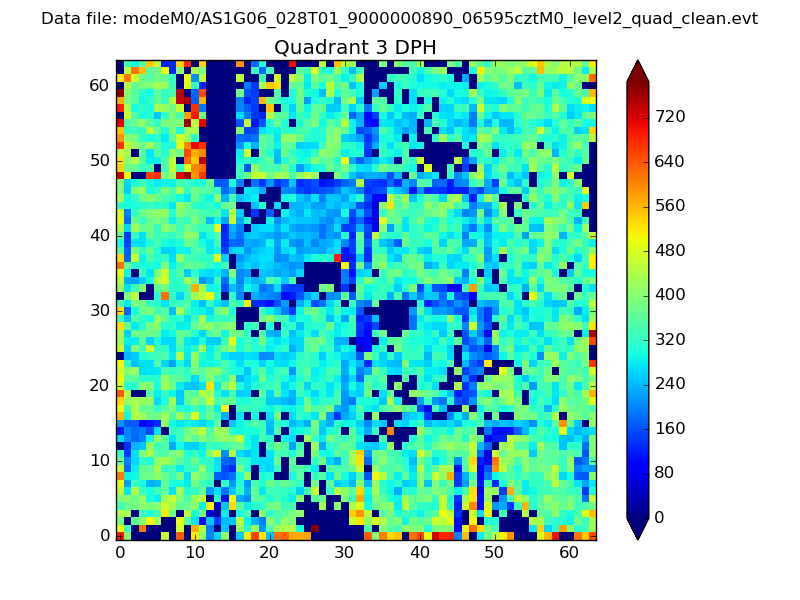 |
 |
Quadrant C |
| Plot type | Count rate plots | Images |
|---|---|---|
| Comparison with Poisson distribution Blue bars denote a histogram of data divided into 1 sec bins. Red curve is a Poisson curve with rate = median count rate of data. |
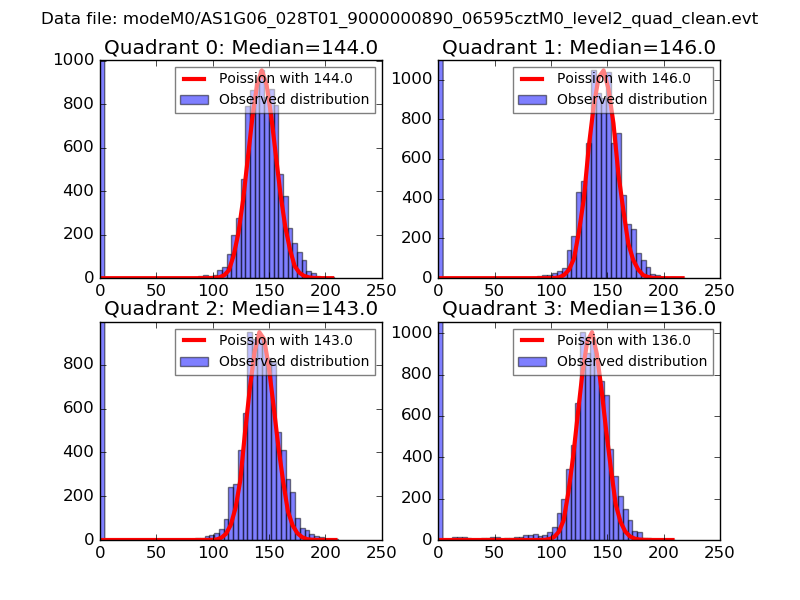 |
 |
| Quadrant-wise count rates Data is divided into 100 sec bins |
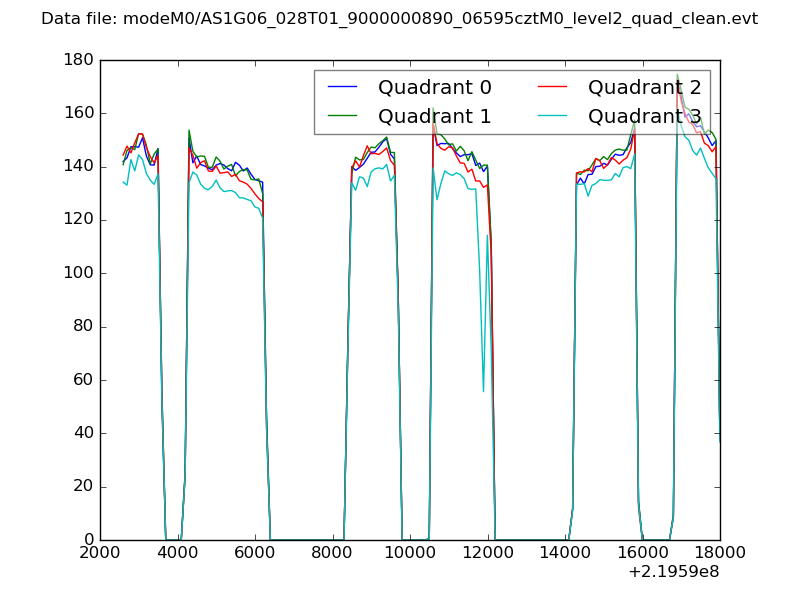 |
|
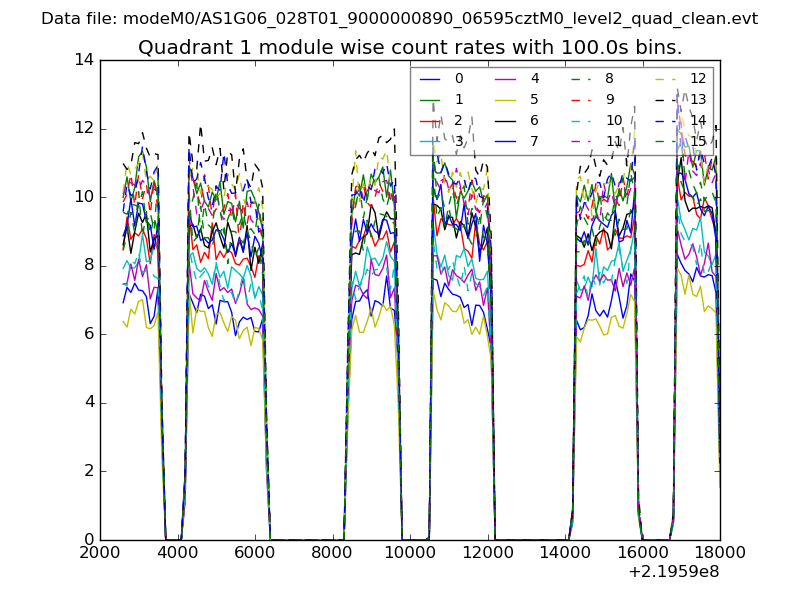
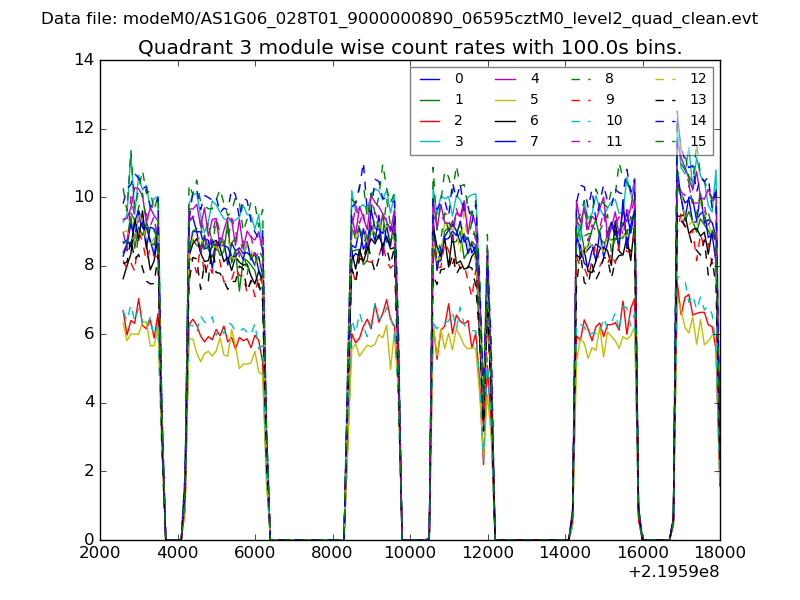
| Module-wise count rates for Quadrant A Data is divided into 100 sec bins |
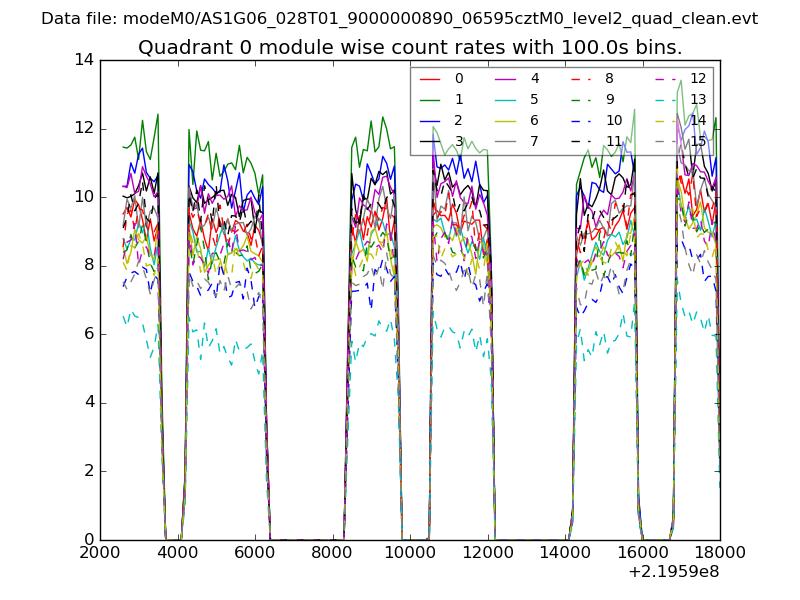 |
 |
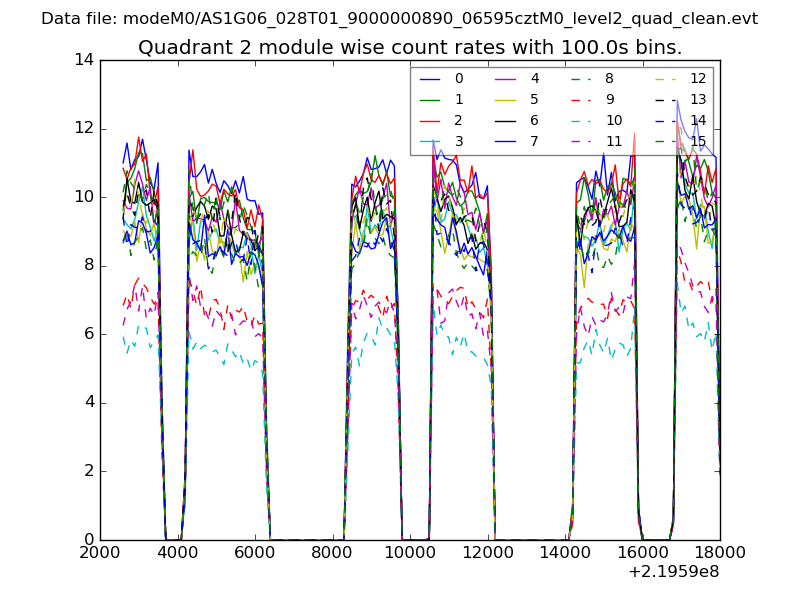
| Module-wise count rates for Quadrant B Data is divided into 100 sec bins |
 |
 |
| Module-wise count rates for Quadrant C Data is divided into 100 sec bins |
 |
 |
| Module-wise count rates for Quadrant D Data is divided into 100 sec bins |
 |
 |
| Parameter | Plot |
|---|---|
| CZT HV Monitor | 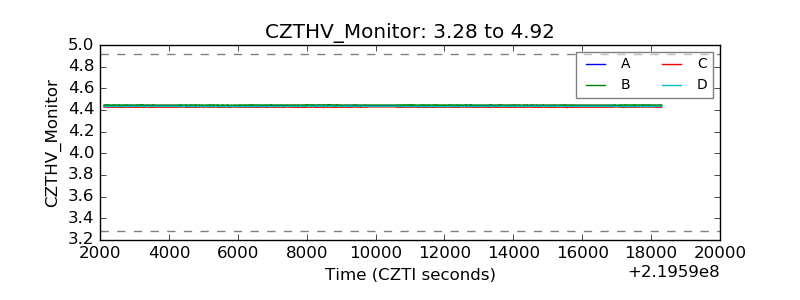 |
| D_VDD | 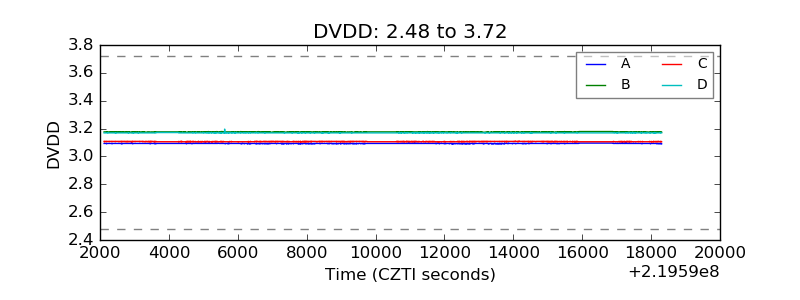 |
| Temperature 1 | 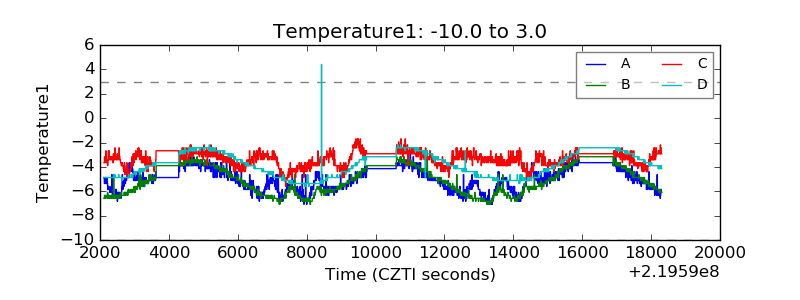 |
| Veto HV Monitor | 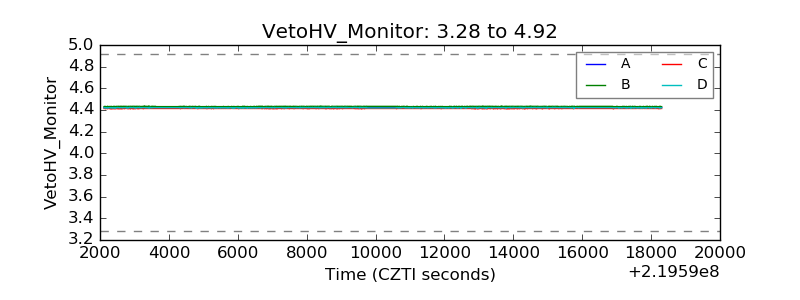 |
| Veto LLD | 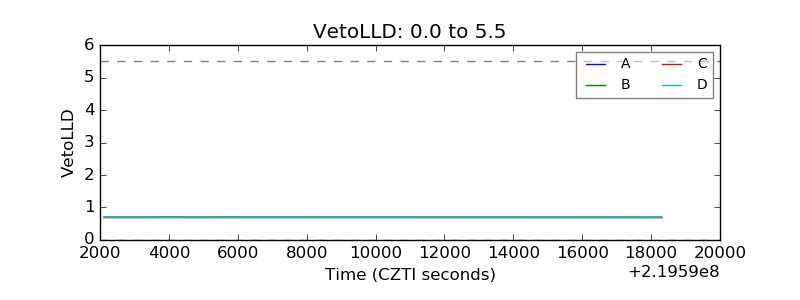 |
| Alpha Counter | 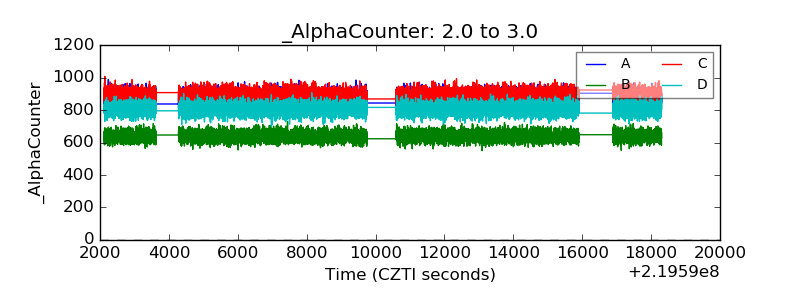 |
| _CPM_Rate | 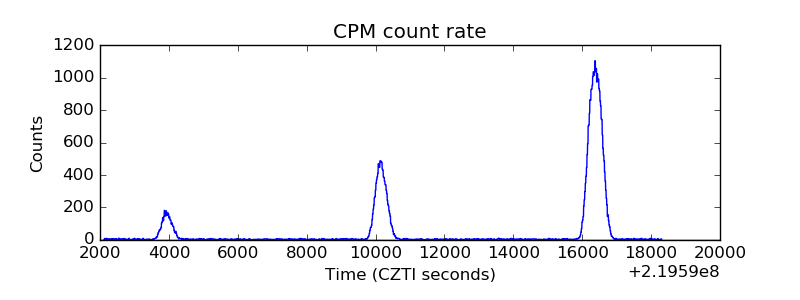 |
| CZT Counter | 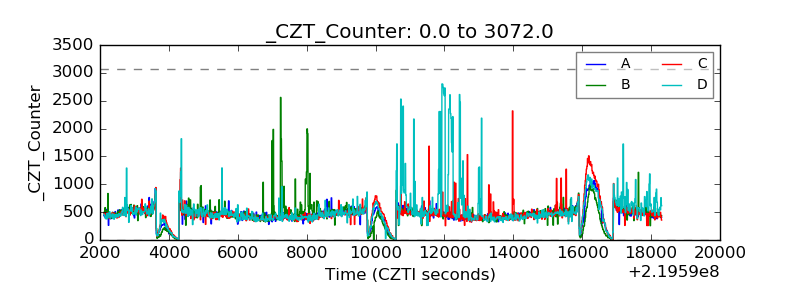 |
| +2.5 Volts monitor |  |
| +5 Volts monitor |  |
| _ROLL_ROT | 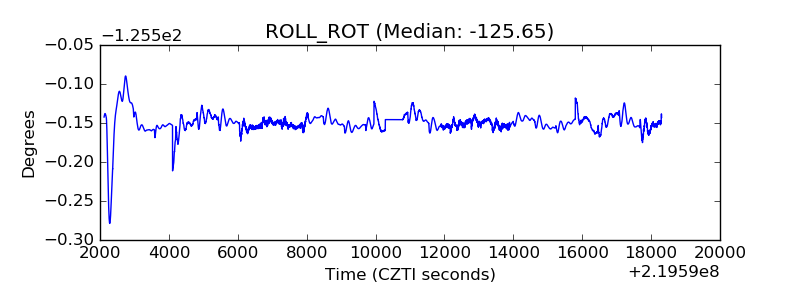 |
| _Roll_DEC | 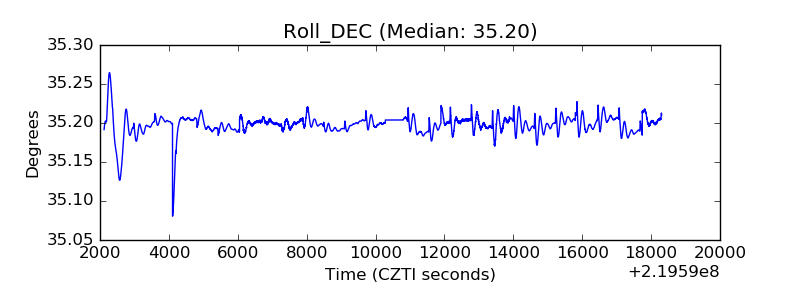 |
| _Roll_RA | 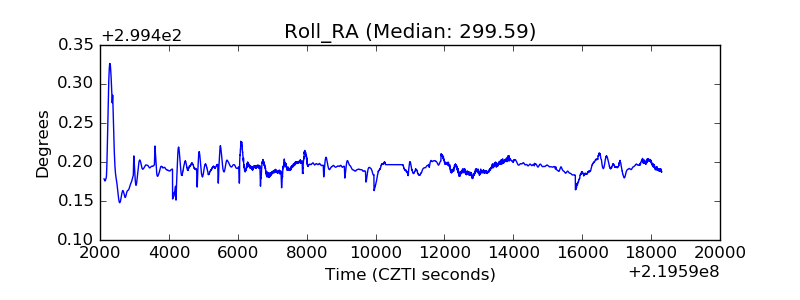 |
| Veto Counter | 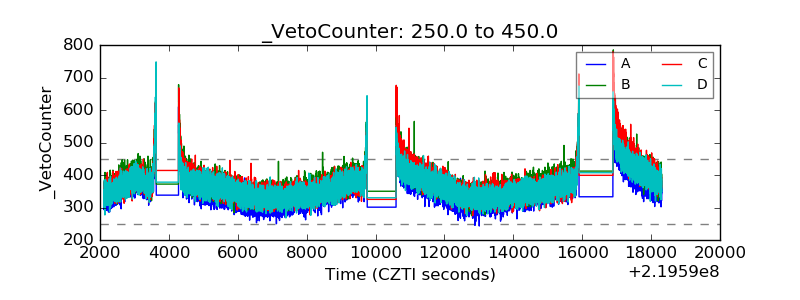 |