| Param | Original file | Final file |
|---|---|---|
| Filename | modeM0/AS1G06_028T01_9000000890_06597cztM0_level2.evt | modeM0/AS1G06_028T01_9000000890_06597cztM0_level2_quad_clean.evt |
| Size (bytes) | 430,168,320 | 84,424,320 |
| Size | 410.2 MB | 80.5 MB |
| Events in quadrant A | 2,960,395 | 534,445 |
| Events in quadrant B | 3,088,970 | 543,307 |
| Events in quadrant C | 2,948,439 | 534,569 |
| Events in quadrant D | 3,601,182 | 504,244 |
| Mode M0 | |||
|---|---|---|---|
| Quadrant | BADHDUFLAG | Total packets | Discarded packets |
| A | 0 | 12928 | 1 |
| B | 0 | 13273 | 0 |
| C | 0 | 12916 | 0 |
| D | 0 | 14842 | 0 |
| Mode M9 | |||
|---|---|---|---|
| Quadrant | BADHDUFLAG | Total packets | Discarded packets |
| A | 0 | 12 | 0 |
| B | 0 | 12 | 0 |
| C | 0 | 12 | 0 |
| D | 0 | 12 | 0 |
| Mode SS | |||
|---|---|---|---|
| Quadrant | BADHDUFLAG | Total packets | Discarded packets |
| A | 0 | 128 | 0 |
| B | 0 | 128 | 0 |
| C | 0 | 128 | 0 |
| D | 0 | 128 | 0 |
| Quadrant | Total seconds | Saturated seconds | Saturation percentage |
|---|---|---|---|
| A | 6305 | 22 | 0.348929% |
| B | 6305 | 30 | 0.475813% |
| C | 6305 | 24 | 0.380650% |
| D | 6305 | 55 | 0.872324% |
Noise dominated data is calculated using 1-second bins in cleaned event files. If a bin has >2000 counts, and if more than 50% of those come from <1% of pixels, then it is considered to be noise-dominated and hence unusable.
| Quadrant | # 1 sec bins | Bins with >0 counts | Bins with >2000 counts | High rate bins dominated by noise | Noise dominated (total time) | Noise dominated (detector-on time) | Marked lightcurve |
|---|---|---|---|---|---|---|---|
| A | 7445 | 6306 | 0 | 0 | 0.00% | 0.00% | 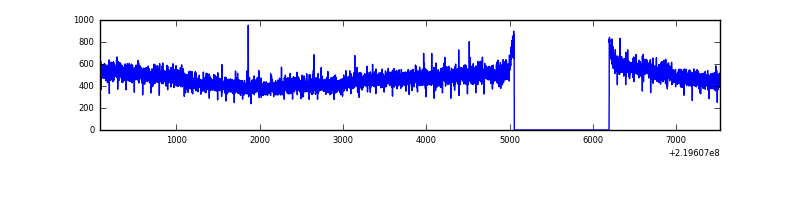 |
| B | 7445 | 6306 | 3 | 3 | 0.04% | 0.05% | 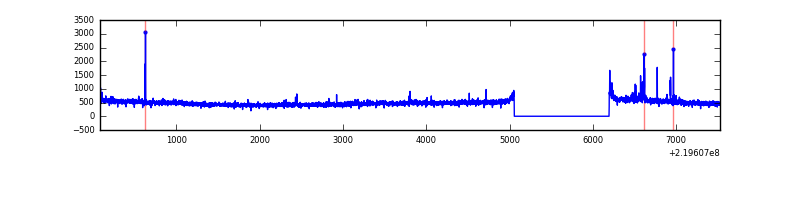 |
| C | 7445 | 6306 | 1 | 1 | 0.01% | 0.02% | 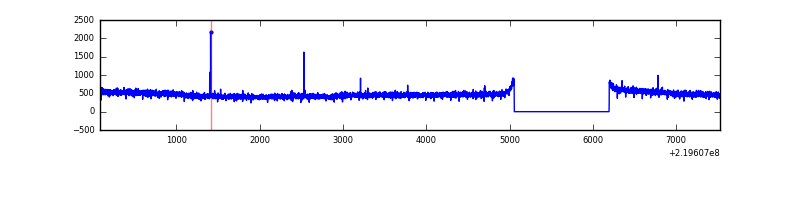 |
| D | 7445 | 6306 | 12 | 12 | 0.16% | 0.19% | 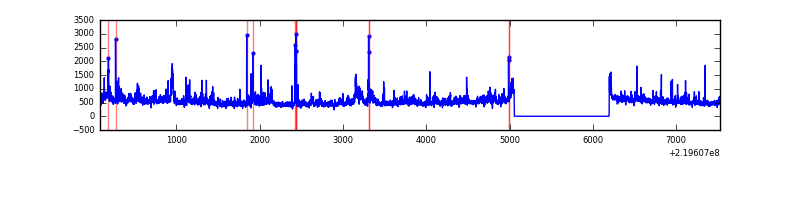 |
Top three noisy pixels from each quadrant. If the there are fewer than three noisy pixels in the level2.evt file, extra rows are filled as -1
| Pixel properties | Quadrant properties | ||||||
|---|---|---|---|---|---|---|---|
| Quadrant | DetID | PixID | Counts | Sigma | Mean | Median | Sigma |
| A | 8 | 15 | 17123 | 103.8 | 764 | 747 | 157.8 |
| A | 0 | 226 | 7273 | 41.36 | 764 | 747 | 157.8 |
| A | 12 | 194 | 7099 | 40.26 | 764 | 747 | 157.8 |
| B | 0 | 219 | 37657 | 251.94 | 770 | 754 | 146.5 |
| B | 4 | 81 | 25877 | 171.52 | 770 | 754 | 146.5 |
| B | 4 | 170 | 15053 | 97.62 | 770 | 754 | 146.5 |
| C | 9 | 54 | 5908 | 29.38 | 752 | 760 | 175.2 |
| C | 13 | 61 | 5733 | 28.39 | 752 | 760 | 175.2 |
| C | 9 | 16 | 4609 | 21.97 | 752 | 760 | 175.2 |
| D | 8 | 195 | 442818 | 2406.28 | 749 | 730 | 183.7 |
| D | 2 | 33 | 111575 | 603.33 | 749 | 730 | 183.7 |
| D | 11 | 241 | 50952 | 273.36 | 749 | 730 | 183.7 |
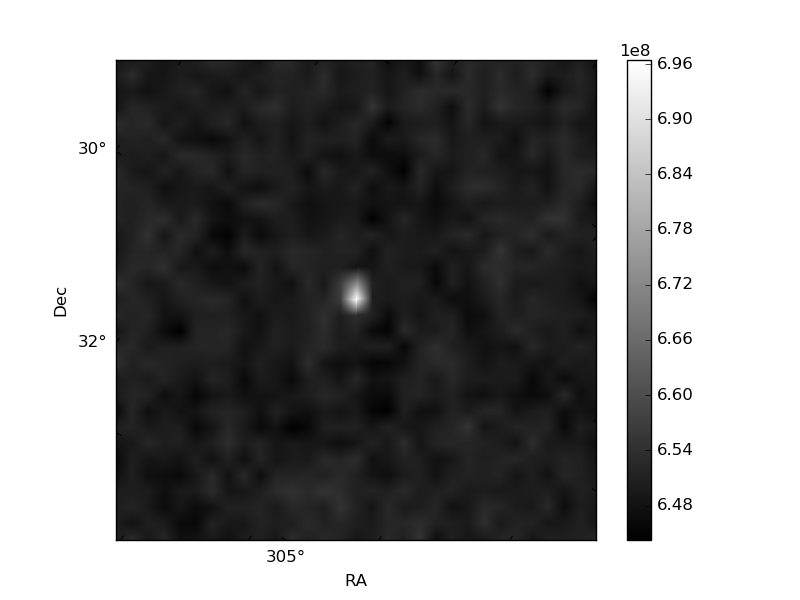
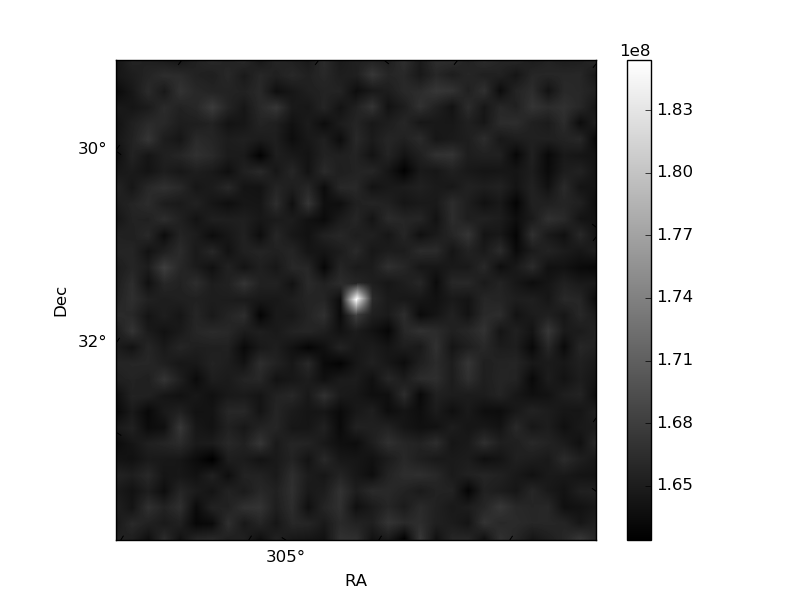
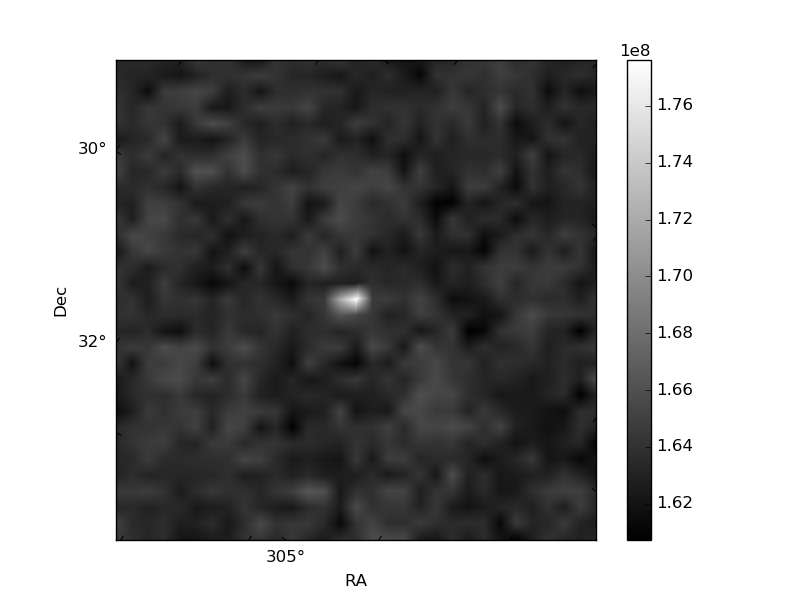
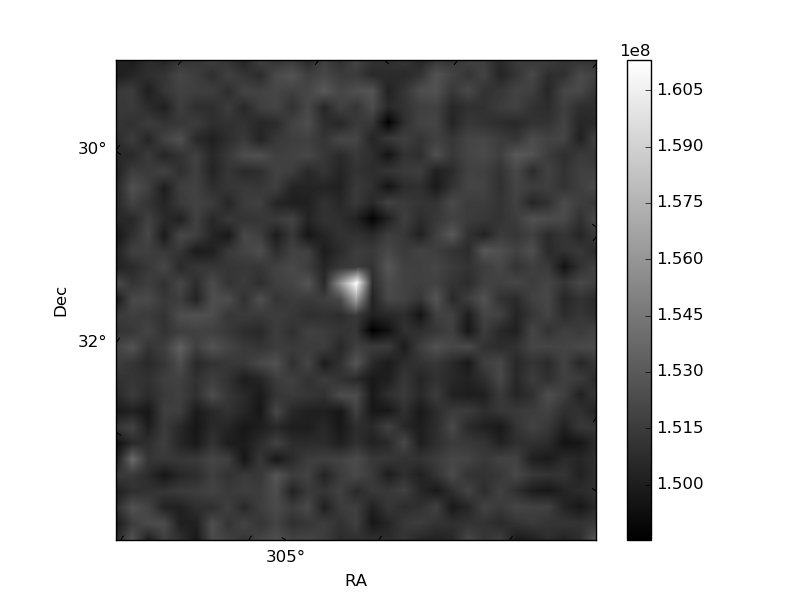
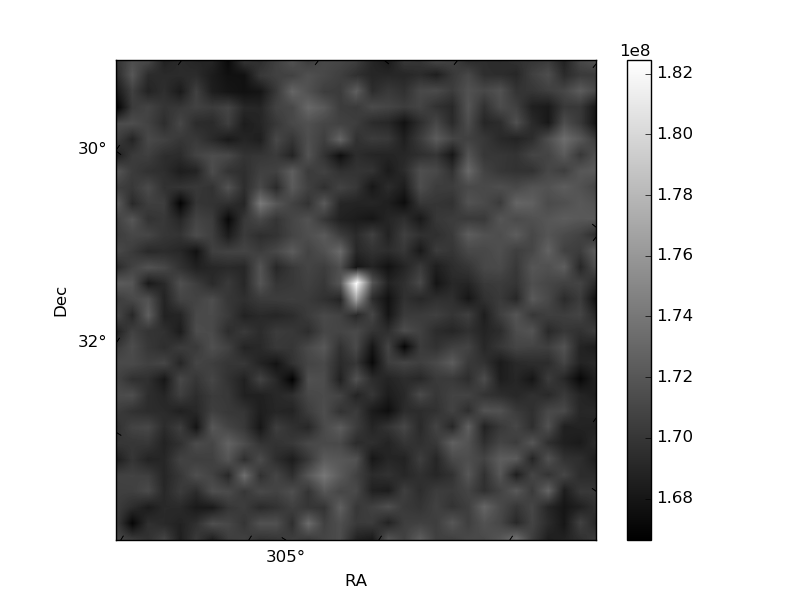
Histogram calculated using DETX and DETY for each event in the final _common_clean file
| Quadrant A | 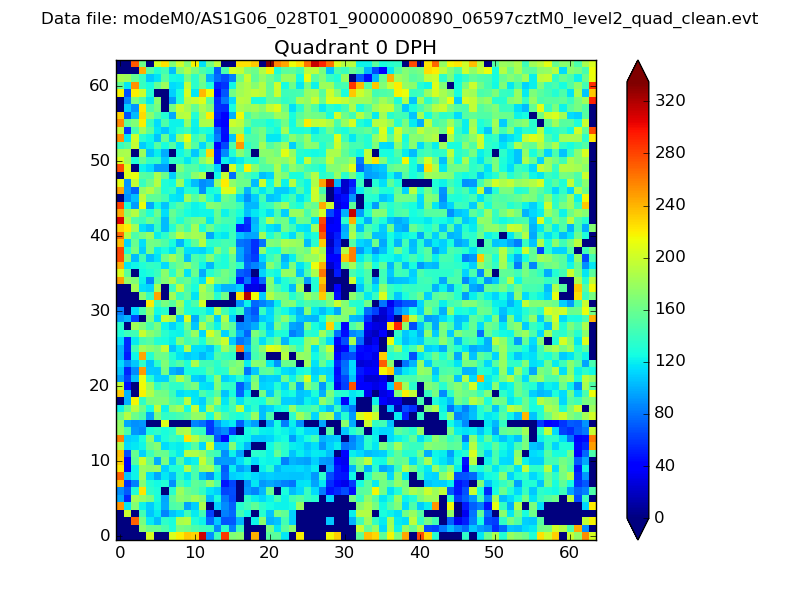 |
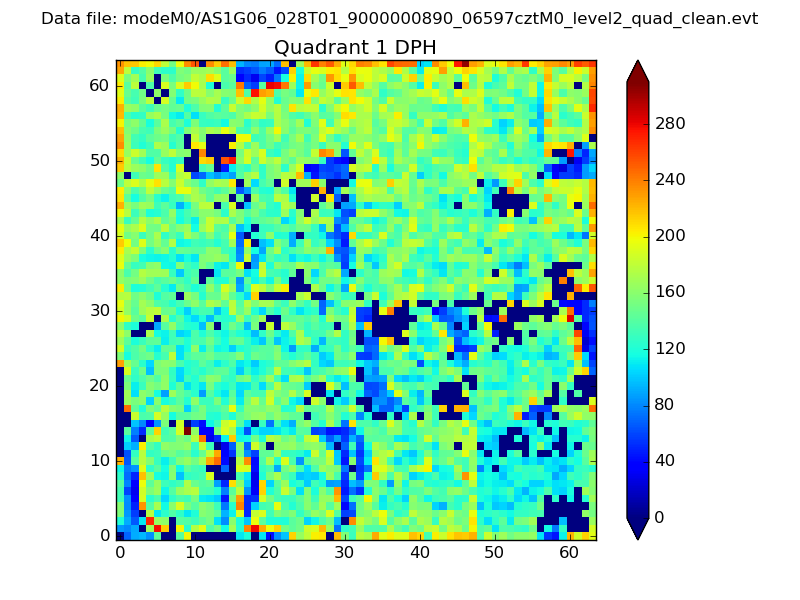 |
Quadrant B |
|---|---|---|---|
| Quadrant D | 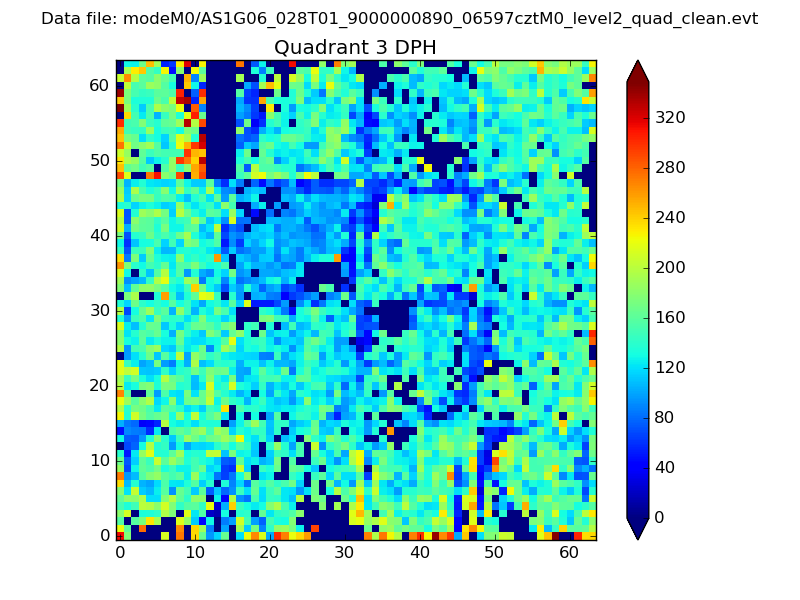 |
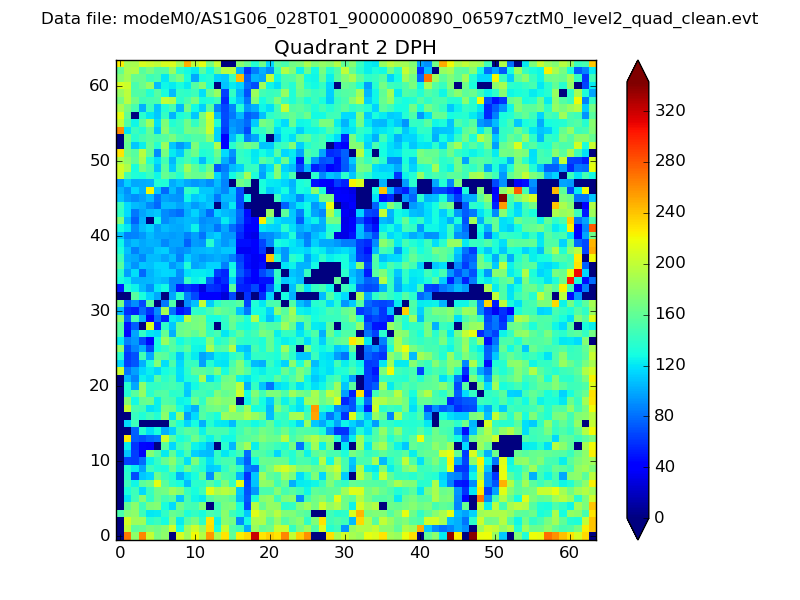 |
Quadrant C |
| Plot type | Count rate plots | Images |
|---|---|---|
| Comparison with Poisson distribution Blue bars denote a histogram of data divided into 1 sec bins. Red curve is a Poisson curve with rate = median count rate of data. |
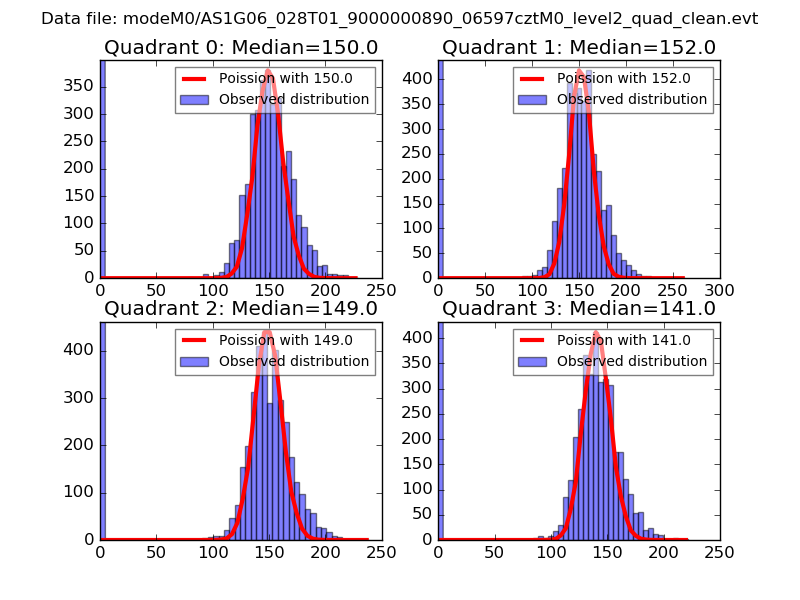 |
 |
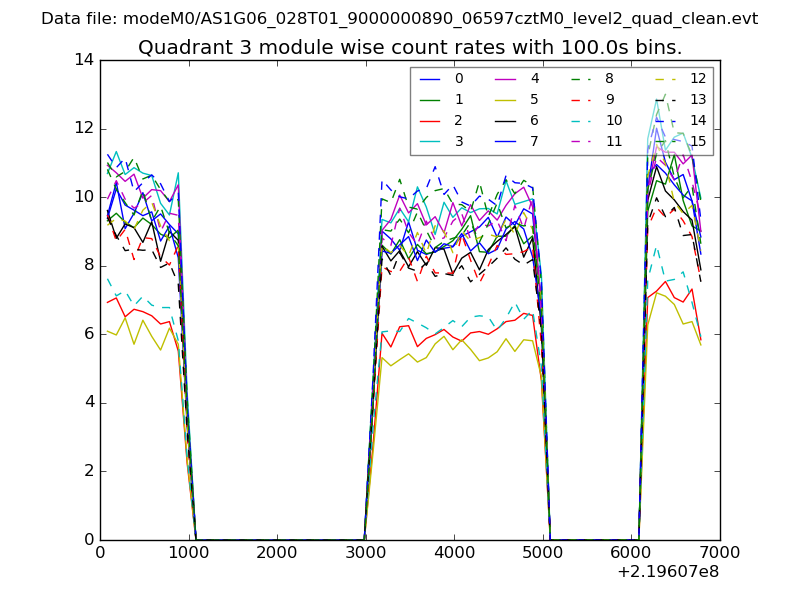
| Quadrant-wise count rates Data is divided into 100 sec bins |
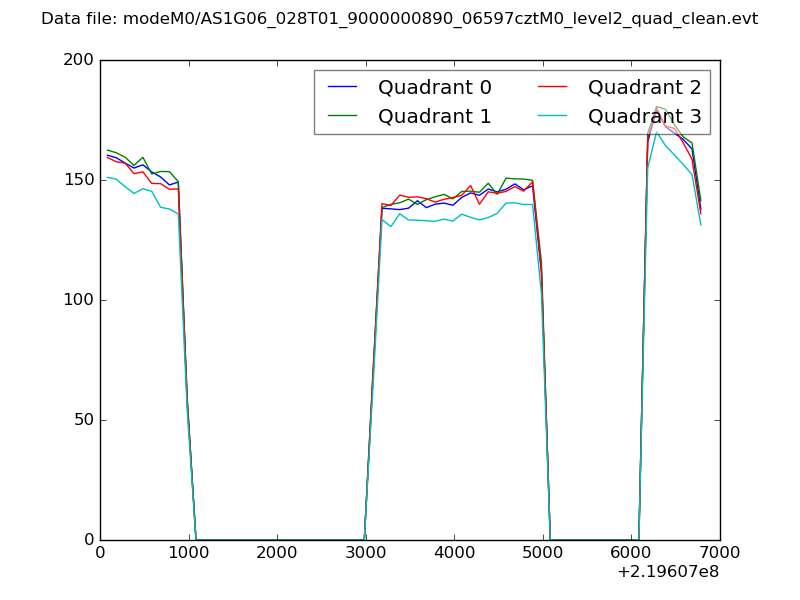 |
|
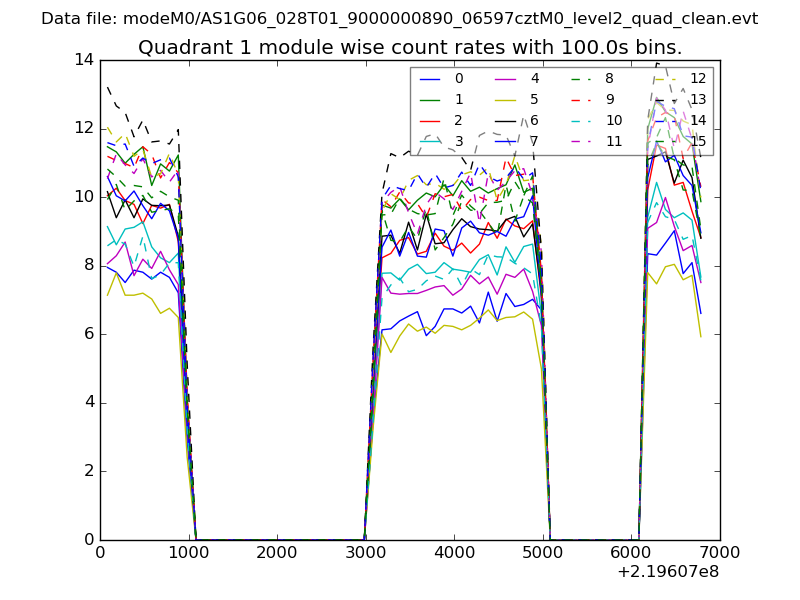
| Module-wise count rates for Quadrant A Data is divided into 100 sec bins |
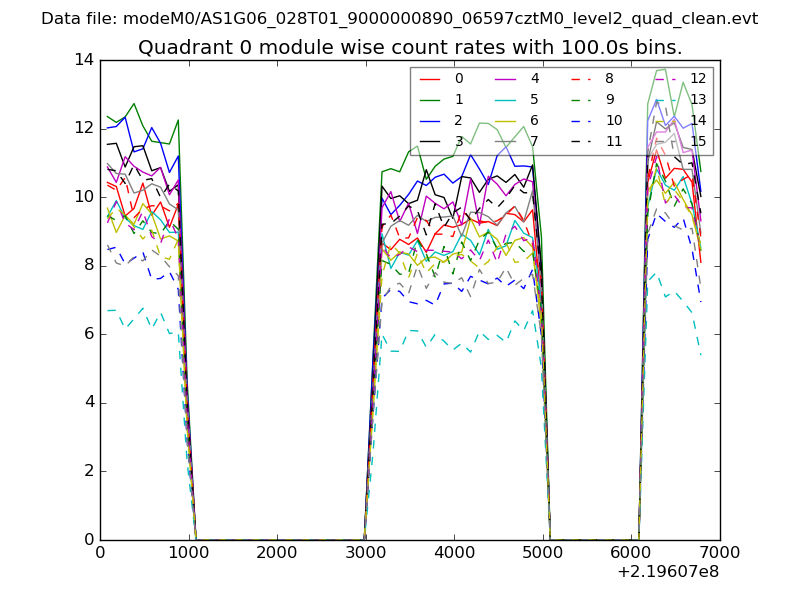 |
 |
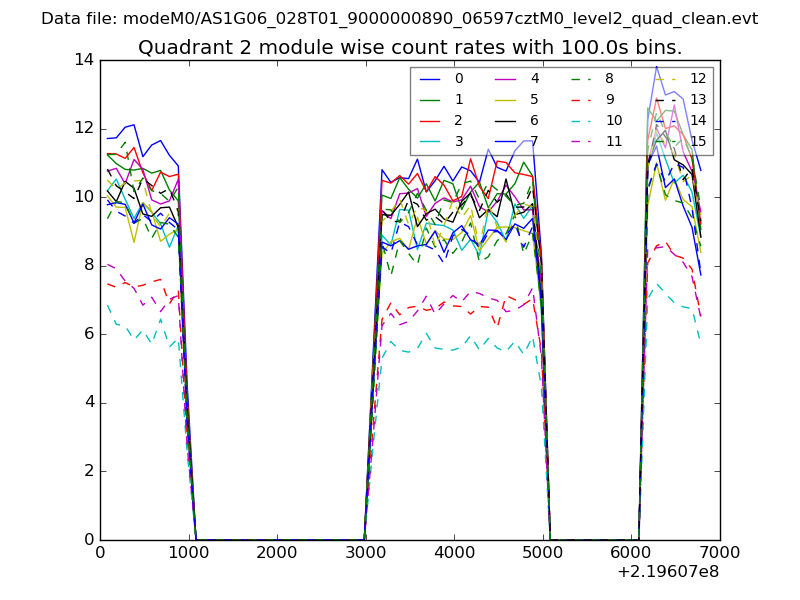
| Module-wise count rates for Quadrant B Data is divided into 100 sec bins |
 |
 |
| Module-wise count rates for Quadrant C Data is divided into 100 sec bins |
 |
 |
| Module-wise count rates for Quadrant D Data is divided into 100 sec bins |
 |
 |
| Parameter | Plot |
|---|---|
| CZT HV Monitor | 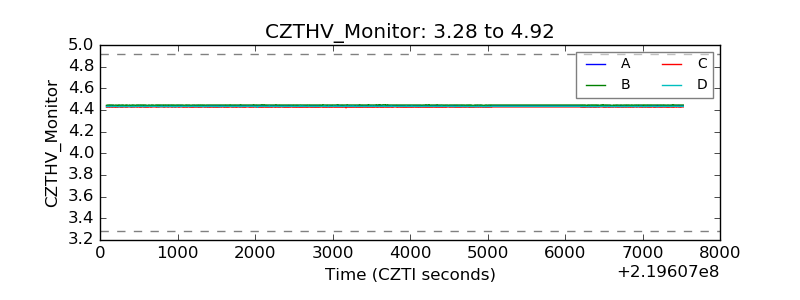 |
| D_VDD | 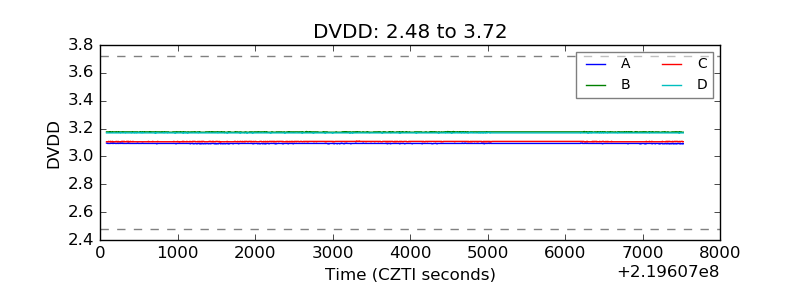 |
| Temperature 1 | 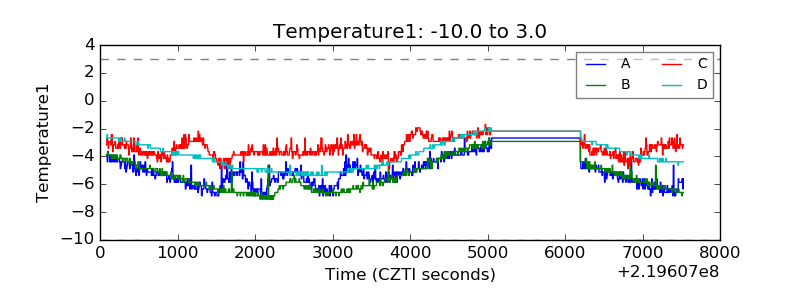 |
| Veto HV Monitor | 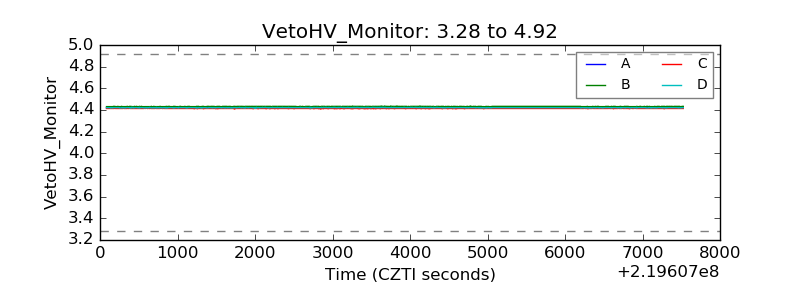 |
| Veto LLD | 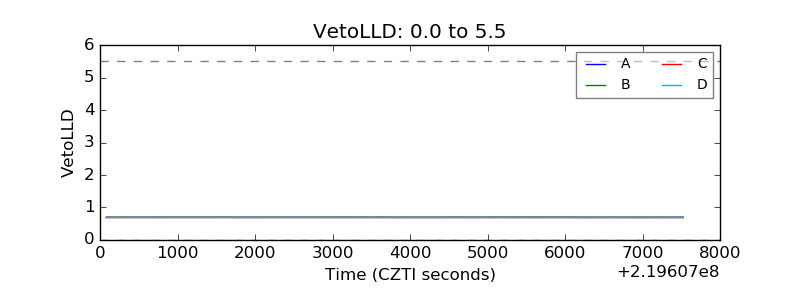 |
| Alpha Counter | 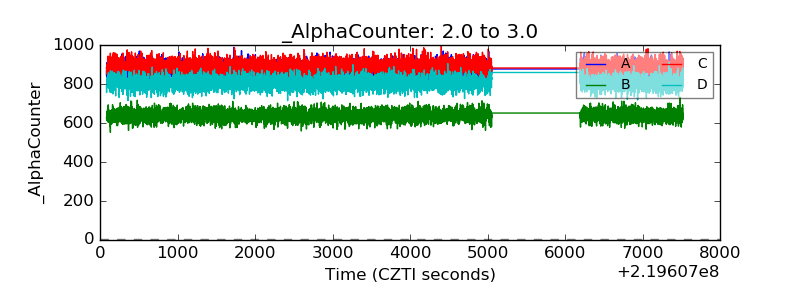 |
| _CPM_Rate | 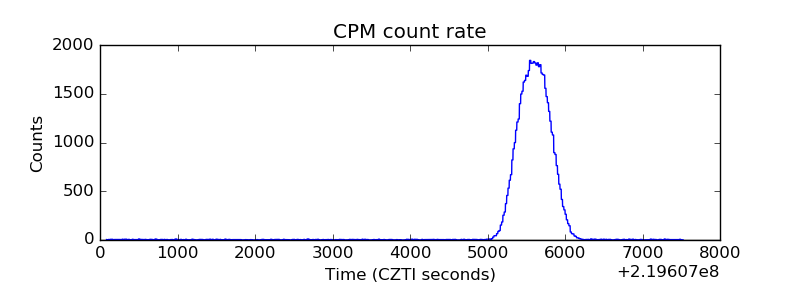 |
| CZT Counter | 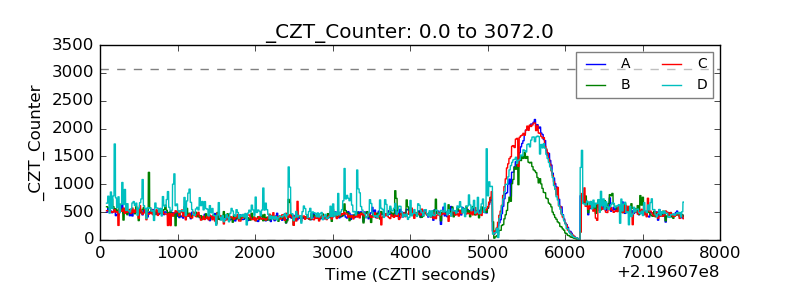 |
| +2.5 Volts monitor |  |
| +5 Volts monitor | 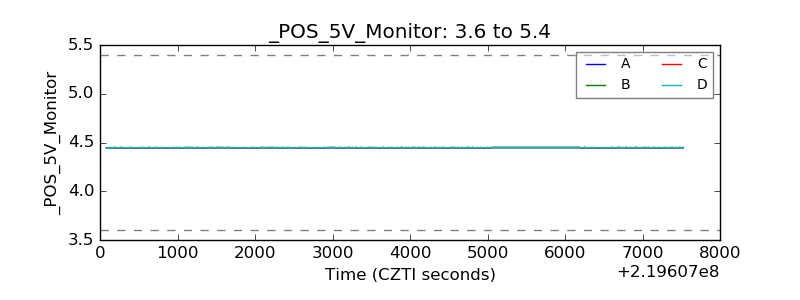 |
| _ROLL_ROT | 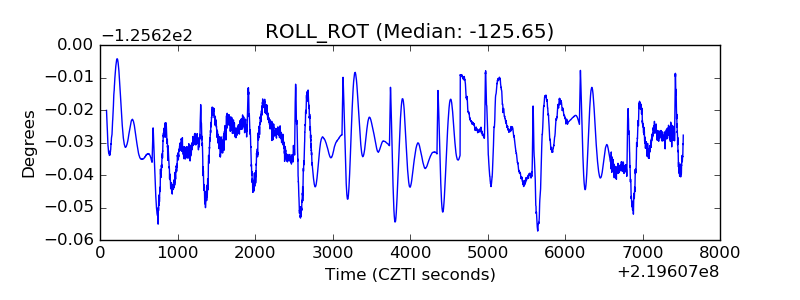 |
| _Roll_DEC | 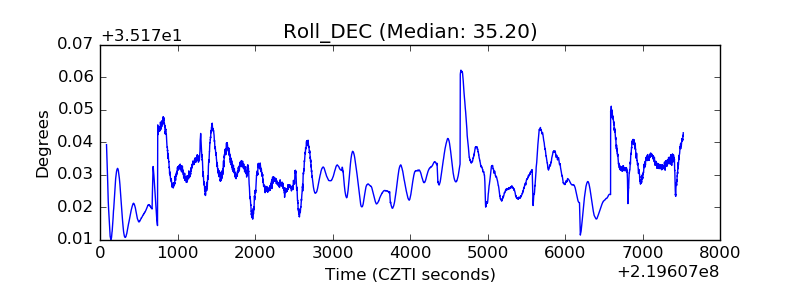 |
| _Roll_RA | 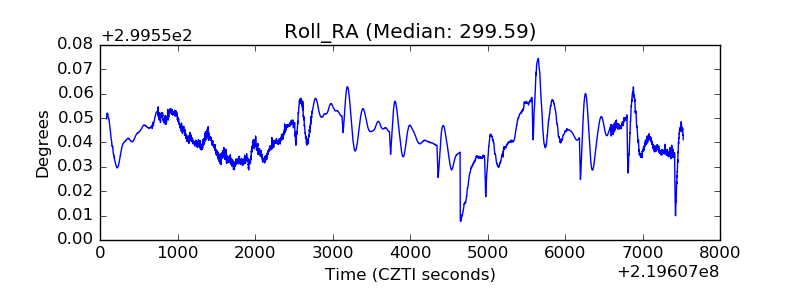 |
| Veto Counter | 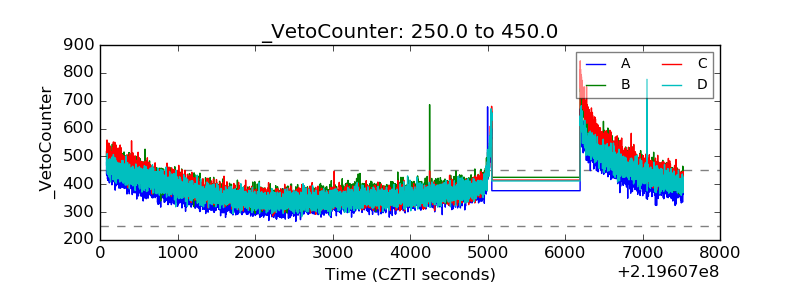 |