| Param | Original file | Final file |
|---|---|---|
| Filename | modeM0/AS1G06_028T01_9000000890_06599cztM0_level2.evt | modeM0/AS1G06_028T01_9000000890_06599cztM0_level2_quad_clean.evt |
| Size (bytes) | 543,565,440 | 69,312,960 |
| Size | 518.4 MB | 66.1 MB |
| Events in quadrant A | 3,147,778 | 422,830 |
| Events in quadrant B | 3,893,570 | 421,701 |
| Events in quadrant C | 3,121,269 | 424,220 |
| Events in quadrant D | 5,868,003 | 385,626 |
| Mode M0 | |||
|---|---|---|---|
| Quadrant | BADHDUFLAG | Total packets | Discarded packets |
| A | 0 | 13303 | 3 |
| B | 0 | 15543 | 2 |
| C | 0 | 13328 | 2 |
| D | 0 | 21932 | 2 |
| Mode M9 | |||
|---|---|---|---|
| Quadrant | BADHDUFLAG | Total packets | Discarded packets |
| A | 0 | 21 | 0 |
| B | 0 | 21 | 0 |
| C | 0 | 21 | 0 |
| D | 0 | 22 | 0 |
| Mode SS | |||
|---|---|---|---|
| Quadrant | BADHDUFLAG | Total packets | Discarded packets |
| A | 0 | 128 | 0 |
| B | 0 | 128 | 0 |
| C | 0 | 128 | 0 |
| D | 0 | 128 | 0 |
| Quadrant | Total seconds | Saturated seconds | Saturation percentage |
|---|---|---|---|
| A | 6370 | 33 | 0.518053% |
| B | 6370 | 257 | 4.034537% |
| C | 6370 | 34 | 0.533752% |
| D | 6370 | 416 | 6.530612% |
Noise dominated data is calculated using 1-second bins in cleaned event files. If a bin has >2000 counts, and if more than 50% of those come from <1% of pixels, then it is considered to be noise-dominated and hence unusable.
| Quadrant | # 1 sec bins | Bins with >0 counts | Bins with >2000 counts | High rate bins dominated by noise | Noise dominated (total time) | Noise dominated (detector-on time) | Marked lightcurve |
|---|---|---|---|---|---|---|---|
| A | 7700 | 6371 | 0 | 0 | 0.00% | 0.00% | 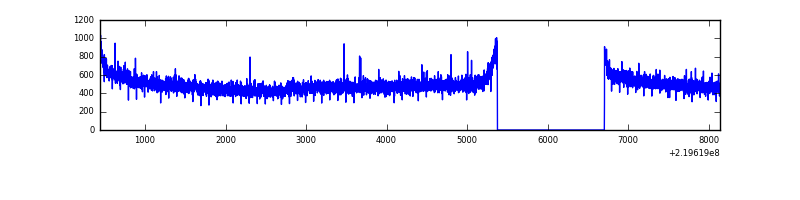 |
| B | 7700 | 6371 | 166 | 166 | 2.16% | 2.61% | 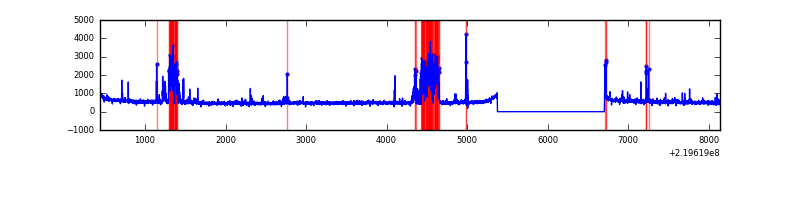 |
| C | 7700 | 6371 | 0 | 0 | 0.00% | 0.00% |  |
| D | 7700 | 6371 | 312 | 312 | 4.05% | 4.90% | 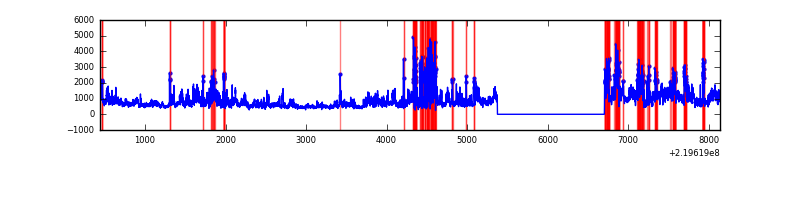 |
Top three noisy pixels from each quadrant. If the there are fewer than three noisy pixels in the level2.evt file, extra rows are filled as -1
| Pixel properties | Quadrant properties | ||||||
|---|---|---|---|---|---|---|---|
| Quadrant | DetID | PixID | Counts | Sigma | Mean | Median | Sigma |
| A | 8 | 15 | 18933 | 111.58 | 811 | 798 | 162.5 |
| A | 0 | 226 | 7716 | 42.57 | 811 | 798 | 162.5 |
| A | 12 | 194 | 7471 | 41.06 | 811 | 798 | 162.5 |
| B | 3 | 220 | 606216 | 3984.07 | 811 | 798 | 152.0 |
| B | 0 | 219 | 75202 | 489.63 | 811 | 798 | 152.0 |
| B | 4 | 81 | 57579 | 373.66 | 811 | 798 | 152.0 |
| C | 1 | 16 | 8419 | 41.79 | 794 | 801 | 182.3 |
| C | 9 | 54 | 7682 | 37.75 | 794 | 801 | 182.3 |
| C | 13 | 61 | 6111 | 29.13 | 794 | 801 | 182.3 |
| D | 8 | 195 | 1748277 | 9328.11 | 768 | 745 | 187.3 |
| D | 13 | 105 | 930321 | 4961.96 | 768 | 745 | 187.3 |
| D | 2 | 63 | 58532 | 308.46 | 768 | 745 | 187.3 |
Histogram calculated using DETX and DETY for each event in the final _common_clean file
| Quadrant A | 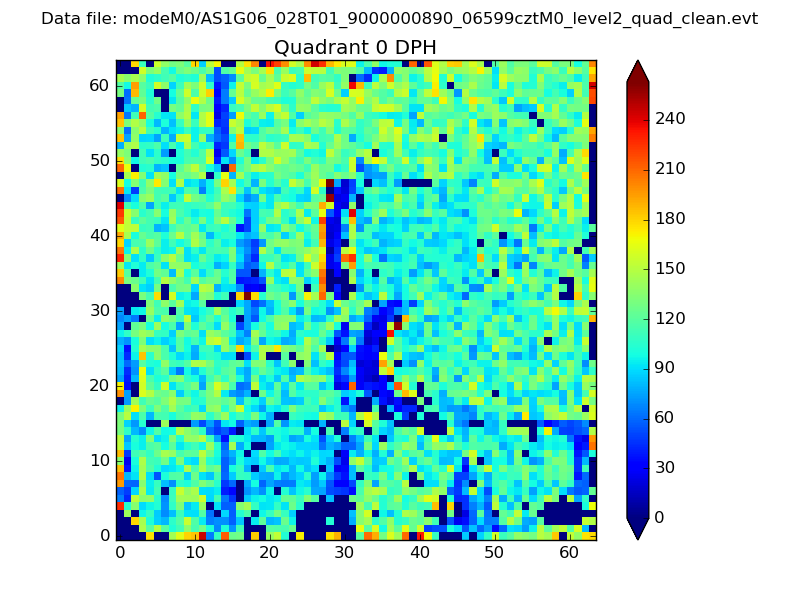 |
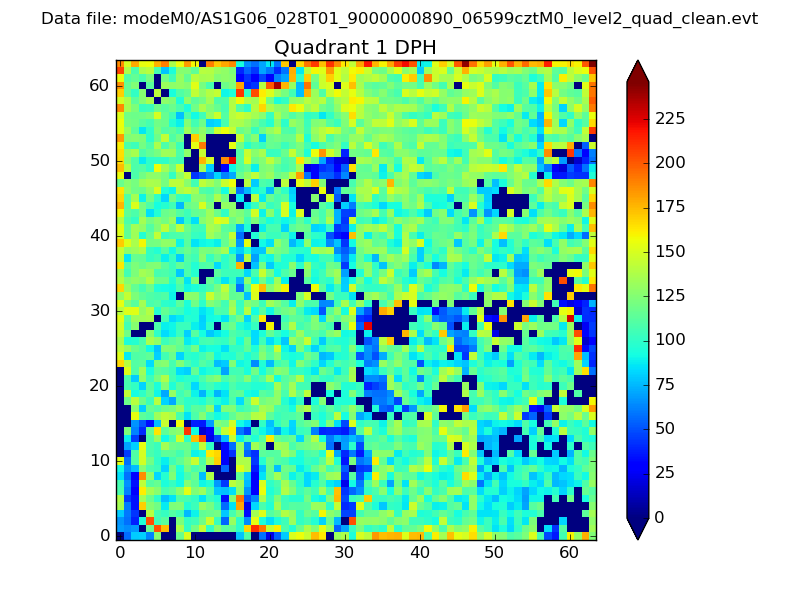 |
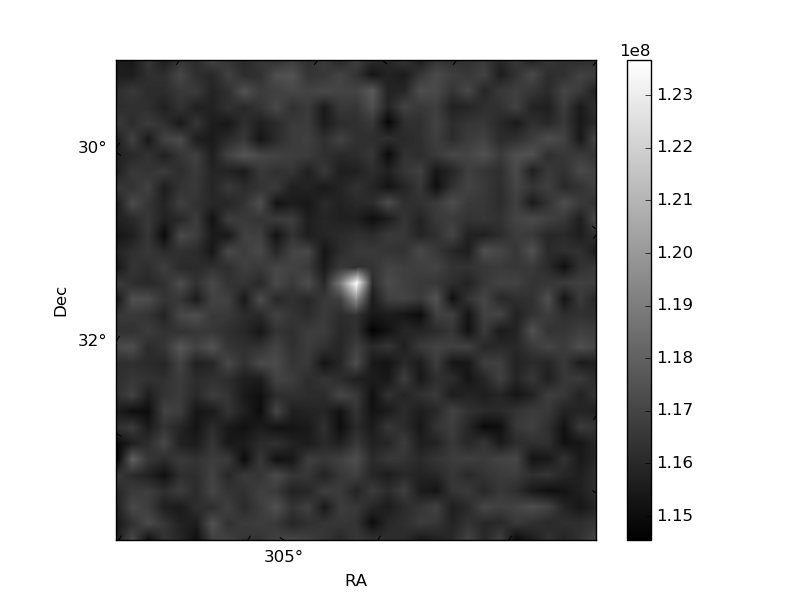
Quadrant B |
|---|---|---|---|
| Quadrant D | 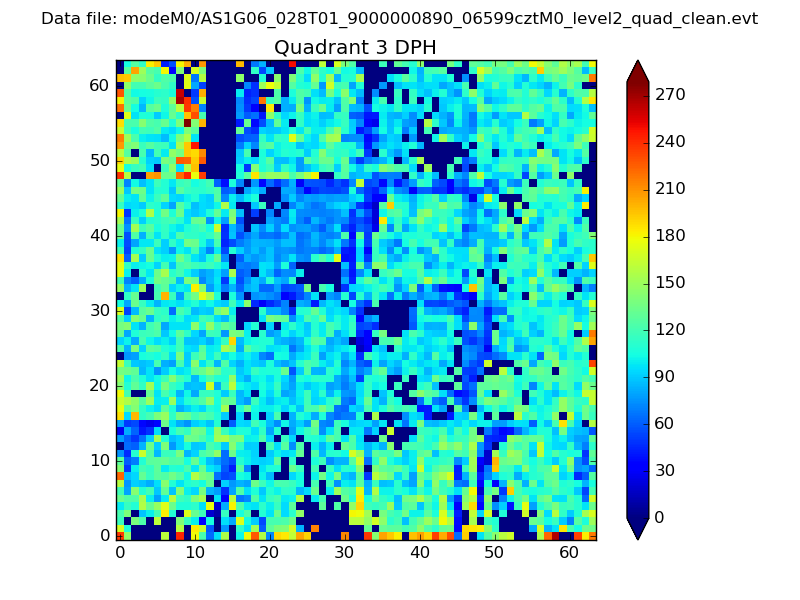 |
 |
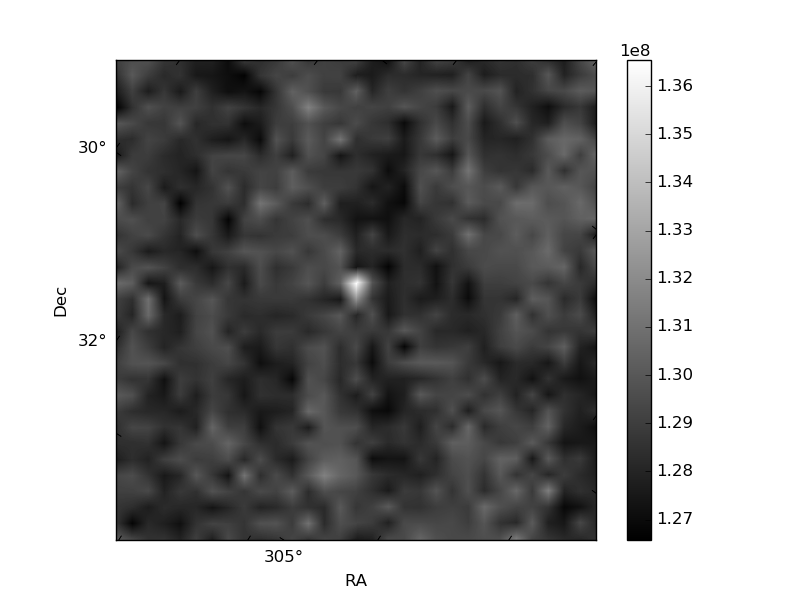
Quadrant C |
| Plot type | Count rate plots | Images |
|---|---|---|
| Comparison with Poisson distribution Blue bars denote a histogram of data divided into 1 sec bins. Red curve is a Poisson curve with rate = median count rate of data. |
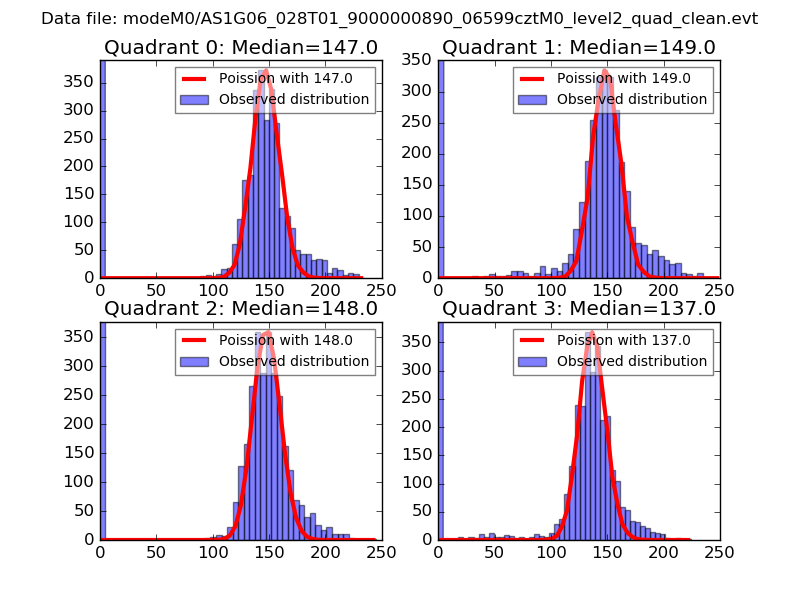 |
 |
| Quadrant-wise count rates Data is divided into 100 sec bins |
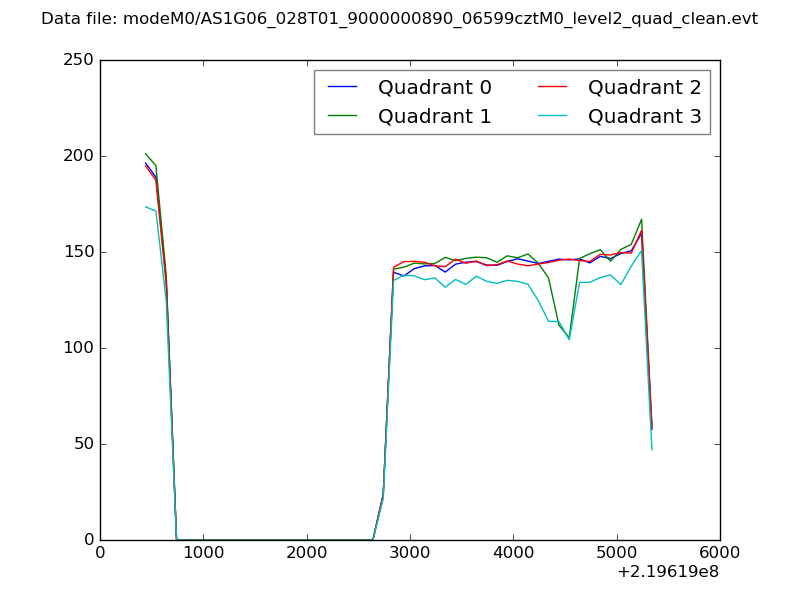 |
|
| Module-wise count rates for Quadrant A Data is divided into 100 sec bins |
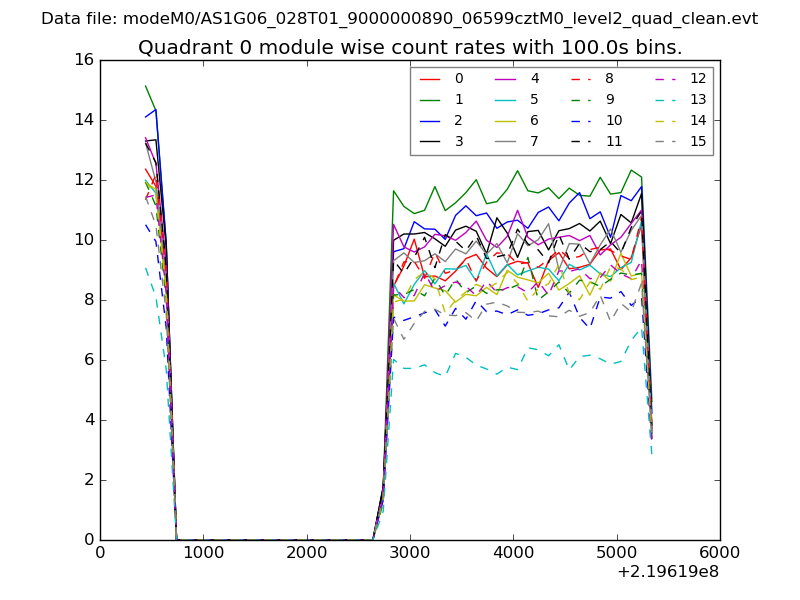 |
 |
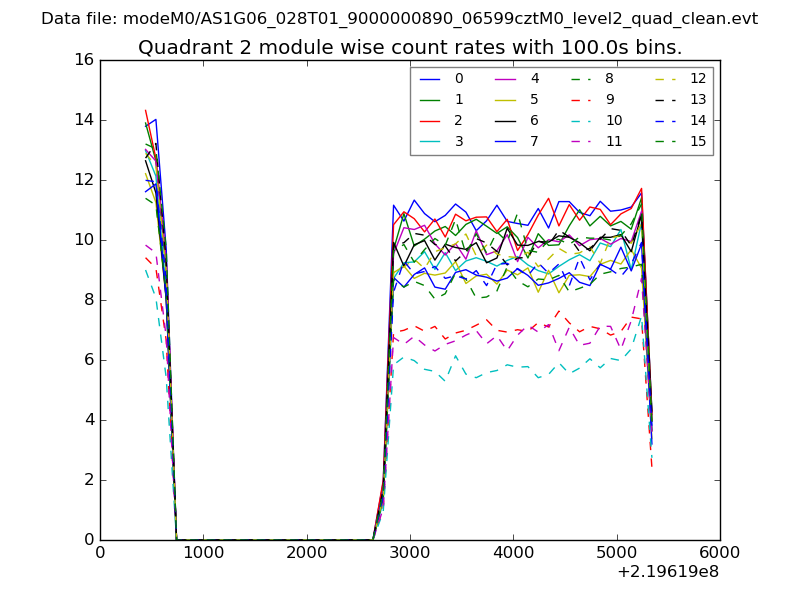
| Module-wise count rates for Quadrant B Data is divided into 100 sec bins |
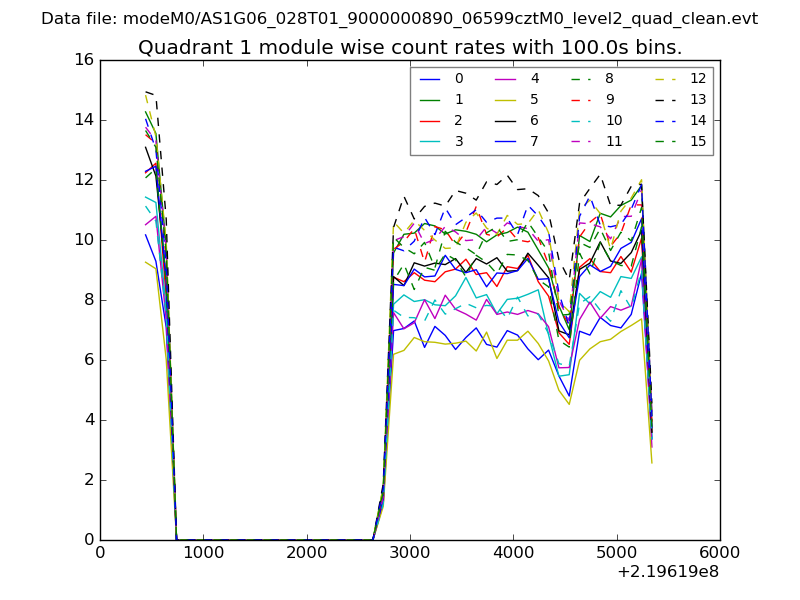 |
 |
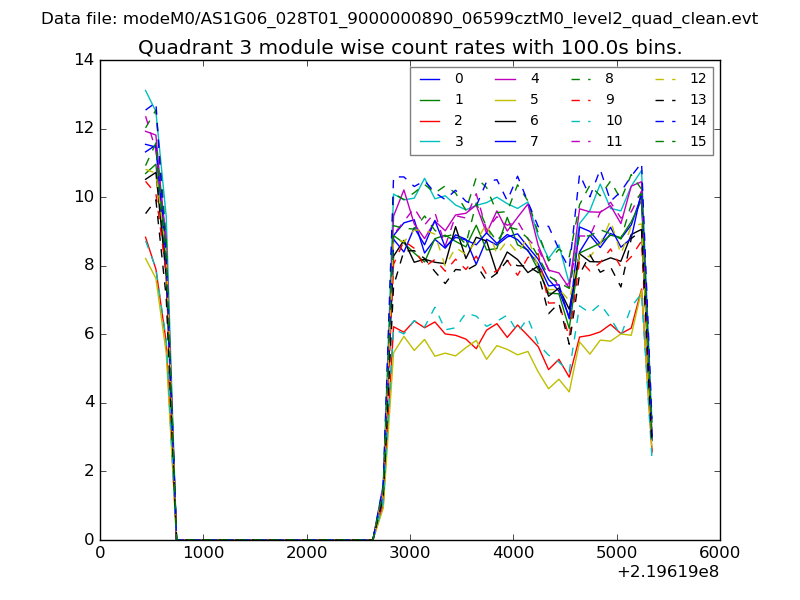
| Module-wise count rates for Quadrant C Data is divided into 100 sec bins |
 |
 |
| Module-wise count rates for Quadrant D Data is divided into 100 sec bins |
 |
 |
| Parameter | Plot |
|---|---|
| CZT HV Monitor | 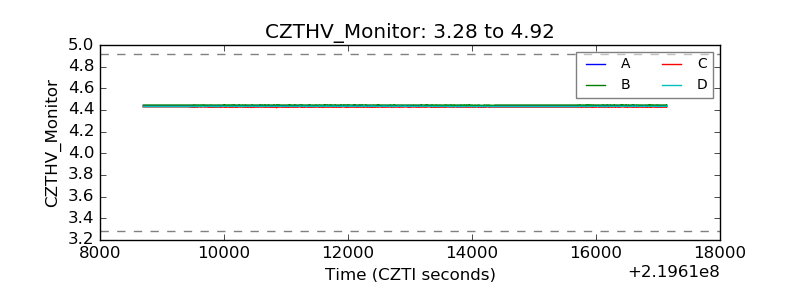 |
| D_VDD | 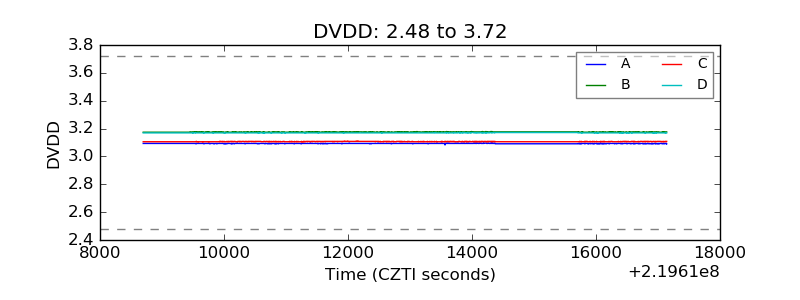 |
| Temperature 1 | 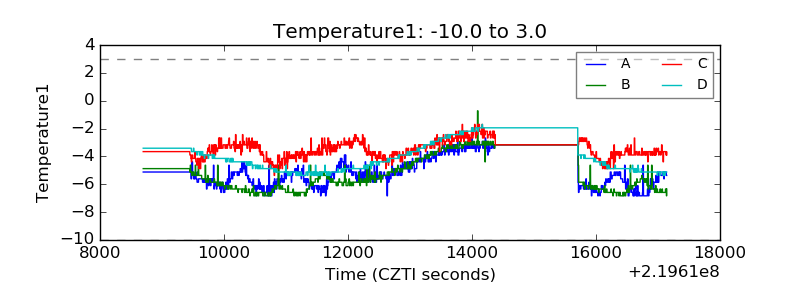 |
| Veto HV Monitor | 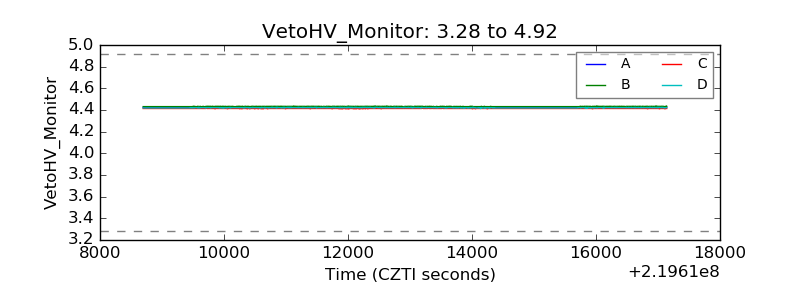 |
| Veto LLD | 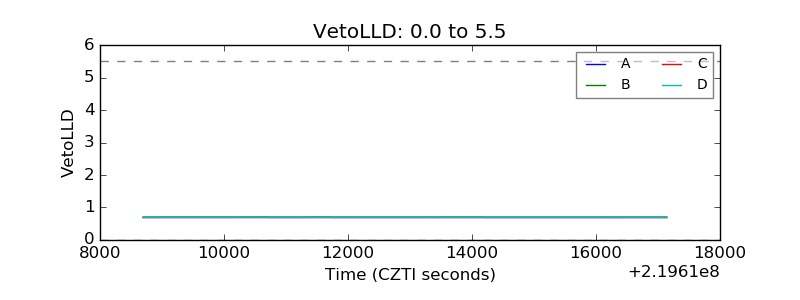 |
| Alpha Counter | 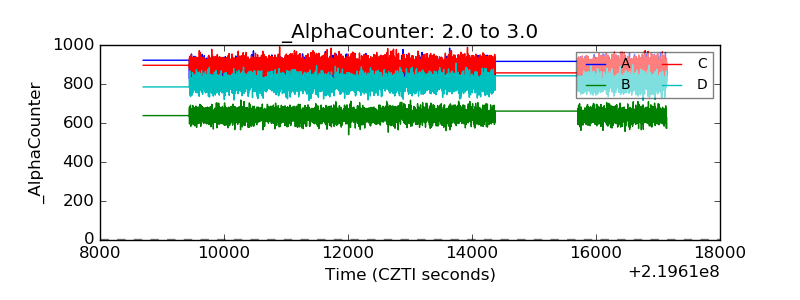 |
| _CPM_Rate | 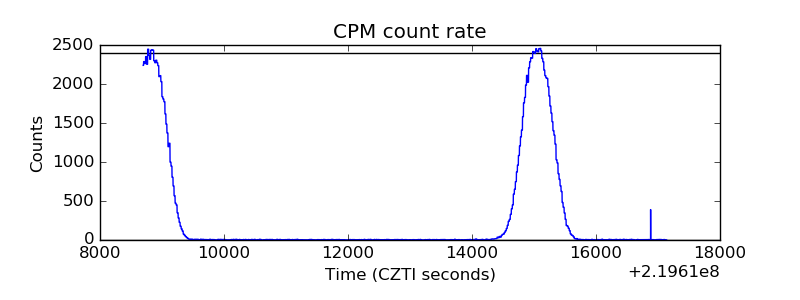 |
| CZT Counter | 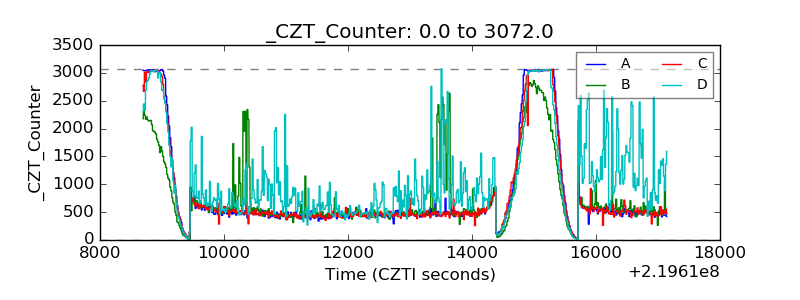 |
| +2.5 Volts monitor |  |
| +5 Volts monitor |  |
| _ROLL_ROT | 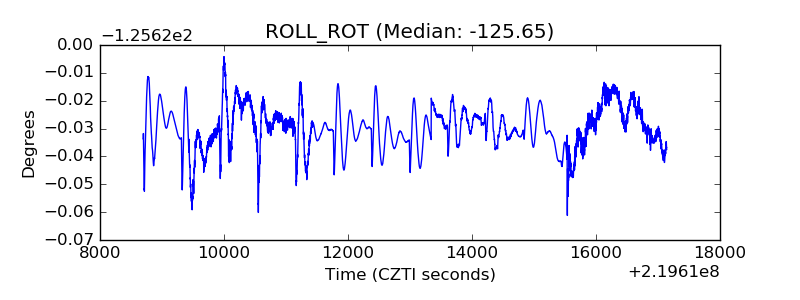 |
| _Roll_DEC | 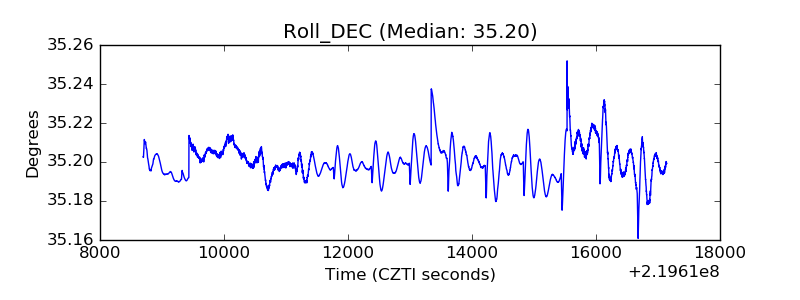 |
| _Roll_RA | 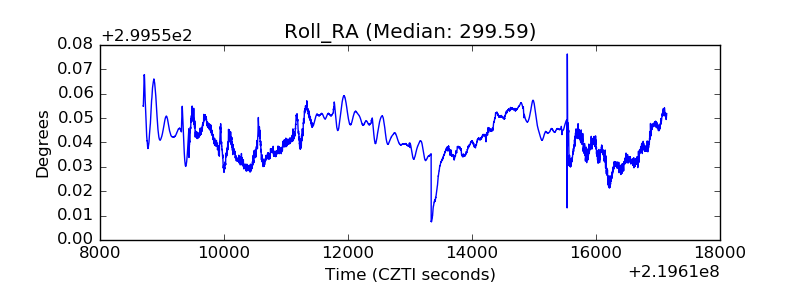 |
| Veto Counter | 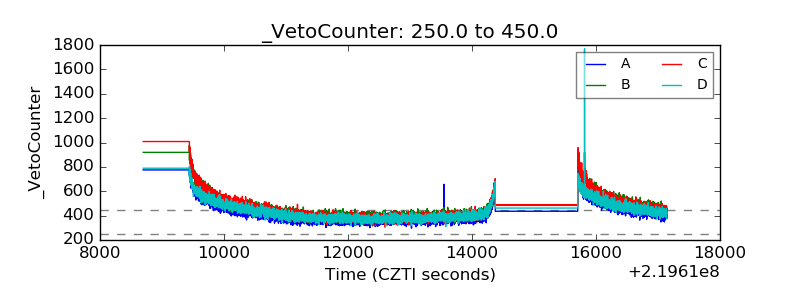 |