| Param | Original file | Final file |
|---|---|---|
| Filename | modeM0/AS1G06_028T01_9000000890_06600cztM0_level2.evt | modeM0/AS1G06_028T01_9000000890_06600cztM0_level2_quad_clean.evt |
| Size (bytes) | 575,573,760 | 69,886,080 |
| Size | 548.9 MB | 66.6 MB |
| Events in quadrant A | 3,134,425 | 430,234 |
| Events in quadrant B | 3,343,013 | 436,672 |
| Events in quadrant C | 4,028,085 | 415,796 |
| Events in quadrant D | 6,499,105 | 393,126 |
| Mode M0 | |||
|---|---|---|---|
| Quadrant | BADHDUFLAG | Total packets | Discarded packets |
| A | 0 | 13156 | 3 |
| B | 0 | 13770 | 2 |
| C | 0 | 16021 | 2 |
| D | 0 | 23730 | 2 |
| Mode M9 | |||
|---|---|---|---|
| Quadrant | BADHDUFLAG | Total packets | Discarded packets |
| A | 0 | 15 | 0 |
| B | 0 | 15 | 0 |
| C | 0 | 15 | 0 |
| D | 0 | 16 | 0 |
| Mode SS | |||
|---|---|---|---|
| Quadrant | BADHDUFLAG | Total packets | Discarded packets |
| A | 0 | 126 | 0 |
| B | 0 | 126 | 0 |
| C | 0 | 126 | 0 |
| D | 0 | 126 | 0 |
| Quadrant | Total seconds | Saturated seconds | Saturation percentage |
|---|---|---|---|
| A | 6314 | 31 | 0.490972% |
| B | 6314 | 68 | 1.076972% |
| C | 6314 | 256 | 4.054482% |
| D | 6314 | 345 | 5.464048% |
Noise dominated data is calculated using 1-second bins in cleaned event files. If a bin has >2000 counts, and if more than 50% of those come from <1% of pixels, then it is considered to be noise-dominated and hence unusable.
| Quadrant | # 1 sec bins | Bins with >0 counts | Bins with >2000 counts | High rate bins dominated by noise | Noise dominated (total time) | Noise dominated (detector-on time) | Marked lightcurve |
|---|---|---|---|---|---|---|---|
| A | 7674 | 6315 | 0 | 0 | 0.00% | 0.00% | 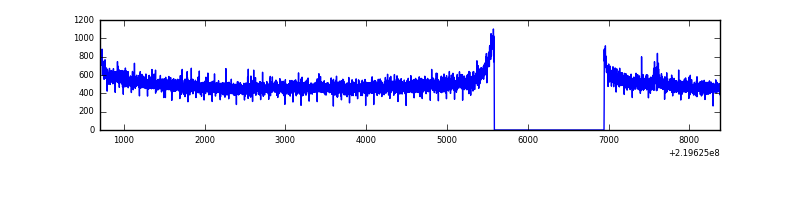 |
| B | 7674 | 6315 | 10 | 10 | 0.13% | 0.16% | 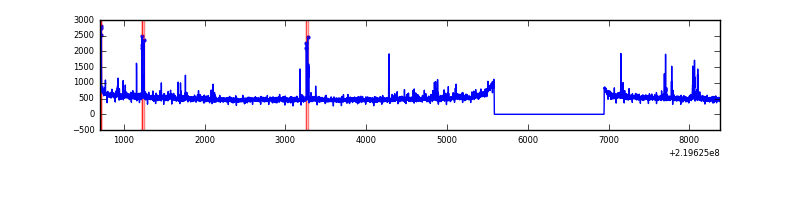 |
| C | 7674 | 6315 | 194 | 194 | 2.53% | 3.07% | 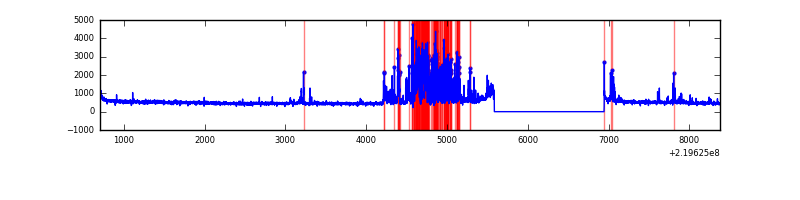 |
| D | 7674 | 6315 | 259 | 259 | 3.38% | 4.10% | 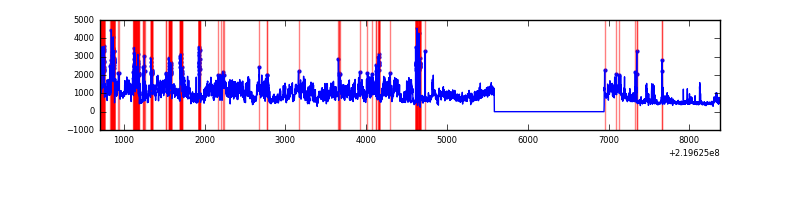 |
Top three noisy pixels from each quadrant. If the there are fewer than three noisy pixels in the level2.evt file, extra rows are filled as -1
| Pixel properties | Quadrant properties | ||||||
|---|---|---|---|---|---|---|---|
| Quadrant | DetID | PixID | Counts | Sigma | Mean | Median | Sigma |
| A | 8 | 15 | 21382 | 126.84 | 807 | 792 | 162.3 |
| A | 0 | 226 | 7681 | 42.44 | 807 | 792 | 162.3 |
| A | 12 | 194 | 7517 | 41.43 | 807 | 792 | 162.3 |
| B | 4 | 81 | 115391 | 742.49 | 815 | 798 | 154.3 |
| B | 0 | 219 | 49782 | 317.38 | 815 | 798 | 154.3 |
| B | 12 | 111 | 15575 | 95.74 | 815 | 798 | 154.3 |
| C | 9 | 247 | 950948 | 5290.78 | 780 | 787 | 179.6 |
| C | 3 | 9 | 19787 | 105.8 | 780 | 787 | 179.6 |
| C | 1 | 16 | 7870 | 39.44 | 780 | 787 | 179.6 |
| D | 8 | 195 | 2736631 | 14721.54 | 764 | 742 | 185.8 |
| D | 13 | 105 | 383314 | 2058.58 | 764 | 742 | 185.8 |
| D | 2 | 63 | 322535 | 1731.53 | 764 | 742 | 185.8 |
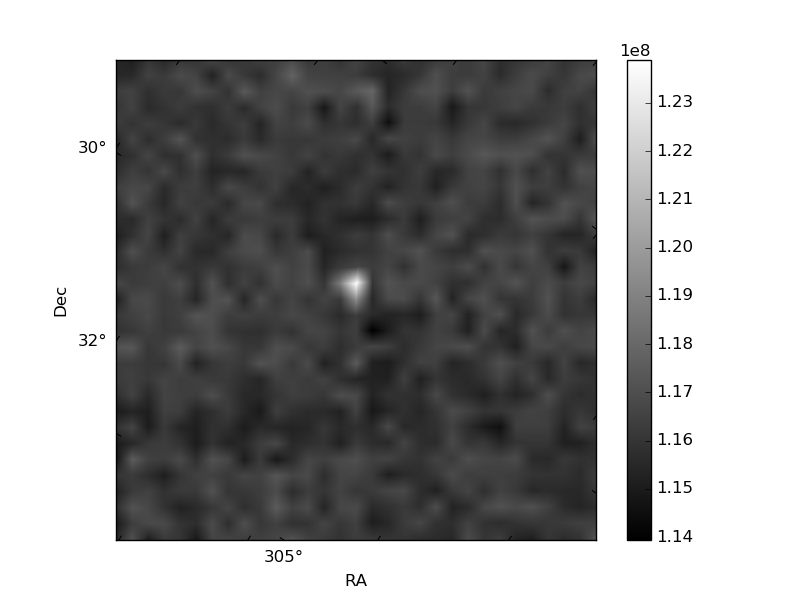
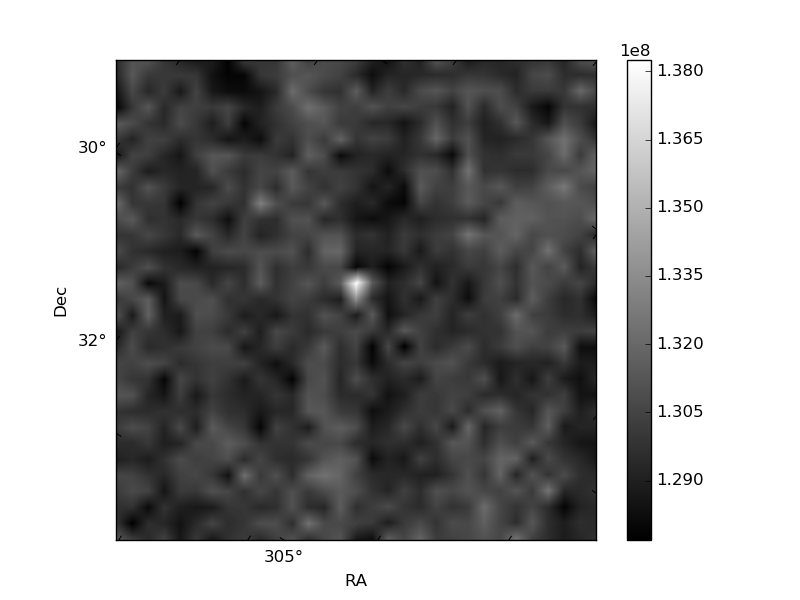
Histogram calculated using DETX and DETY for each event in the final _common_clean file
| Quadrant A | 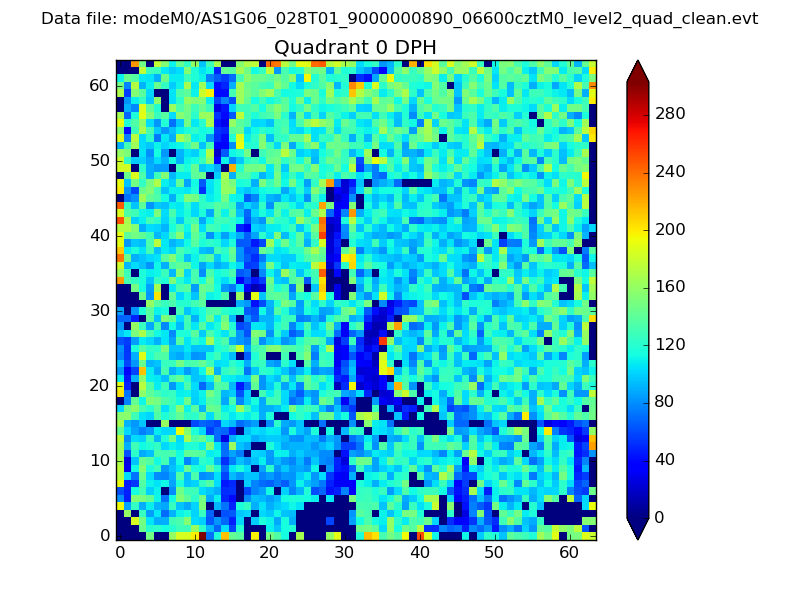 |
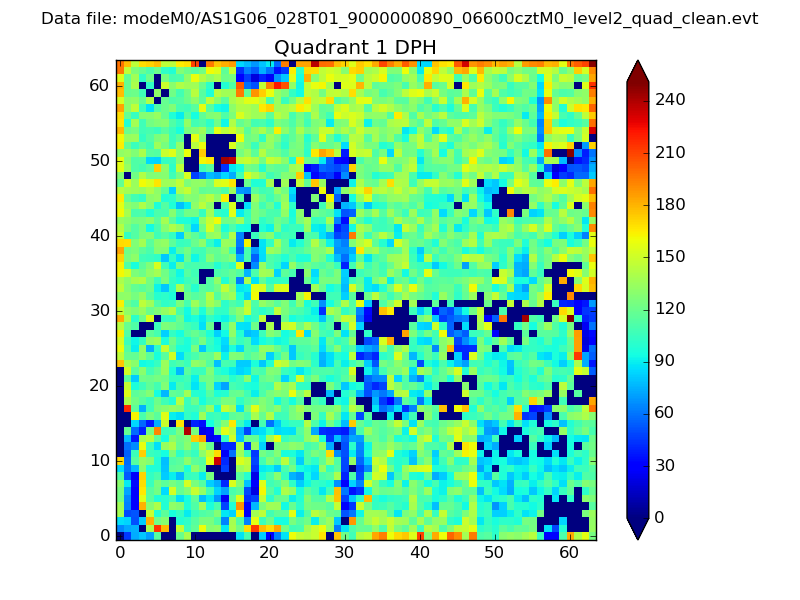 |
Quadrant B |
|---|---|---|---|
| Quadrant D | 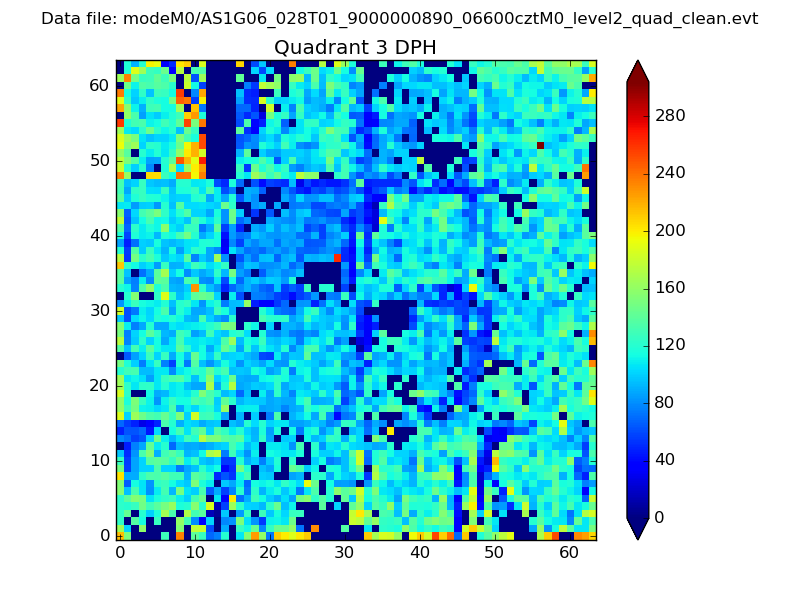 |
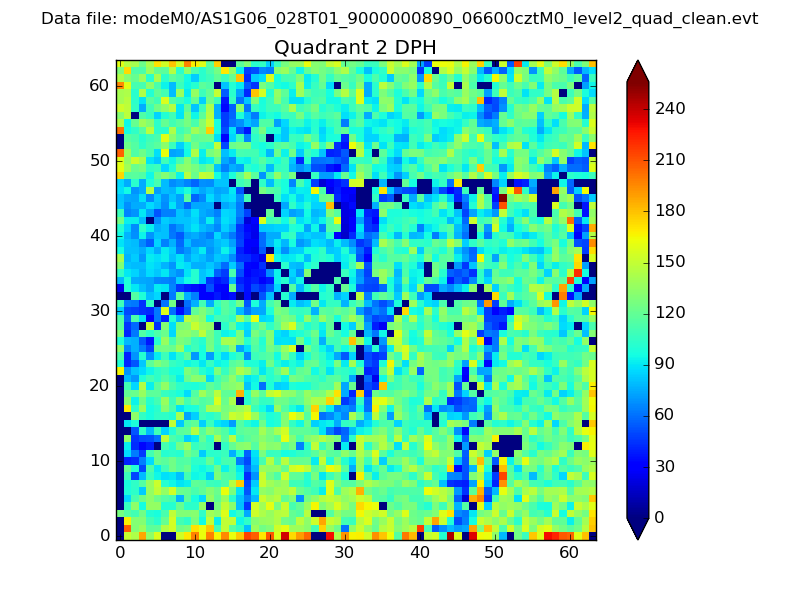 |
Quadrant C |
| Plot type | Count rate plots | Images |
|---|---|---|
| Comparison with Poisson distribution Blue bars denote a histogram of data divided into 1 sec bins. Red curve is a Poisson curve with rate = median count rate of data. |
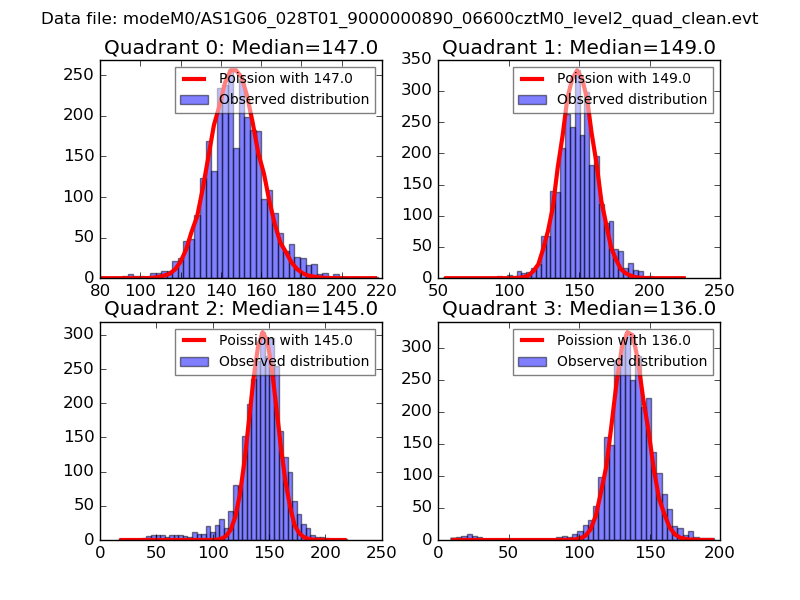 |
 |
| Quadrant-wise count rates Data is divided into 100 sec bins |
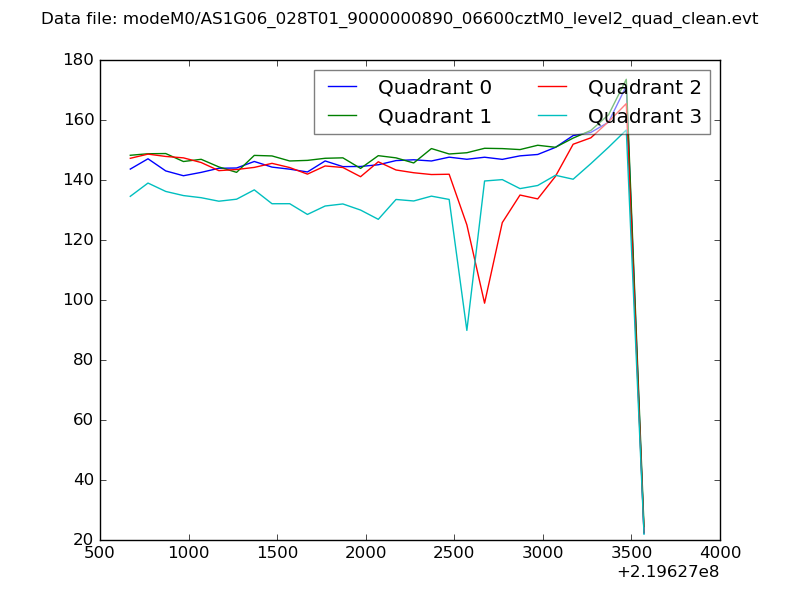 |
|
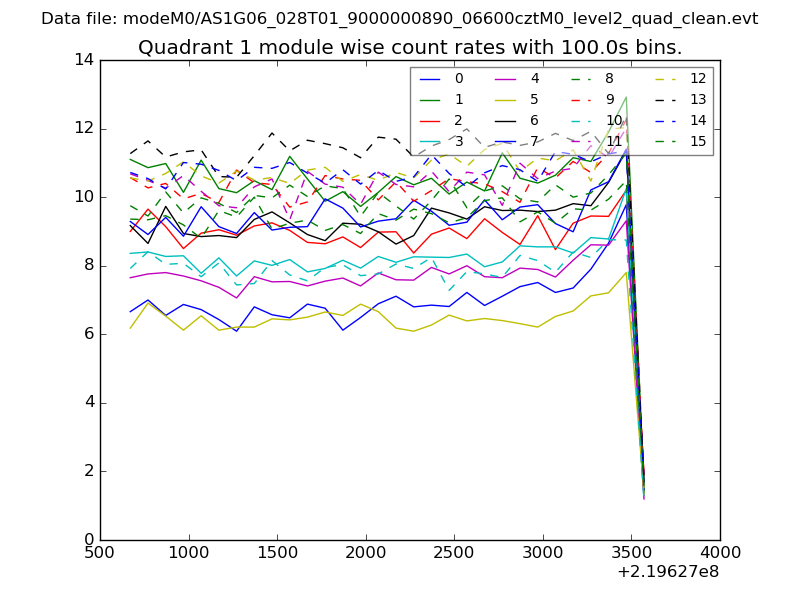
| Module-wise count rates for Quadrant A Data is divided into 100 sec bins |
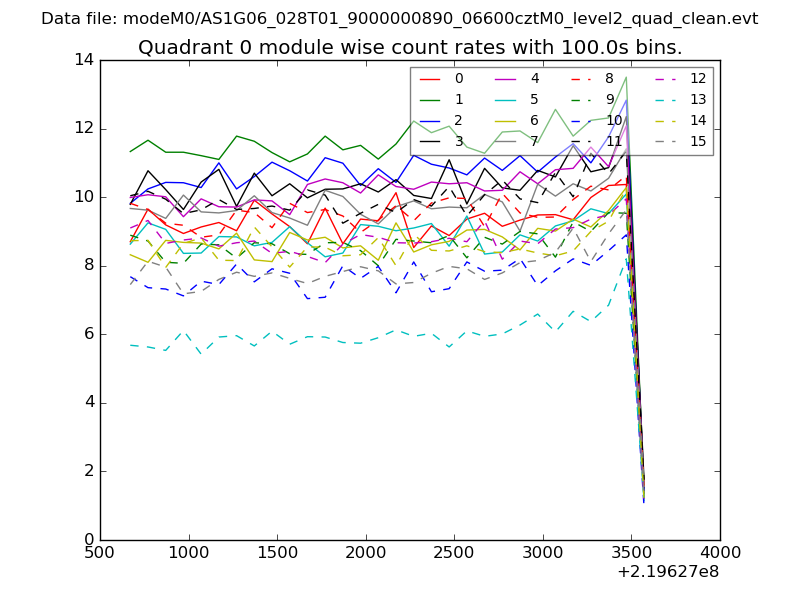 |
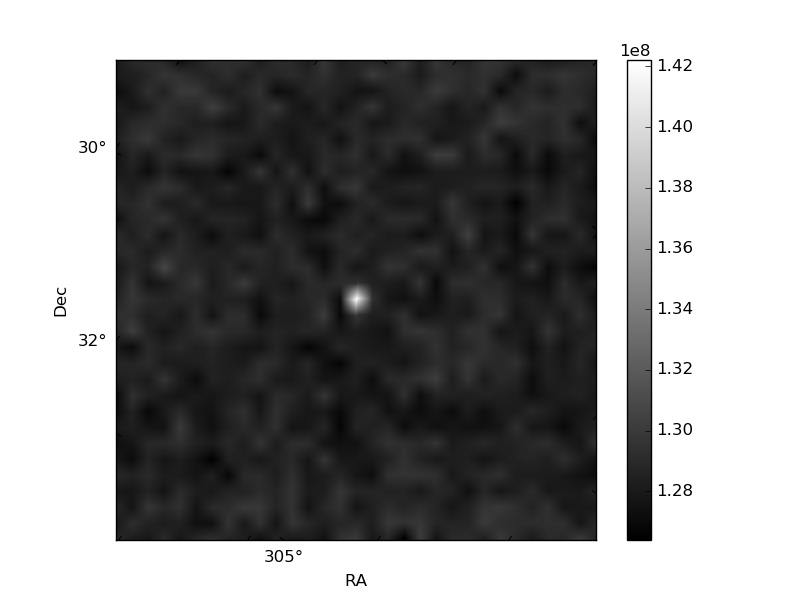 |
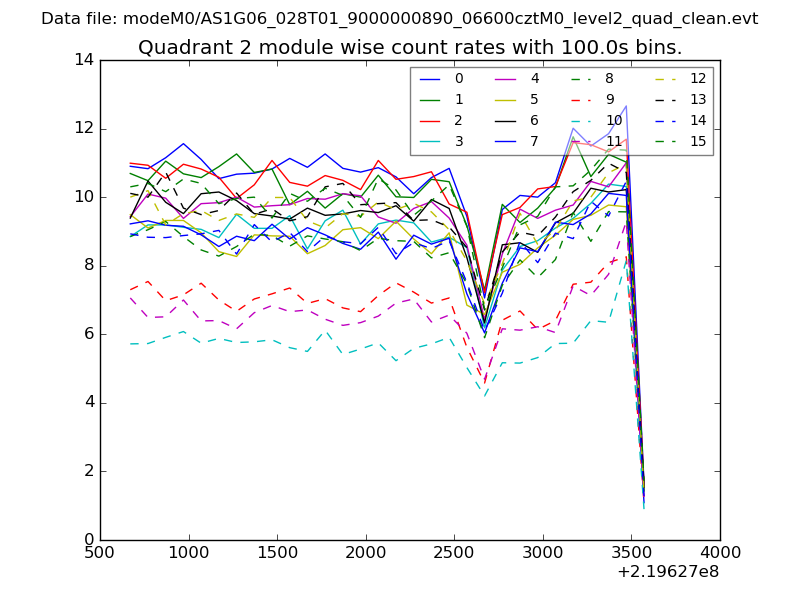
| Module-wise count rates for Quadrant B Data is divided into 100 sec bins |
 |
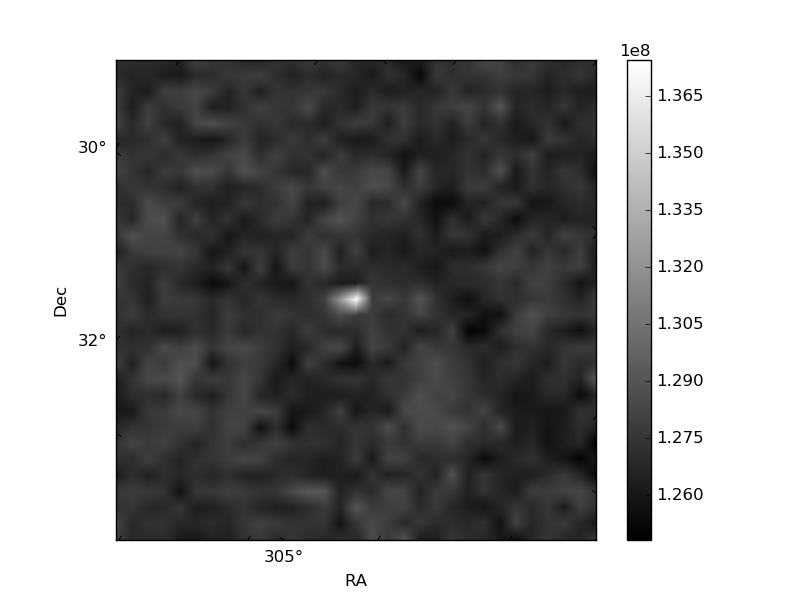 |
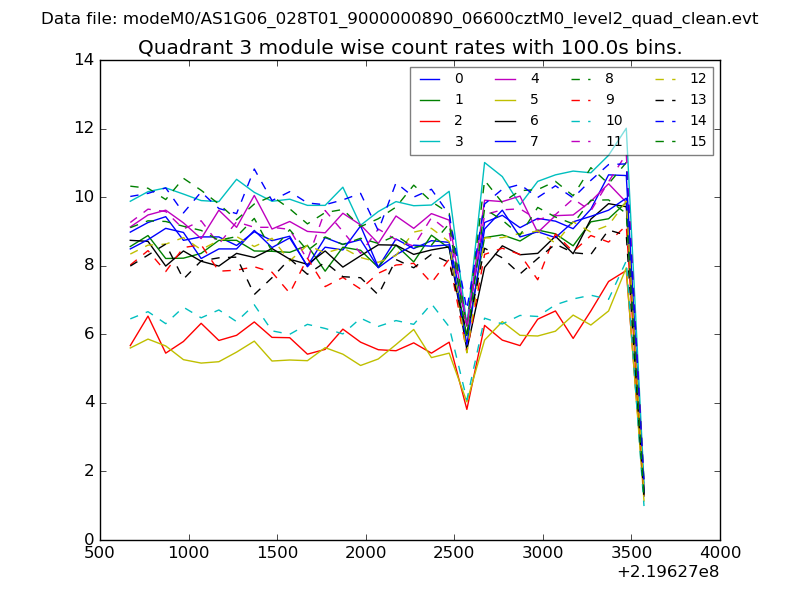
| Module-wise count rates for Quadrant C Data is divided into 100 sec bins |
 |
 |
| Module-wise count rates for Quadrant D Data is divided into 100 sec bins |
 |
 |
| Parameter | Plot |
|---|---|
| CZT HV Monitor | 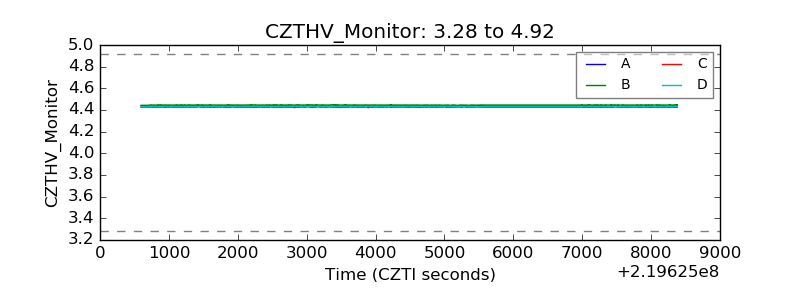 |
| D_VDD | 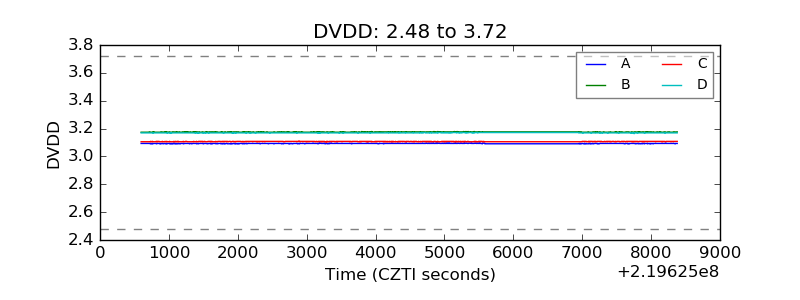 |
| Temperature 1 | 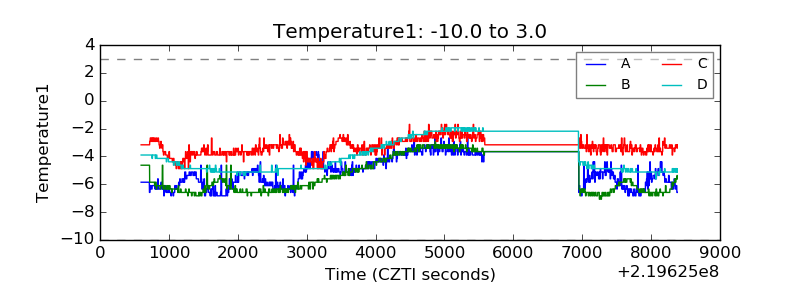 |
| Veto HV Monitor | 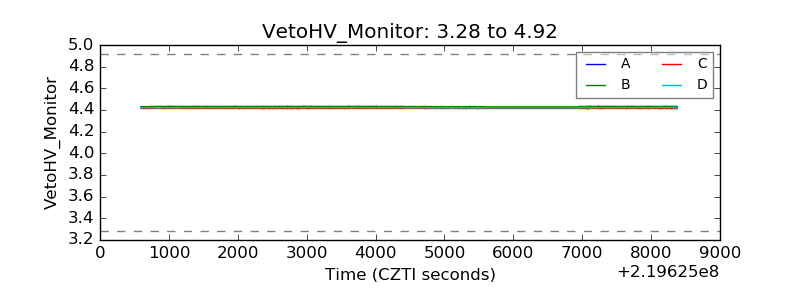 |
| Veto LLD | 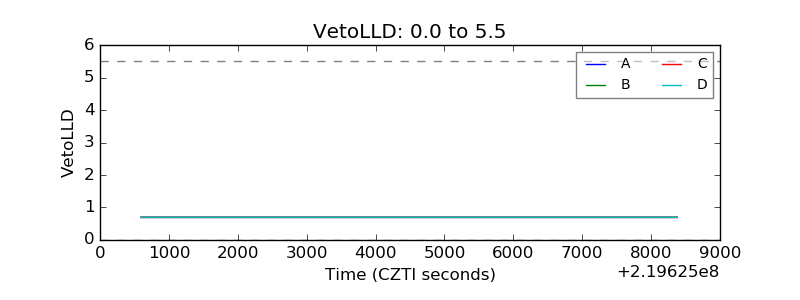 |
| Alpha Counter | 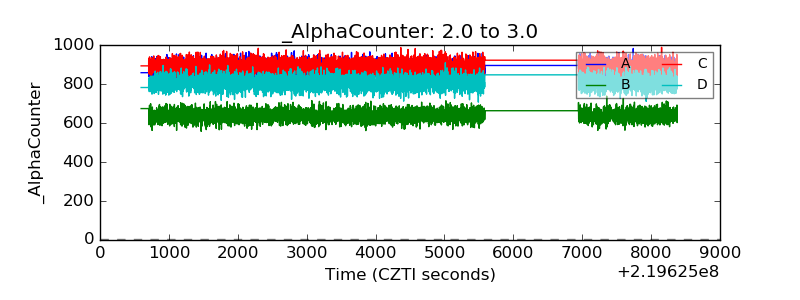 |
| _CPM_Rate | 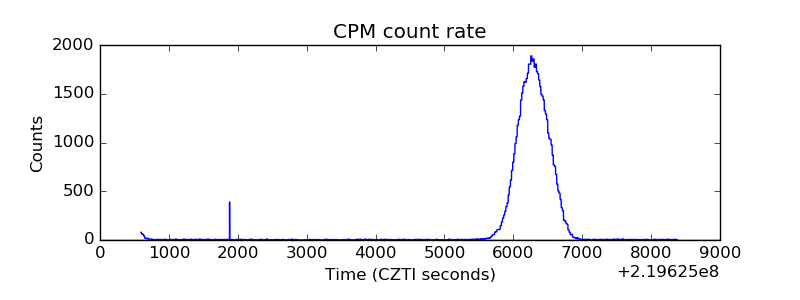 |
| CZT Counter | 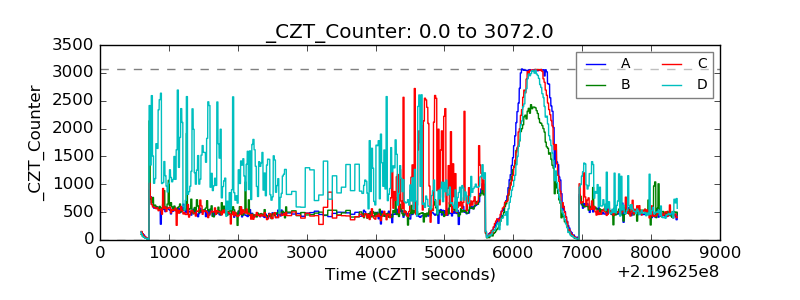 |
| +2.5 Volts monitor |  |
| +5 Volts monitor |  |
| _ROLL_ROT | 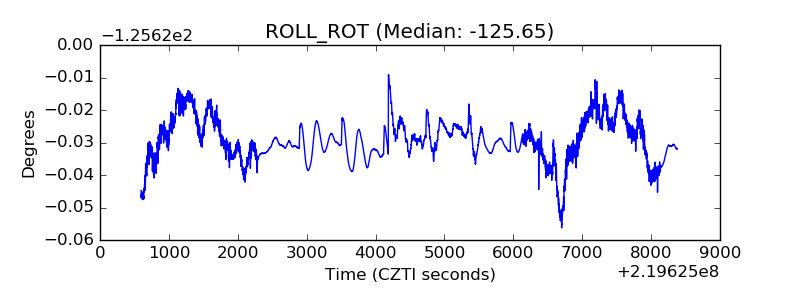 |
| _Roll_DEC | 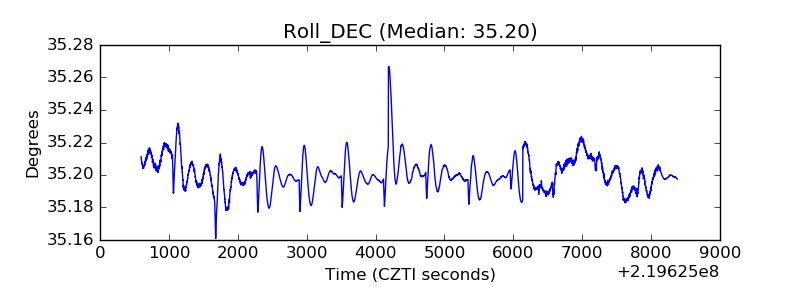 |
| _Roll_RA | 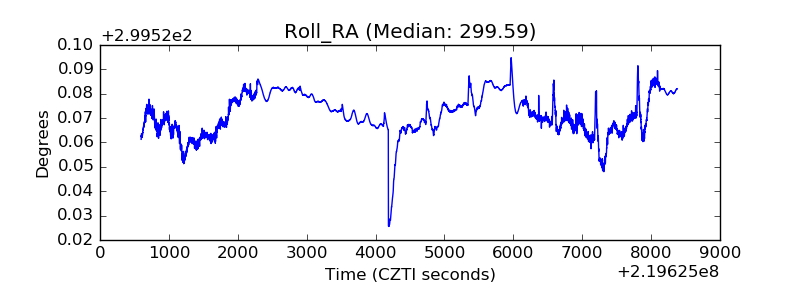 |
| Veto Counter | 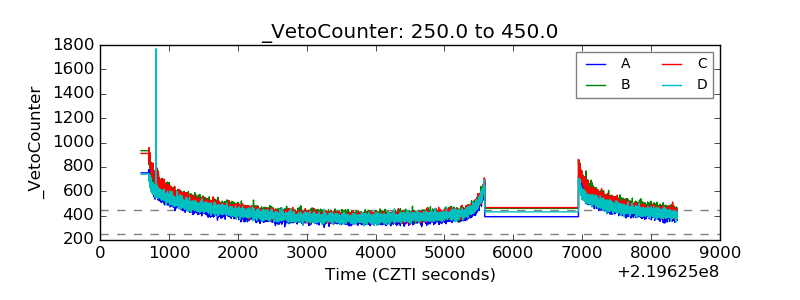 |